ISSN 2286-4822 www.euacademic.org
Impact Factor: 3.4546 (UIF) DRJI Value: 5.9 (B+)
Development of a psychometrically sound Scale of
Attitude towards E-Learning: A Preliminary Step
Dr. UZMA SIDDIQUI Assistant Professor Department of Education Aligarh Muslim University (A.M.U) Aligarh (U.P.), India
Abstract:
The aim of the present study was to develop a psychometrically sound scale of attitude towards E-Learning (SAEL). A total of 210 teacher trainees participated in this study. Factor analysis of the data from these participants identified a three-factor structure of the SAEL with 30 items. The three factors, namely, ‘Cognitive Component’, ‘Affective Component’ and ‘Conative Component’ together explained 44.82 % of the total variance. SAEL and its factors showed good internal consistency (Cronbach’s Alpha = 0.92 for SAEL, and more than 0.80 for the factors), good content and face validity. Thus, SAEL appeared to be a valid and reliable tool and therefore, may be used in further research on E-Learning.
Key words: Attitude, E-Learning, Factor analysis, Psychometric
procedures, Reliability, Validity
INTRODUCTION
helps them become more self-directed in the learning process. It prepares students for the future. By learning to use technology in the classroom, both teachers and students will develop skills essential for the 21st century. But more than that, students will learn the critical thinking and workplace skills they will need to be successful in their futures.
Electronic Learning or E-Learning is one of the most significant recent developments in the field of Information and Communication Technology (ICT) (Wang, 2003). E-learning encompasses related terms such as online learning, virtual learning, web-based learning, and distance learning (Panda & Mishra, 2007). E-Learning is simply defined as a delivery of course content via electronic media such as Internet, Intranet, satellite broadcast, audio/video tapes, interactive TV and CD-ROMs. Liaw, Huang, and Chen (2007) have defined E-Learning as the convergence of technology and learning, and as the use of network technologies to facilitate learning anytime, anywhere. E-Learning may prove quite beneficial to the learners in various ways like: (i) getting access to learning by breaking all barriers of time, pace and distance; (ii) providing individualized instruction suiting to the abilities, interests, learning styles and needs of the learners; (iii) promoting collaboration among learners from different localities and cultures across the world; and (iv) helping the students more interested and motivated (Mangal, 2009).
and print. Teachers may also use other web sites for illustration within their classroom lectures and provide students with links to other relevant sources of study materials. These are the usual practices followed by teachers working in different departments and centers of A.M.U., including Department of Education. The Department of Education offers a professional course, Bachelor of Education (B.Ed.), that prepares teachers for upper primary or middle (classes VI-VIII), secondary (classes IX-X) and senior secondary (classes XI-XII) levels of school education. B.Ed. essentially aims at providing teacher trainees with an insight into the educational scenario in the world with a specific reference to India and equips them with the latest knowledge and skills in the field of education. One of the foundation papers of B.Ed. is ‘Basics of Pedagogy’ that provides teacher trainees with the theoretical and practical aspects of teaching methods, skills, aids and ICT tools, including E-Learning. All this had made the researcher felt the need of developing a Scale of Attitude towards E-Learning (SAEL) that would enable to examine the attitudes and perceptions of teacher trainees and other students (who are in some way or the other familiar with and/or well-versed in E-Learning) towards E-Learning and its modes and components.
PURPOSE OF THE STUDY
The main purpose of this study was to develop a psychometrically sound Scale of Attitude towards E-Learning (SAEL).
OPERATIONAL DEFINITIONS OF KEY TERMS
E-Learning
However, the most well-known definition that educators agree on is that E-Learning is a set of synchronous and asynchronous instruction delivered to learners over technology (Colvin & Mayer, 2008).
In this study, E-Learning may be taken as an electronically carried out learning facilitated and supported by the use of advanced technology particularly calling for the services of computers, multimedia and networking. It includes the usage of smart phones, tablets, iPads, iPods, MP3 players, tape recorder, recorded audio and video tapes, CDs, DVDs, teleconferencing, audio-video conferencing, E-Mail, live chat,
web browsing and websites.
Scale of Attitude towards E-Learning (SAEL)
SAEL is developed on the basis of the theoretical framework put forward by Rosenberg and Hovland (1960). According to this framework, students’ attitude towards E-Learning cannot be regarded as a unitary concept, but rather as a complex of the following three components:
Cognitive Component: It has to do with beliefs, opinions and thoughts regarding the attitude object (in this study, E-Learning).
Affective Component: It relates to feelings (like or dislike) toward the attitude object. It is the emotional component of an attitude.
Conative Component: It is defined as an intention or plan of action (related to attitude object) in a particular context and under specific circumstances. This component is related to an individual’s readiness for action and likeliness to participate in an action.
According to this framework, the three components of SAEL can be taken in the following sense:
Cognitive Component represents the students’ perceptions
regarding E-Learning and its importance in teaching-learning process.
Affective Component represents the students’ sentiments
or feelings (positive or negative) that are considered as the affective side of the students’ attitude towards E-Learning.
Conative Component represents the students’ readiness
for action, likeliness and willingness to participate in an action as well as their most likely actions and behaviors to participate in E-Learning if they find it advantageous.
Attitude towards E-Learning
Aiken (2000) defined attitude as ‘a learned disposition to respond positively or negatively to certain objects, situations, institutions, concepts or persons’. Thus, attitude towards E-Learning can be considered as a preference along a dimension of favourableness or unfavourableness to various aspects of E-Learning.
In this study, Attitude towards E-Learning refers to students’ self-reported responses on three dimensions / components: Cognitive, Affective and Conative.
Participants
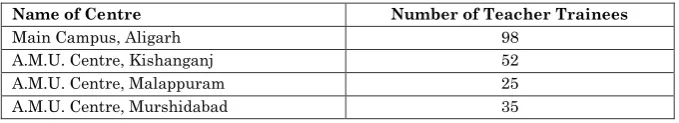
The participants for the present study were purposively selected. A total of 210 teacher trainees, who were enrolled in B.Ed. course during the session 2014-15, at Department of Education, A.M.U., participated in this study. These trainees belonged to the main campus and three centres of A.M.U. Centre-wise distribution of the sample is given in Table 1.
Table 1: Centre-wise Distribution of the Sample
Name of Centre Number of Teacher Trainees
Main Campus, Aligarh 98
A.M.U. Centre, Kishanganj 52
A.M.U. Centre, Malappuram 25
Development and Try Out of the Preliminary Draft of SAEL
SAEL was developed using Likert method, a technique for the measurement of attitudes (Likert, 1932). For constructing this Likert-type scale, the researcher collected and wrote a large number of statements that provided an adequate description about various components of SAEL. For this purpose, the researcher reviewed the relevant information available in the electronic and print media, textbooks, existing psychometric scales and research articles. Initial investigation of the related literature generated a long list of items pertaining to the determination of attitude towards E-Learning.
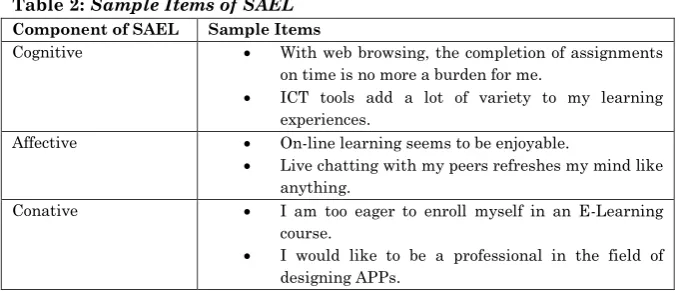
After a careful study of related literature and discussion with several experienced Computer Science teachers, teacher educators and software experts, the investigator formulated a variety of items which were to address various components of SAEL. A preliminary draft of 39 items was prepared to explore all the possible components of attitude towards E-Learning; 13 items for each component. Table 2 presents a few sample items of SAEL on each component. All the items were positively worded. Furthermore, the form of the item was also determined. The items of this draft were of multiple choice type having five alternatives: ‘strongly agree’, ‘agree’, ‘undecided’, ‘disagree’ and ‘strongly disagree’.
Table 2: Sample Items of SAEL
Component of SAEL Sample Items
Cognitive With web browsing, the completion of assignments on time is no more a burden for me.
ICT tools add a lot of variety to my learning experiences.
Affective On-line learning seems to be enjoyable.
Live chatting with my peers refreshes my mind like anything.
Conative I am too eager to enroll myself in an E-Learning course.
The preliminary draft of SAEL was administered over the sample of 210 teacher trainees. They responded to each of the items according to their extent of agreement or disagreement on a five-point scale. The scheme of scoring response categories involved differential weighting such that the response category, ‘strongly agree’ was given a weight of 5, ‘agree’ a weight of 4, ‘undecided’ a weight of 3, ‘disagree’ a weight of 2 and ‘strongly disagree’ a weight of 1, in respect of responses pertaining to positively worded items. Weights according to the positive polarity of items were given on all the 50 statements. The sum of these weights gave the SAEL score for a particular respondent.
PSYCHOMETRIC PROCEDURES
Validity
Validity refers to the extent to which an instrument measures what it is designed to measure (Singh, 1998). Validity is also considered as the strength of conclusions, inferences or propositions. The three types of validity were determined for SAEL: Face validity, content validity and construct validity.
Face Validity
Face validity indicates whether the attitude scale appears to be appropriate to the purpose of the study and content area. It evaluates the appearance of the attitude scale in terms of feasibility, readability, consistency of style and formatting, and the clarity of the language used (DeVon et al., 2007; Trochim, 2001). Thus, face validity is a form of usability.
education were purposively selected and completed the face validity form on a Likert scale of 1-4, strongly disagree = 1, disagree = 2, agree = 3, and strongly agree = 4. All the experts rated each parameter at three or four on a Likert scale of 1-4. Out of eight experts, 92 % indicated they understood the items and found them easy to answer, and 90 % indicated the appearance and layout would be acceptable to the intended target audience.
Content Validity
Content validity was undertaken to ascertain whether the content of the attitude scale was appropriate and relevant to the purpose of the study. Content validity indicates whether the content reflects a complete range of the attributes under study and is usually undertaken by seven or more experts (DeVon et al., 2007; Pilot & Hunger, 1999).
removed from SAEL. All the remaining items were valid with CVIs ranging from 0.87 (7/8) to 1.00 (8/8) and thus, were retained.
Construct Validity
Construct validity refers to the degree to which the items on an instrument relate to the relevant theoretical construct (DeVon et al., 2007; Kane, 2001). Construct validity is a quantitative value rather than a qualitative distinction between ‘valid’ and ‘invalid’. It refers to the degree to which the intended independent variable (construct) relates to the proxy independent variable (indicator) (Hunter & Schmidt, 1990). For example, in SAEL, cognitive, affective and conative components were used as proxy indicators of attitude towards E-Learning. When an indicator consists of multiple items, factor analysis is used to determine construct validity.
Several types of extraction methods are used to undertake factor analysis. The two most common forms are Principal Component Analysis (PCA) and Principal Axis Factoring (PAF). In PCA, all the variance of a variable (total variance) is analysed, while PAF only analyses common variance. Total variance consists of both specific and common variance. Common variance refers to the variance shared by the scores of subjects with the other variables, and specific variance describes the specific variance of a variable (Bryman & Cramer, 2005). Therefore, PCA is assumed to be perfectly reliable and without error and used on the 33 items of SAEL. Varimax, the most commonly used orthogonal rotation, was undertaken to rotate the factors to maximise the loading on each variable or factor and minimise the loading on other factors (Field, 2009).
DETERMINATION OF CONSTRUCT VALIDITY OF SAEL
It was carried out in the following step-wise manner:
Step 1: Item Analysis
Step 2: Factor Analysis
Inspection of the correlation matrix revealed a substantial number of coefficients .33 and above. The determinant of the R-matrix was .001 (>.00001, Field, 2009), indicating that there was no multicolinearity (very highly correlated variables) or singularity (perfectly correlated variables) problem. The Kaiser-Meyer-Olkin (KMO) measure verified the sampling adequacy for the analysis, KMO = 0.88 (KMO = between 0.8 and 0.9 is ‘great’ according to Field, 2009). Bartlett’s test of sphericity supported the factorability of the correlation matrix and indicated that correlations between items were sufficiently large for EFA. Data for the SAEL items were, therefore, subjected to EFA.
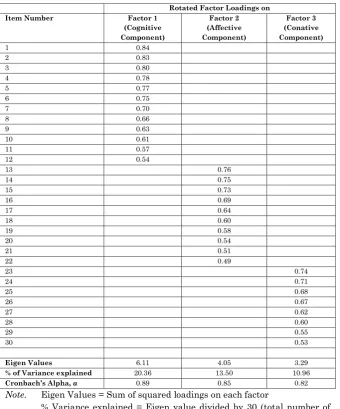
factor confirm that ‘Factor 1’, ‘Factor 2’ and ‘Factor 3’ represent ‘Cognitive Component’, Affective Component’ and ‘Conative Component’ respectively of SAEL.
Table 3: Summary of Results of Principal Component Analysis with
Varimax Rotation on SAEL
Rotated Factor Loadings on Item Number Factor 1
(Cognitive Component) Factor 2 (Affective Component) Factor 3 (Conative Component)
1 0.84
2 0.83
3 0.80
4 0.78
5 0.77
6 0.75
7 0.70
8 0.66
9 0.63
10 0.61
11 0.57
12 0.54
13 0.76
14 0.75
15 0.73
16 0.69
17 0.64
18 0.60
19 0.58
20 0.54
21 0.51
22 0.49
23 0.74
24 0.71
25 0.68
26 0.67
27 0.62
28 0.60
29 0.55
30 0.53
Eigen Values 6.11 4.05 3.29
% of Variance explained 20.36 13.50 10.96
Cronbach’s Alpha, α 0.89 0.85 0.82
Note. Eigen Values = Sum of squared loadings on each factor
Reliability
Reliability is the degree to which an instrument consistently measures whatever it is measuring and reliability coefficient indicates the consistency of the score produced (Gay & Airasian, 2006). Internal consistency reliability examines the inter-item correlations within an instrument and indicates how well the items fit together conceptually (Haladyna, 1999; DeVon et al., 2007; Nunnally & Bernstein, 1994). The two methods were used to examine the internal consistency reliability by using the scores of 210 subjects on 30 items of the final form of SAEL: Split-half reliability and Cronbach’s alpha.
Split-Half reliability
In Split-Half reliability, all items that measure the same construct are divided into two sets and the correlation between the two sets is computed. A split-half reliability coefficient was found by correlating the scores of the subjects on odd items of SAEL with their scores on even items. The correlation coefficient thus obtained was 0.83 which when corrected by Spearman Brown Prophecy formula increased to 0.90.
Cronbach’s Alpha
following rule of thumb for the values of alpha: > 0.9 excellent, > 0.8 good, > 0.7 acceptable, > 0.6 questionable, > 0.5 poor, < 0.5 unacceptable.
The alpha coefficient for the SAEL was found to be 0.92, which is excellent to be acceptable. The alpha coefficients for ‘Cognitive Component’, Affective Component’ and ‘Conative Component’ were 0.89, 0.85 and 0.82 respectively, as shown in Table 3. All these values are good to be acceptable.
DISCUSSION
The integrity of any research depends on the accuracy of the measures used, especially when exploring complex theoretical construct such as attitudes. The results of the validity testing on SAEL indicated it is an accurate measure of attitude towards E-Learning. The processes used to validate SAEL were rigorous and appropriate. While face validity is the lowest form of validity, it was useful in providing important information about the operationalisation of SAEL by students. Content validity helped assess whether the content was relevant to the concept of attitude towards E-Learning as defined in this study. Factor analysis assessed the theoretical construct of SAEL. The internal consistency reliability (alpha) reached the recommended level. Therefore, SAEL could be used appropriately with students.
to support the generalisability of SAEL. As with many other studies, this study suffers from a number of limitations, suggesting avenues for future studies. The first limitation is the reliance on a sample of small size. Though the minimum sample required for factor analysis was satisfied here, future studies on larger samples can increase the reliability coefficients, confirm the factor structure and other psychometric properties of SAEL. A second shortcoming is the use of B.Ed. trainees of A.M.U. Such a sample of convenience facilitates the early phase of a scale construction, but generalizing results to other students enrolled in different undergraduate and post-graduate may not be warranted. So, future studies should address the question of validating the SAEL on other students. A third limitation of this study is that it did not examine the temporal stability of SAEL. Future studies can consider examining its temporal stability. Despite these limitations, the present study can serve as a base for opening the door of further research on SAEL in India.
CONCLUSION AND IMPLICATIONS
SAEL can aid teachers and researchers in evaluating whether the students’ attitude towards E-Learning is favourable, neutral or unfavourable. This can help them further in identifying those aspects of E-Learning that are feasible to be adopted inside as well as outside the regular classrooms in order to make teaching and learning of different academic subjects more interesting and engaging for their students. This information would guide teachers as well as researchers in planning and designing the kind of E-Learning based classroom environment and activities that might raise students’ interest and motivation in studying and mastering academic subjects.
REFERENCES
Aiken, R. L. (2000). Psychological testing and assessment (10th ed.). Boston: Allyn & Bacon.
Bryman, A., Cramer, D. (2005). Quantitative Data Analysis
with SPSS 12 and 13. A Guide for Social Scientists.
East Sussex: Routledge.
Colvin, R., & Mayer, R. (2008). E-learning and the science of
instruction. California: John Wiley.
Delaney, C. (2005). The Spirituality Scale, Development and Psychometric Testing of a Holistic Instrument o Assess the Human Spiritual Dimension. Journal of Holistic
Nursing, 23(2), 145-167.
DeVon, H. A., Block, M. E., Moyle-Wright, P., Ernst, D. M., Hayden, S. J., & Lazzara, D. J. (2007). A psychometric toolbox for testing validity and reliability.
Journal of Nursing scholarship, 39(2), 155-164.
Field, A. (2009). Discovering statistics using SPSS (3rd ed.). Los Angeles: Sage Publications.
Gay, L. R., & Airasian, P. (2006). Educational Research:
Competencies for analysis and applications (6th ed.).
George, D., & Mallery, P. (2001). SPSS for windows step by
step: a simple guide and reference 10.0 update (3rd ed.).
Toronto: Allyn and Bacon.
Haladyna, T. (1999). Developing and Validating multiple-choice
test items. New Jersey: Lawrence Erlbaum.
Hunter, J.E., Schmidt, F. L. (1990). Methods of meta-analysis:
Correcting errors and bias in research findings.
Newsbury Park: Sage Publications.
Kane, M. (2001). Current concerns in validity theory. Journal of
Educational Measurement, 38, 319-342.
Liaw, S., Huang, H., & Chen, G. (2007). Surveying instructor and learner attitudes toward E-Learning. Computers &
Education, 49(4), 1066-1080.
Likert, R. (1932). A technique for measurement of attitudes.
Archives of Psychology, 140, 5-55.
Lynn, M.R. (1996). Determination and quantification of content validity. Nursing Research, 35, 382-385.
Mangal, S. K. (2009). Essentials of educational technology. New Delhi: PHI Learning.
Munro, B.H. (2005). Statistical methods for health care
research. Philadelphia: Lippincott, Williams & Wilkins.
Nunnally, J.C., & Bernstein, I. H. (1994). Psychometric theory. New York: McGraw-Hill.
Panda, S., & Mishra, S. (2007). E-Learning in a mega open university: Faculty attitudes, barriers, and motivation.
Educational Media International, 44(4), 323-338.
Pilot, D., & Hunger, B. (1999). Nursing research: principals and
methods. Philadelphia: Lippincott Williams & Wilkins.
Rosenberg, M.J., & Hovland, C. I. (1960). Cognitive, affective and behavioral components of attitudes. In M.J. Rosenberg, C.I. Hovland, W. McGuire, R.P. Abelson, & J.W. Brehm Eds.), Attitude, organization and change: An
analysis of consistency among attitude components, (pp.
Singh, A.K. (1998). Tests, measurements and research methods
in behavioural sciences. Patna, Bihar: Bharati Bhawan.
Trochim, W.M.K. (2001). The Research Methods Knowledge Base. Cincinnati: Atomic Dog.
Wang, Y. (2003). Assessment of learner satisfaction with asynchronous electronic learning systems. Information
& Management, 41(1), 75-86.
Welsh, E., Wanberg, C., Brown, K., & Simmering, M. (2003), E-learning: emerging uses, empirical results and future directions. International Journal of Training and