APPLICATION OF KOHONEN NEURAL NETWORK AND
ROUGH APPROXIMATION FOR OVERLAPPING CLUSTERS
OPTIMIZATION
M.N.M. Sap', E. Mohebi2
1,2Faculty of Computer Science and Information Systems University Teknologi Malaysia
81300 Skudai, Johor
Email: [email protected]@siswa.utm.my
Abstract: In this paper, the Kohonen Self Organizing Map one of the most popular tools in the exploratory phase of pattern recognition is proposed for clustering the input data. Recently researchers found that to have precise and optimized clustering operations and also to capture the ambiguity that comes from the data sets, it is not necessary to have crisp boundaries in some clustering operation. To overcome the mentioned ambiguity, two variation of cluster approximation (upper and lower) have been applied by Rough set theory. In the first stage the SOM is employed to produce the prototypes then, in the second stage the rough set is applied on the output grid of SOM to detect the ambiguity of SOM clustering. One of the most general optimization techniques (Simulated Annealing) have been adopted to assign the overlapped data to true clusters they belong to by minimizing the uncertainty criteria. Experiments show that the proposed two-level algorithm is more accurate and generates fewer errors as compared with crisp clustering operations.
Keywords: Clustering,' Self Organizing Map, Ambiguity, Simulated Annealing, Overlapped data.
1. INTRODUCTION
. The Self Organizing Map (SOM) proposed by T.Kohonen (1982), has been widely used in industrial applications such as pattern recognition, biological modelling, data compression, signal processing and data mining (T. Kohonen, 1997; M.N.M Sap and E. Mohebi, 2008a, 2008b, 2008c). It is an unsupervised and nonpararnetric neural network approach. The success of the SOM algorithm lies in its simplicity that makes it easy to understand, simulate and be used in many applications. The basic SOM consists of neurons usually arranged in a two dimensional structure such that there are neighbourhood relations among the neurons. After
I
] : completion of training, each neuron is attached to a feature vector of the same dimension as
input space. By assigning each input vector to the neuron with nearest feature vectors, the SOM is able to divide the input space into regions (clusters) with common nearest feature vectors. This process can be considered as performing vector quantization (VQ) (R.M. Gray, 1984). In addition, because of the neighborhood relation contributed by the inter-connections among neurons, the SOM exhibits another important property of topology preservation.
Clustering algorithms attempt to organize unlabeled input vectors into clusters such that points within the cluster are more similar to each other than vectors belonging to different clusters (N. R. Pal, et aI., 1993). The clustering methods are of five types: hierarchical clustering, partitioning clustering, density-based clustering, grid-based clustering and model based clustering (J. Han and M. Kamber, 2000). The rough set theory employs two upper and
lower thresholds in the clustering process, which result in a rough clusters appearance. This technique also could be defined in incremental order i.e. the number of clusters is not predefined by users.
In this paper, a new two-level clustering algorithm is proposed. The idea is that the first level is to train the data by the SOM neural network and then clustering at the second level is a rough set based incremental clustering approach (S. Ashraf, et aI., 2006), which will be applied on the output ofSOM and requires only a single neurons scan. The optimal number of clusters can be found by rough set theory, which groups the given neurons into a set of overlapping clusters (clusters the mapped data respectively). Then the overlapped neurons will be assigned to the true clusters they belong to, by apply simulated annealing algorithm. A simulated annealing algorithm has been adopted to minimize the uncertainty that comes from some clustering operations. In our previous work (M.N.M. Sap and E. Mohebi, 2008a) the hybrid SOM and rough set has been applied to catch the overlapped data only, but the experiment results show that the proposed algorithm (SA-Rough SOM) outperforms the previous one.
This paper is organized as following; in section 2, the basics of SOM algorithm are outlined. The Incremental Clustering and Rough set theory are described in section 3. In section 4, the essence of simulated annealing is described. The proposed algorithm is presented in section 5. Section 6 is dedicated to experiment results, section 7 provides brief conclusion, and future works.
2. SELF ORGANIZING MAP AND CLUSTERING
Competitive learning is an adaptive process in which the neurons in a neural network gradually become sensitive to different input categories, sets of samples in a specific domain
Jilid 20, Bil. 4 (Disember2008) Jumal Teknologi Maklumat
of the input space. A patterns of the inputs l The division is the neuron that is best better. Ifthere exist ar lattice, the competitiv but also its neighborin final map becomes a algorithm. The SOM one or two dimension:
The basic SOli vector Wi = [Wil.···' Wid for the training set. D neuron, denoted by c,
A set of neighb the neighborhood ken kernel function is a nc winning neuron c. Th
where Pos, is t The weight update rul
Both learning During training, the training data. Because
same direction, and tl
are many variants of
of the input space. A division of neural nodes emerges in the network to represent different patterns of the inputs after training.
The division is enforced by competition among the neurons: when an input x arrives, the neuron that is best able to represent it wins the competition and is allowed to learn it even better. If there exist an ordering between the neurons, i.e. the neurons are located on a discrete lattice, the competitive learning algorithm can be generalized. Not only the winning neuron but also its neighboring neurons on the lattice are allowed to learn, the whole effect is that the final map becomes an ordered map in the input space. This is the essence of the SOM algorithm. The SOM consist of m neurons located on a regular low-dimensional grid, usually one or two dimensional. The lattice of the grid is either hexagonal or rectangular.
The basic SOM algorithm is iterative. Each neuron i has a d -dimensional feature vector Wi
=
[Wi l •..., Wid] . At each training step I, a sample data vector X(/) is randomly chosen for the training set. Distance between X(/) and all feature vectors are computed. The winning neuron, denoted by c, is the neuron with the feature vector closest to x(t) :c = arg min Ilx(t) - Will, iE
{I,..., m}
I (1)
A set of neighboring nodes of the winning node is denoted as Nc • We define hi«/) as the neighborhood kernel function around the winning neuron c at time I. The neighborhood kernel function is a non-increasing function of time and of the distance of neuron i from the winning neuron c. The kernel can be taken as a Gaussian function:
~Po,\'{-po.\·cf
217(1)' (2)
where Pos, is the coordinates of neuron i on the output grid and 0'(/) is kernel width. The weight update rule in the sequential SOM algorithm can be written as:
(3)
Both learning rate e(t) and neighborhood a(t) decrease monotonically with time. During training, the SOM behaves like a flexible net that folds onto a cloud formed by training data. Because of the neighborhood relations, neighboring neurons are pulled to the same direction, and thus feature vectors of neighboring neurons resemble each other. There are many variants of the SOM (Yan and Yaoguang, 2005; M.N.M. Sap and E. Mohebi,
2008d). However, these variants are not considered in this paper because the proposed
algorithm is based on SOM, but not a new variant of SOM.
3. INCREMENTAL CLUSTERING AND ROUGH SET THEORY
3.1 Incremental Clustering
Incremental clustering (A. K Jain, et aI., 1999) is based on the assumption that it is possible to
consider data points one at a time and assign them to existing clusters. Thus, a new data item
is assigned to a cluster without looking at previously seen patterns. Hence the algorithm
scales well with size of data set.
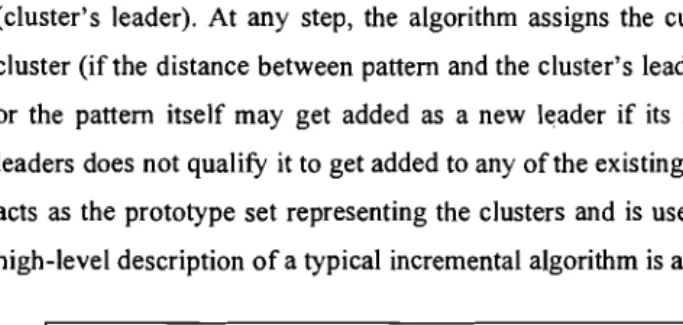
It employs a user-specified threshold and one of the patterns as the starting leader
(cluster's leader). At any step, the algorithm assigns the current pattern to the most similar
cluster (if the distance between pattern and the cluster's leader is less or equal than threshold)
or the pattern itself may get added as a new leader if its similarity with the current set of
leaders does not qualify it to get added to any of the existing clusters. The set of leaders found
acts as the prototype set representing the clusters and is used for further decision making. A
high-level description of a typical incremental algorithm is as figure I (Stahl. H., 1986).
Incremental_Clustering (Data, Thr) (
Cluster_Leader = dl;
While (there is unlabeled data) (
For (i = 2 to N)
If (dis (Cluster_Leader, di) <= Thr)
Put di in the same cluster as Cluster Leader;
Else
II new Cluster
Cluster Leader di;
lilend of while
Figure I. Incremental clustering algorithm
An incremental clustering algorithm for dynamic information processing was presented
by Can.F. (1993). The motivation behind this work is that, in dynamic databases, items might
get added and deleted over time. These changes should be reflected in the partition generated
without significantly affecting the current clusters. This algorithm was used to cluster
incrementally a database of 12,684 documents.
The quality of a I (S.c. Sharma and A. W
3.2 Incremental Clusn
This algorithm is a soft
groups the given data s
lower approximation an
U is a set of all object! C; E U are required to f I. 0 ~ ACC;) ~ACC;
2. ACC;)nACCj)=~
3. ACC;)nACCj)=0
4. If an object Uk E
to two or more l
Note that (1)-(4)
understanding the basic
The lower appro:
cluster C and the upper
permits overlaps, each
indiscernible set. Thus,
upper approximation. E:
soft clusters (clusters w
level description of a roi For a rough set,
distinct possibilities:
1. Both Uk and Uh a
2. Object Uk is in
approximation
A(
3. Both Uk and Uh
applicable.
Jilid 20, Bi\.4 (Disember 21
Jilid 20, Bll, 4 (Disember 2008) Jumal Teknologi Maklumat
The quality of a conventional clustering scheme is determined using within group error (S.c. Sharma and A. Werner, 1993) n given by:
m
IJ. =
L L
distance (u., Uk)1=1 "11,rtkeC/ (4)
u ; , U k are objects in the same cluster Ci .
3.2 Incremental Clustering and Rough set theory
This algorithm is a soft clustering method employing rough set theory (Pawlak Z., 1982). It groups the given data set into a set of overlapping clusters. Each cluster is represented by a lower approximation and an upper approximation (.i(C),A(C» for every cluster C S; U . Here U is a set of all objects under exploration. However, the lower and upper approximations of C, E U are required to follow some of the basic rough set properties such as:
1. 0s;A(Cj ) s ; A ( Cj ) s ; U
2. A(C;) n A(Cj )
=
0, i *-j3. .i(Cj)nA(Cj ) =0, i*-j
4, If an object Uk E U is not part of any lower approximation, then it must belong to two or more upper approximations.
Note that (1)-(4) are not independent. However enumerating them will be helpful in understanding the basic of rough set theory.
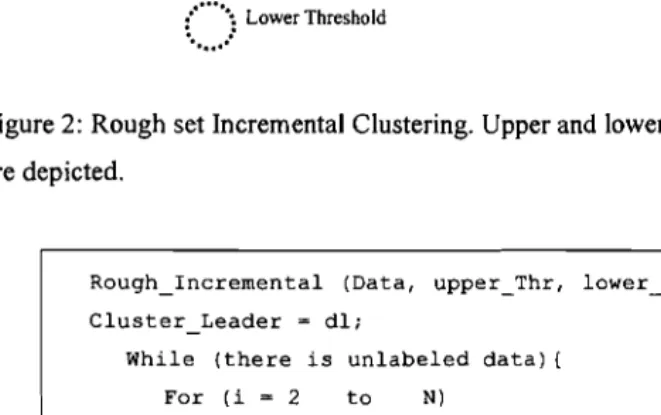
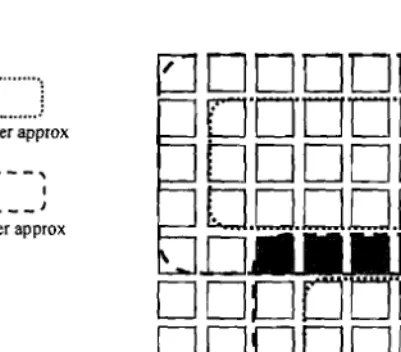
The lower approximation .i(C) contains all the patterns that definitely belong to the cluster C and the upper approximation A(C) permits overlap. Since the upper approximation permits overlaps, each set of data points that are shared by a group of clusters define indiscernible set. Thus, the ambiguity in assigning a pattern to a cluster is captured using the upper approximation. Employing rough set theory, the proposed clustering scheme generates soft clusters (clusters with permitted overlap in upper approximation) see figure 2. A high level description of a rough incremental algorithm is as figure 3 (Lingras, et aI., 2004).
For a rough set clustering scheme and given two objects Uh,Uk E U we have three
distinct possibilities:
1. Both Uk and Uh are in the same lower approximation A(C) .
2. Object Uk is in lower approximation A(C) and Uh is in the corresponding upper
approximation A(C), and case 1 is not applicable.
3. Both Uk and Uh are in the same upper approximation A(C), and case I and 2 are not
applicable.
" ,
...
--
...; '
"
...
--
....
The total error~ ,~' 1 ... ,
,
,
~,
I •••••••••;... ~"I
,
,/ ( " ' " , ','\,:,"if···;....
'<, :...
>.\ \,
1
!
~
\ ••• 2 2 \ 2 j 2 I I I I I I :: , 2 I: I 1 I I : I
\ 2 ... I ,". /1 I
\ . . . ..' \ ' . • I correspond:
\ 2 " , . . . I I ••••••• I ,
, , \ I
...
~,
,
weight WI should...
,-_
...
~"", ,~... _ ... *"'"
, - \ Upper Threshold
...
,
BASIC OF SIMl...~ Lower Threshold
~
..
ulated Annealing
Figure 2: Rough set Incremental Clustering. Upper and lower approximations for two clusters lems by incorpc
are depicted. h of optimal sc
ts from whic
Consider two 5
Rough_Incremental (Data, upper_Thr, lower_Thr){
Cluster_Leader = dl;
While (there is unlabeled data) {
For (i = 2 to N)
If (distance (Cluster_Leader, di) <= lower_Thr)
Put di in the lower approx of Cluster Leader;
Else If (distance (Cluster_Leader, di) <= upper_Thr)
Put di in all existing clusters (j=l to k)that
distance {Cluster_Leaderj, di) <= upper_Thr ;
Else
II new Cluster
Cluster Leader di;
Illend of while
Figure 3: Rough set Incremental Clustering algorithm.
For these possibilities, three types of equation (4) could be defmed as following:
'lC;:ase 1. If
ss
L.
distance (UIr , uk);=1 u/r,likE,d(X j )
"')next
step.m
=
L.
L.
distance (U Ir , Uk)(5)
Case
2. Ifss
~d 2
;=1 ".e,i(X,j and UkeA(Xi)
m
d 3
=
L.
~distance (UIr , uk);=1 u.'''keA(Xi) ....,ibabi·lity, Ieee
The total error of rough set clustering will then be a weighted sum of these errors:
f'j./o/a/ =W,xf'j.I+ W2 xf'j.Z+W Jxf'j.J
(6)
Since f'j.l corresponds to situations where both objects definitely belong to the same cluster,
the weight WI should have the highest value.
4. BASIC OF SIMULATED ANNEALING GREEDY SEARCH
Simulated Annealing (Larahoven and Aarts, 1987) tries to overcome the local minima problems by incorporating probabilistic, rather than strictly deterministic approaches, in search of optimal solutions (see figure 4). We briefly overview the statistical mechanics aspects from which simulated annealing is conceived (Munakala, T., 2008). In thermodynam ics, the probability of finding the system in a particular state with the energy E
and temperature T is proportional to the Boltzmann probability:
£
(7) e kT where k is the Boltzmann constant.
Consider two state Sf and Sz with energy EJ and Ez , and the same temperature T. The ratio of probabilities of the two states is as following:
[£,-£,1
e kT (8)
In our proposed method, the process of simulated annealing is as follows:
I. Randomly select solution vector x for the Olb iteration. Set T to To.
2. Compute x p a perturbed solution of x. x p maybe obtained by randomly swapping two instances in x. Determine M = E(x p) - E(x).
3. Case 1.If M < 0, i.e., xp is a better solution than x then select xp as new x for the next step.
Case2. If M ~0, select xp with
-AE e T
probability, keep current x with
-6£
I-e T
Probability .
4. Repeat step 2 and 3 until
16.£1
is small enough.5. Reduce T by, for example. Tnell' = 0.9 x T,w,ent . Repeat step 2 through 4. Terminate the entire process when T reduces zero or a small number.
Random start Climb peak Repeat
Figure 4: Simulated Annealing searching process
In step 5 of the process, we reduce the temperature T, that is, we perform annealing. There is a trade-off between the reducing speed and finding the optimal solution. If the cooling speed is slow the global minimum may be guaranteed, but in this paper, to guarantee the global minimum a very slow reducing scheme is proposed as following:
T. - To where t is the t' h iterate. (9)
I - log(l +t)
5. ROUGH SET CLUSTERING OF THE SOM USING SIMULATED ANNEALING
We had successful experiments on our previous work, Rough SaM (M.N.M. Sap and E. Mohebi, 2008a), but to assign overlapped data to true cluster they belong to, the simulated annealing is employed. In this paper rectangular grid is used for the SaM. Before training process begins, the input data will be normalized. This will prevent one attribute from overpowering in clustering criterion. The normalization of the new pattern Xi = {Xii ,,,,,Xid}
for i= 1,2,..., N is as following:
X; - min(att)
X = Y J (10) 1/ max( aftJ ) - mineattJ )
Once the training phase of the SaM neural network completed, the output grid of neurons which is now stable to network iteration, will be clustered by applying the rough set
Jilid 20, Bil. 4 (Disember 2008) Jumal Teknologi Maklumat
algorithm as describ clustering of neuron proposed method (se from being processec From the roug indiscernible (those I certain level of simi similarity relation ha
According to d overlapped data (tho: calculate errors and results of the SaM distances to each m
following matrix:
The distance be
M . Simulated anneal
optimize the cIusterin neurons. The possible which minimize the er
After the algor overlapped data are as:
algorithm as described in the previous section. The similarity measure used for rough set clustering of neurons is Euclidean distance (the same used for training the SOM). In this proposed method (see Figure 5) some neurons, those never mapped any data are excluded from being processed by rough set algorithm.
From the rough set algorithm it can be observed that if two neurons are defined as indiscernible (those neurons in the upper approximation of two or more clusters), there is a certain level of similarity they have with respect to the clusters they belong to and that similarity relation has to be symmetric. Thus, the similarity measure must be symmetric.
According to the rough set clustering of the SOM, overlapped neurons and respectively overlapped data (those data in the upper approximation) are detected. In the experiments, to calculate errors and uncertainty, the previous equations (5) and (6) will be applied to the results of the SOM (clustered and overlapped data). The n overlapped neurons and the distances to each rn cluster centers they belong to (overlapped) could be represented as the following matrix:
M
+ -d II
d 21
Exsiting
d 12
d 22
Clusters -~
dim d 2 m
d n1 d nm
The distance between neuron i and the cluster centre j is determined as dii in matrix M. Simulated annealing is then applied to the set of distances to minimize the (II) which optimize the clustering operation by assigning the nearest cluster centre to the overlapped neurons. The possible optimum-selected vector x = (vl,V2,'ooVn) could be as (dJI,d4Z,oo.dpq) , which minimize the energy function as given as following:
F
I
n
I
m dij (11);=1 j= I
After the algorithm terminated, the clustering scheme would be as figure 6. The overlapped data are assigned to true clusters they belong to efficiently.
6. EXPERU
EJDDDDDCJDDD
C::::::::J
O"O'DO'DDDDD
To demonstraiLowerapprox
Incremental c
,-
- - -
'\DDDDDDDDD
I I
\ J has been done
0,0.00.0
ODD
Upperapprox
The firs
o
ODD
and in the s(DDDO"O '0"000
compared to
DD DDDDODD
clustering of SDO D.DDDDDD
that the value00
0
100 epochs onRough 80M
configured as 1
The arti: Figure 5: Rough set clustering of the output grid ofSOM. and once with
is gained by th The aim of the proposed clustering approach is making the simulated annealing, which in clustering pi
is applied to the rough SOM to be as precise as possible. Therefore, a precision measure
needs to be used for evaluating the quality of the proposed approach. A possible precision Tal measure can be defmed as the following equation (Pawlak, Z., 1982):
. Number of objects in lowerapprox
certainty
=---"---'-''--
(12)Total numberof objects
II Table 2: The (
I I I
2
I I
data set, from'
2 I II I I I I
2 2 2
I
2 I I I
I I
/
".
The sec
Figure 6: The new border for clusters limit is highlighted, which shows the efficient
Database, hal assignment of the overlapped data between two clusters.
dimensions. 1 plant is lineal
Jilid 20, BiI.4 (
Jilid 20,
nu
4 (Disember 2008) Jumal Teknologi MakJumat6. EXPERIMENT RESULTS
To demonstrate the effectiveness of the proposed clustering algorithm SA-RSOM (Rough set Incremental clustering of the SOM using Simulated Annealing), two phases of experiments has been done on two data sets, one artificial and one real-world data set.
The first phase of experiments presents the certainty that comes from the both data sets and in the second phase the errors has been generated. The results of SA-RSOM are compared to RI-SOM (M.N.M. Sap and E. Mohebi, 200Sb) and I-SOM (Incremental clustering of SOM) (M.N.M. 'Sap and E. Mohebi, 200Sc). The input data are normalized such that the value of each datum in each dimension lies in [0,1]. For training, SOM lOx 10 with
100 epochs on the input data is used. The general parameters for the SA algorithm have been configured as table I.
The artificial data set has 569 data of 30 dimensions, which is trained once with I-SOM and once with RI-SOM then at last trained with SA-RSOM. The generated certainty (figure 7) is gained by the equation (12). From the table 2, it could be observed that the certainty-level in clustering prediction of SA-RSOM is more accurate compare to RI-SOM and I-SOM.
Table I: The general parameters of the simulated annealing algorithm.
TO 0.65
Number ofSteps 100 Decrement Ratio 0.9 Boltzmann Probability(k) Random in (0,1) The Ratio of Probability [Fy-Fzl
according to equation (10) e kT
Table 2: The certainty-level generated by I-SOM, RI-SOM and SA-RSOM on the artificial data set, from epoch 100 to 500.
Epoch 100 200 300 400 500
I-SOM 56.29 67.78 79,91 91.29 92,51
RI-SOM 72,23 78,96 84,32 94.33 98.21
SA-RSOM 82.49 85.45 87.01 96.75 98.65
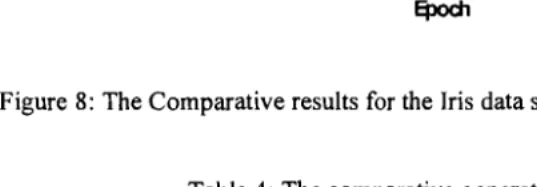
The second data set is Iris data set from the DC Irvine Machine Learning Repository Database, has been widely used in pattern classification. It has 150 data points of four dimensions. The data are divided into three classes with 50 points each. The first class of Iris plant is linearly separable from the other two. The other two classes are overlapped to some
extent. Figure 8, shows the certainty generated from epoch 100 to 500. From the gained
100 certainty, it is obvious that the SA-RSOM could efficiently detect the overlapped data that
90 have been mapped by overlapped neurons (table 3).
80 70 ~60
I-SJM --- R1-s:>M - -~-R!DM ~50
100
--.----.---. -_._--
---.--~=====--11B40
90
.
.~ . 30+- --_._.-.---;.
80 ----~~ 20
70 r - I
10
~ 60
o
'iiI 50 1::
a
40 3020 I
Figure 8: The Co
10
I
0+----,---...,.---,.---,,---1
100 200 300 400 500
Epoch
Artificial
Figure 7: The Comparative results for the artificial data set, from epoch 100 to 500. set
Iris Data
Table 3: The certainty-level generated by I-SOM, RI-SOM and SA-RSOM on the Iris data
set, from epoch 100 to 500.
Epoch
I-SOM R1-S0M SA-RSOM
100 200 300 400 500
33.33 67.07 65.23 73.02 76.0/ 81.98 89.47 91.23 92.0/
97.33 7. CONCLUSION ANI
69.35 72.54 82.26 95.27 9B.05
In this paper a two-level!
clusters of high dimensio In the second phase, the same initialization for the SOM has been used. Our proposed
data. The approach is bas
algorithms have generated the errors (table 4) that come from both data sets, according to the
detects overlapped data fi
equations (5) and (6). The weighted sum equation (6) has been configured as following: is
applied to find the tru indicate that SA-RSOM 3
LW;=l
clustering (I-SOM).;=\
Subject to: (13)
The proposed algorith
Wi =!x(4-i).
6 belong to, by assigning}
weight can be assigned tc
'Jilid 20, BiI.4 (Disember 20
1-9JM - - R1-9JM - SA-R9JM ~-~~._.. •. _ ~~~'._._.-._,,--_. -~.~.~._~"_~·o_,, ·_ _."~·.·.~--'---~--~,.---··--·... -f
100
---
\90
80 70
~ 60
~50
B40 30
20 10
0+---.---.---...- - - . - - - - ;
100 200 300 400 500
Epoch
Figure 8: The Comparative results for the Iris data set, from epoch 100 to 500.
Table 4: The comparative generated errors Method 6 1 6 2 6 3 .6/lJ / al
Artificial Data set
SA-RSOM 0.6 0.88 0.04 1.4
I-80M 1.8
Iris Data set SA-RSOM 1.05 0.85 0.043 1.94
I-SOM 2.8
7. CONCLUSION AND FUTURE WORK
In this paper a two-level based clustering approach (SA-RSOM), has been proposed to predict clusters of high dimensional data and detect the uncertainty that comes from the overlapping data. The approach is based on the rough set theory that employs a soft clustering which can detects overlapped data from the data set and makes clustering as precise as possible, then SA is applied to find the true cluster for each overlapped data. The results of the both phases indicate that SA-RSOM is more accurate and generates fewer errors as compare to crisp clustering (I-SOM).
The proposed algorithm detects accurate overlapping clusters in clustering operations. As the future work, the overlapped data also could be assigned correctly to true clusters they belong to, by assigningjuzzy membership value to the indiscernible set of data. In addition, a weight can be assigned to the data's dimension to improve the overall accuracy.
ACKNOWLEDGEMENTS
The Research Management Centre, University Technology Malaysia (UTM) and the
Malaysian Ministry of Science, Technology and Innovation (MOST!) supported this research
under vote number 19224.
REFERENCES
A.K., Jain, M.N., Murty, and PJ., Flynn, 1999. Data Clustering: A Review. ACM Computing
Surveys (31) (3) pp. 264-323.
Can, F., 1993. Incremental Clustering for dynamic information peocessing. ACM Trans. Inf.
System (II) 2, pp. 143-164.
1. Han and M. Kamber, 2000. Data mining: concepts and techniques. Morgan-Kaufman, San Francisco.
Larhoven, P.1.M. and Aarts E.H.L., 1981. Simulated Annealing: Theory and Applications.
Springer. Berlin. Germany,
Lingras, PJ., and West, C., 2004. Interval set clustering of web users with rough K-means. J.
Intelligent Inf. Syst. (23) (I) pp.5-I6.
M.N.M Sap and E. Mohebi, 2008a. Hybrid Self Organizing Map for Overlapping Custers. In
Springer-Verlage Proceedings of the CCIS. Hainan Island, China, 2009. Accepted.
M.N.M Sap and E. Mohebi, 2008b. Rough set Based Clustering of the Self Organizing Map.
In IEEE Computer Scociety Proceeding of the 1st Aseian Conference on Intelligent
Information and Database Systems. Dong Hoi, Vietnam, 2008. Accepted
M.N.M Sap and E. Mohebi, 2008c. A Novel Clustering of the SOM using Rough set. In IEEE
Proceeding of the 6th Student Conference on Research and Development. Johor,
Malaysia 2008. Accepted
M.N.M. Sap and E. Mohebi, 200Sd. Outlier Detection Methodologies: A Review. Journal of
Information Technology, UTM, Vol. 20, Issue 1,2008. pp. 87-105.
Munakata, T., 2008. Fundamentals of the New Artificila Intelligence. Springer-Verlage.
N.R., Pal, J.C., Bezdek, and E.C.K. Tsao, 1993. Generalized clustering networks and
Kohonen's self-organizing scheme. IEEE Trans. Neural Networks (4). pp.549-557.
Pawlak, Z., 1982. Rough sets. Intemat. 1. Computer Inf. Sci. (II) pp.341-356.
R.M., Gray, 1984. Vector quantization. In IEEE Acoust. Speech, Signal Process. Mag. I (2).
pp.4-29.
S. Asharaf, M. Narasimha Murty, and S.K. Shevade, 20006. Rough set based incremental
clustering of interval data. Pattern Recognition Letters, Vol. 27, pp. 515·519.
S.C. Sharma and A. VI
traffic counters.'
StahL, H., 1986. Clusn
W. Gaul and M.
430.
T. Kohonen, 1982. Sel Cybem. 43. pp. 5 :T. Kohonen, 1997. Self
!lJC Irvine Machir
http://archive.ics.
:_811
and Yaoguang, 20 kernel function. IS.C. Sharma and A. Werner, 1981. Improved method of grouping provincewide permanent traffic counters. Transaction Research Report 815, Washington D.C. pp.13-18.
Stahl., H., 1986. Cluster analysis of large data sets. In Classification as a Tool of Research. W. Gaul and M. Schader, Eds. Elsevier North-Holland, Inc., New York, NY pp. 423 430.
T. Kohonen, 1982. Self-Organized formation of topologically correct feature maps. In BioI. Cybern. 43. pp. 59-69.
T. Kohonen, 1997. Self-Organizing Maps. Springer, Berlin, Germany.
UC Irvine Machine Learning Repository Database. 1987. Available at: http://archive.ics.ucLedu [Accessed 12 April 2008]
Yan and Yaoguang, 2005. Research and application of SOM neural network which based on kernel function. Proceeding ofICNN&B '05 (I). pp. 509-511.