Heart Rate Variability Characterization Using a Time-Frequency Based
Instantaneous
Frequency Estimation Technique
MB Malarvili
1, L. Rankine
1,M. Mesbah
1, P. B. Colditz
1, and B. Boashash
1, 21 Perinatal Research Centre, University of Queensland, Herston, Australia 2 University of Sharjah, UAE
Abstract—In this paper, a new method for
characterizing the newborn heart rate variability (HRV) is proposed. The central of the method is the newly proposed technique for instantaneous frequency (IF) estimation specifically designed for nonstationary multicomponent signals such as HRV. The new method attempts to characterize the newborn HRV using features extracted from the time–frequency (TF) domain of the signal. These features comprise the IF, the instantaneous bandwidth (IB) and instantaneous energy (IE) of the different TF components of the HRV. Applied to the HRV of both normal and seizure-suffering newborns, this method clearly reveals the locations of the spectral peaks and their time-varying nature. The total energy of HRV components, ET and ratio of energy concentrated in the low-frequency (LF) to that in high-frequency (HF) components have been shown to be significant features in identifying the HRV of newborn with seizures.
Keywords— Heart rate variability, time-frequency distribution, component linking, instantaneous frequency.
I.
I
NTRODUCTIONAnalysis of HRV has become a major non-invasive tool for assessing the disturbance in autonomic nervous system (ANS) regulation. The ANS has two branches; the sympathetic and parasympathetic. The separate rhythmic contributions from sympathetic and parasympathetic activities modulate the heart rate, and thus the RR intervals in the ECG, at distinct frequencies. In newborns, sympathetic and parasympathetic activities manifest themselves in the low frequency (LF) and the high frequency (HF) components of the HRV respectively. The mid frequency (MF) component is known to be both parasympathetically and sympathetically mediated [1].
The components of HRV, traditionally estimated using spectral analysis techniques [2], commonly exhibit 3 prominent peaks located in the LF, MF and HF bands of the spectrum. This spectrum is usually obtained from
a short term recordings of newborn HRV. The locations of these frequency bands vary depending on the researchers. Currently, the most commonly recommended ones for newborns are [0.01 – 0.05] Hz for LF, [0.05 – 0.2] Hz for MF, and [0.2 – 1] Hz for HF [1]. Since the traditional spectral analysis methods depend on the assumption of stationarity, they can only provide averaged information about the signal frequency content. Information related the time evolution of the spectral components is obscured. HRV, as most biological signals, is a non-stationary signal. This means that the location of the spectral peaks (frequency) and the spread of these peaks (bandwidth) may vary with time. To overcome the limitations of the stationary techniques, non-stationary methods such as time-frequency distribution (TFD) are required [3].
The TFD of a signal represents its energy density in the joint time-frequency domain where the most valuable information is encoded in the IF of the different TF components. These IFs not only show the TF regions where the signal energy is concentrated but also how these regions are changing with time. TF-based techniques have been used in [4, 5, 6] to estimate the instantaneous parameters of HRV in the process of identifying cardiac abnormalities.
However, the existing methods require a priori selection of
the frequency bands of interest in order to decompose the HRV into band-limited monocomponent signals. This requirement is dictated by the fact that a single IF is only meaningful for monocomponent signals. These are the signals with only one time-varying continuous spectral
concentration [7]. In the case of HRV, which is
multicomponent [8], the signal’s energy is locally
distributed at and around two or more frequency peaks. A
priori selection of the frequency bands is subjective and usually inaccurate since these bands are patient-dependent and can be strongly affected by the ANS state (healthy vs. diseased), age and physiologic conditions (body position, breathing frequency, etc) [9].
frequency bands of interest and their locations. This characteristic makes it very suitable for the analysis of HRV. In this paper, we propose using this new approach to accurately extract the components of HRV. Applied to the HRV of normal newborns and newborns with seizure, this technique clearly reveals the locations of the time-varying spectral peaks. The extracted HRV components are further characterized by their IE and IB. The purpose of this HRV characterization is to determine the parameters capable of distinguishing normal newborns from those having seizure. Qualitative changes in ANS during neonatal seizure have been reported in the literature [11, 13]. The goal of this paper is to try to quantify the HRV changes during seizure to be used as features in our planned automated newborn seizure detection.
II.
M
ETHODSA. IF Estimation Technique based on TFD
The process of extracting the IFs from the HRV is composed of the following stages:
Preprocessing: The smoothed nonlinear energy operator (SNEO) is used to localize and extract the R points (the maximum point of thr R wave) from the newborn ECG [8]. The RR interval time series is obtained as the time difference between consecutive R points. The RR interval series is transformed into an evenly sampled signal using Berger's algorithm [12] and then resampled at 2 Hz. It was shown that this technique outperforms other existing techniques in terms of the reduction of energy of harmonics and artifacts [12]. The inverse of the equidistantly sampled RR time series is called the instantaneous heart rate (IHR). The IHR is taken as a measure of the heart rate variability in our present study.
TF Mapping:There are a large number of TFDs that can be used to map a signal from the time domain to the time-frequency domain. The choice of a suitable TFD depends on both the characteristic of the signal under analysis and on the application [3]. In this study we restrict ourselves to the class of quadratic TFDs represented by the following general expression [3]:
(
ν τ)
ν τ τ τ ν τν π ρ
dud d u z u z g f u t j e
f t z
) 2 ( * ) 2 ( ) , ( 2
) , (
− +
∫∫∫ − −
=
(1)
where z(t)is the analytic associate of the real signal s(t)
[3]. The functiong(ν,τ)defined in Doppler-lag(ν,τ)
domain is known as the TFD kernel and determines the characteristics of the TFD.
In a previous study [8], a number of TFDs was used to represent the HRV signals. It was found that modified-B distribution (MBD) realizes the best compromise in terms of cross-term reduction and TF resolution and as a consequence has been used in our analysis. The kernel for MBD is given by
) ( )
( 2 2
β πν
β+ Γ
Γ j (2)
where (.)Γ stands for the gamma function andβ is a real,
positive number that controls the trade off between components’ resolution and cross-terms suppression [3].
The optimal value ofβ was found to be around 0.01.
TFD Local Peaks Extraction: At this stage, the TFD is treated as a 2D image whose local maxima (peaks) are extracted using the first and second order partial derivatives,
with respect to frequency. A binary image,B(t,f), is then
obtained by assigning the value one to the (t,f) locations
which represent a maxima as well as meet the threshold criterion around ρz(t,f)>δ=0.1×max(ρz(t,f)). All other (t,f) locations are assigned the value zero.
Component Linking:A linked component inB(t,f)is a
continuous function f(t) of local maxima. In other words, a
linked component is an approximation of the IF of a local TF component. The linked component is detected using connectivity analysis and thresholding. The connectivity analysis checks the relationship between each pixel
ofB(t,f) and its neighbors in order to decide whether the
pixels belong to the same IF. The size of neighboring set to be used for this purpose is carefully chosen to avoid the issue of false component linking [10]. A 12-connected neighboring set is used in this paper. A threshold is used to only account for linked components (or IFs) whose durations are larger than a predefined value. In this paper, this value is chosen as the minimum time duration of the IF,
α
. We found thatα
= 30s was optimal for our database.B. Application
The proposed method is tested on HRV obtained from the ECG recordings of newborns admitted to the Royal Brisbane and Women Hospital, Brisbane, Australia. The one channel newborn ECG was recorded simultaneously along with 20 channels of Electoencephalogram (EEG). The EEG seizure were identified and annotated by a neurologist. In the present study, we analyzed 39 seizure and 12 non-seizure epochs of 64 seconds each from 8 newborns. The ECG was sampled at 256 Hz.
(left plots), the joint TFDs (centre plots), and the spectra (bottom plots) of the HRV related to non-seizure and seizure newborns respectively. It is clear from these plots that that the TF representation is much more infromative then the time or frequency domain plots. Figures 1(b) and 2(b) show the three extracted IFs from the TFDs
along with their means and ranges. The number and
locations of IFs obtained using the prposed method give a more accurate characterization of the different HRV components than that provided by the spectrum. The different frequency bands (LF, MF and HF) are clearly separated and their time-varying nature clearly exhibited. From these figures, it is evident that the HRV related to seizure has higher energy in LF compared to non-seizure while it is significantly lower in HF. This indicates that the newborn seizure manifest itself in both the LF (sympathetic activity) and the HF (parasympathetic activity) of the HRV. Furthermore, we have found that 61.54% of seizure epochs have 3 distinct components and 38.46% of them have only 2 components. However, 100% of the non-seizure epochs have one distinct component at each frequency band. Figure 3(a) and (b) show an example of the HRV related to seizure which has 2 components.
-1 0 1 me signal 0 200 PS D
0.1 0.2 0.3 0.4 0.5 0.6 0.7 0.8 0.9 10 20 30 40 50 60 Frequency (Hz) Ti m e ( s)
0 0.05 0.1 0.15 0.2 0.25 0.3 0.35 0.4 0.45
5 10 15 20 25 30 35 40 45 50 55 Frequency (Hz) Ti m e ( s)
MF: 0.12 - 0.13 Hz Mean: 0.125 Hz LF: 0.039 - 0.55Hz
Mean:0.048 Hz
HF:0.43 - 0.44Hz Mean:0.43 Hz
Fig 1: (a) TFD of HRV related to non-seizure, (b) Extracted IFs with its means and frequency ranges.
-1.5 -0.5 1 Time signal 200 800 PS D
0.1 0.2 0.3 0.4 0.5 0.6 0.7 0.8 0.9 1 10 20 30 40 50 60 Frequency (Hz) Ti m e ( s)
0 0.1 0.2 0.3 0.4 0.5 0.6 0.7 5 10 15 20 25 30 35 40 45 50 55 Frequency (Hz) Ti m e ( s)
LF:0.016 - 0.03 Hz Mean: 0.02 Hz
MF:0.12 - 0.15 Hz Mean:0.13 Hz
HF: 0.56 Hz
Fig 2: (a) TFD of HRV related to seizure, (b) Extracted IFs with its means and frequency ranges.
-10 0 10 Time signal
2 10x 10
4
PS
D
0.1 0.2 0.3 0.4 0.5 0.6 0.7 0.8 0.9 1 10 20 30 40 50 60 Frequency (Hz) Ti m e ( s)
0.02 0.03 0.04 0.05 0.06 0.07 0.08 0.09 0.1 0.11 10 15 20 25 30 35 40 45 50 55 60 Frequency (Hz) Ti m e( s)
HF:0.086 - 0.11 Hz Mean: 0.09 Hz LF:0.023-0.039 Hz
Mean:0.033 Hz
Fig 3: (a) TFD of HRV related to seizure, (b) Extracted 2 IFs with its means and frequency ranges.
The energy in LF is significantly high. Absence of the HF component has two possible interpretations. It may indicate that the respiration rate for the newborn with seizure tends to shift to a lower rate causing reasonably high energy magnitude in MF. This is supported by the facts that
a
b
a
b b
the HF is attributed to the respiration rate and the MF is both parasympathetically and sympathetically mediated. Decreased respiration rate is a well-documented symptom of newborn during seizures [11]. The second interpretation is the presence of apnea. Apnea during neonatal seizures has been reported in [13]. The reduction in complexity of HRV as illustrated by the reduction in the number of TF components and their shorter time durations observed during seizure is supported by results in [14] which reported that the complexity of HRV is reduced in infants with brain injuries compared to the healthy ones.
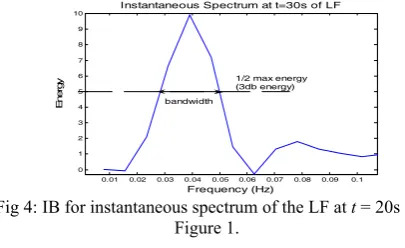
C. Estimation of the Instantaneous TF Parameters.
The characteristics of each HRV components are further studied by means of IE and IB. The IE is measured as the instantaneous amplitude of a component, extracted from the TFD. The spread of each HRV component is measured by means of the IB or the standard deviation from IF. Here, the IB refers to bandwidth of instantaneous spectrum at every time instants when the energy of the respective component drops by half (the 3 dB energy). Figure 4 shows IB for
an instantaneous spectrum at t = 30s for the LF
component in Figure 1.
For each HRV component, we explore the mean IF, mean IB, mean ET and the mean ratio of IE concentrated in the LF to HF peaks (LF/HF) during non-seizure and seizure. All the features were normalized for easy comparison.
0.01 0.02 0.03 0.04 0.05 0.06 0.07 0.08 0.09 0.1 0
1 2 3 4 5 6 7 8 9 10
Frequency (Hz)
E
ner
gy
Instantaneous Spectrum at t=30s of LF
bandwidth
1/2 max energy (3db energy)
Fig 4: IB for instantaneous spectrum of the LF at t = 20s in Figure 1.
III.
R
ESULTS AND DISCUSSIONA receiver operating characteristics (ROC) is used to acquire appropriate sensitivity (Sn), specificity (Sp), statistical significance (p-value), the area under the ROC curve (AUC) and the 95% confidence interval (CI) of AUC for all the parameters mentioned to identify the best features that can be used to distinguish the seizures from the non-seizure newborns. The results are shown in
Table 1. A p-value < 0.05 is considered statistically
significant. If the lower limit of the CI for the AUC is >0.5, the feature tested is considered to have discriminatory potential. ROC is also used to determine the best cut-off value to differentiate the non-seizure and seizure.
From the table, we can see that mean IF and IB for LF and HF could not reliably discriminate between newborn with and without seizure. For this analysis only 24 epochs of seizure related HRV were used (61.54% of which had 3 HRV components). The table shows that there is no considerable difference in the location of the spectral peak in LF and HF for newborn with seizure and non-seizure. The remaining 38.46% of seizure related HRV epochs had only 2 components which is a significant feature to differentiate the seizure and non-seizure newborns. Thus, mean IF and IB were not found in our study to be efficient features for the classification of seizure and non-seizure.
The HRV related to seizures can best be discriminated from the ones related to non-seizure using the mean ET (92.31% of Sn and 91.67% of Sp) and mean of LF/HF ratio (94.87% of Sn and 91.67% of Sp). The optimal threshold was found to be 0.05257 and 0.3028 respectively. These result show that the newborn seizure corresponds to a greater total energy concentration in HRV compared to the non-seizure ones. The LF/HF ratio tends to increase in HRV related to seizure and decreases in the non-seizure ones. This is due to the decreased IE in the HF and significantly increased IE in the LF for the case of seizure.
IV.
C
ONCLUSIONSAccurate components of HRV were extracted using a recently developed TF-based multicomponent IF estimation technique. The components are clearly separated and their time-varying nature clearly exhibited. We also explored the discriminating capability of IF, IB, ET and LF/HF ratio. The results obtained so far showed that ET and LF/HF ratio are potentially good features to discriminate between seizure and non-seizure. Incorporating these features in one of our previously developed EEG-based newborn seizure detector is expected to enhance its overall robustness.
Table 1 Analysis of TF Parameters using ROC
Features Sn (%) Sp
(%)
AUC(CI) p
MeanIF(LF) 84.62 33.33 0.5556(0.3653-0.7458) <0.5637
MeanIF(HF) 41.03 83.33 0.5876(0.4047- 0.7706) <0.3626
MeanIB(LF) 56.41 58.33 0.5470(0.3557- 0.7383) <0.6252
MeanIB(HF) 71.76 50.00 0.6389(0.4763- 0.8015 <0.1490
R
EFERENCES1. E. Longin, T. Schaible, T. Lenz, S. Konig, (2005). “Short term heart rate variability in healthy neonates: normative data and physiological observations”, Early Human Development, 81, pp.663-71.
2. Task Force of the Euro. Soc. of Cardiol., the North Amer. Soc. of Pacing and Electrophysiol., (1996).“Heart rate variability: standards of measurement, physiological interpretation and clinical use'',
Circulation, 93, pp. 1043-65.
3. B. Boashash, (2003) Time-Frequency Signal Analysis and Processing: A Comprehensive Reference, Elsevier, Oxford. 4. J. Villa, F. Palacios, J. Presedo, M. Fernandez-Deigado, P. Felix, S.
Barro. (1997): “Time-frequency analysis of heart-rate variability: an improved method for monitoring and diagnosing myocardial ischemia”, IEEE Eng. in Med. and Biol., pp.119-126.
5. H. G van Steenis, W. L. J. Matens, J. H. M. Tulen. (2002). “Time-frequency parameters of heart rate variability: using instantaneous amplitude and frequency to unravel the dynamics of cardiovascular control process”, IEEE Eng. in Med. and Biol., pp.46-58.
6. A. Monti, C. Medigue, L. Mangin. (2002): “Instantaneous parameter estimation in cardiovascular time series by harmonic and time-frequency analysis”, IEEE Trans. on Biomed. Eng., 49, pp. 1547-1556.
7. B. Boashash. (1992): “Estimating and interpreting the instantaneous frequency of a signal - Part 1 & 2”, Proc. of the IEEE, 80, pp. 520-568.
8. MB Malarvili, M. Mesbah, B. Boashash (2006).“Time-frequency analysis of heart rate variability for neonatal seizure detection”, Phys. Eng. Sci. Med, pp. 67-72.
9. Y.Goren, L. R. Davrath, I. Pinhas, E. Toledo, S. Akselrod. (2006).“Individual time-dependent spectral boundaries for improved accuracy in time-frequency analysis of heart rate variability”, IEEE Trans. on Biomed. Eng., 53, pp. 35-42.
10. L. Rankine, M. Mesbah, B. Boashash. (2006): “IF estimation for multicomponent signals using image processing techniques in the time-frequency domain”, submitted to Signal Processing.
11. J. M. Rennie. (1997). “Neonatal seizures”, Eur J Pediatr 156, pp: 83–87. 12. H. N. Guimaraes, R. A. S. Santos. (1998):“A comparative analysis of preprocessing techniques of cardiac event series for the study of heart rhythm variability using simulated signals”, Brazilian Journal of Medical and Biological Research, 31, pp. 421-430.
13. S. L. Helmers, M. J. Weiss, G. L. Holmes, (1991).“Apneic seizures with Bradycardia in a newborn”, J. Epilepsy, 44,pp.173-180.
14. G Sugihara, W Allan, D Sobel, K D Allan. (1996). “Nonlinear control of heart rate variability in human infants”, Proc Natl Acad Sci U S A., 93, pp: 2608–2613.
Address of the corresponding author:
Author: MB Malarvili
Institute: Perinatal Research Centre, University of Queensland City: Herston
Country: Australia