SLIVKA, RACHEL MARIE. Clostridium autoethanogenum Fermentation Using Sugar and Gaseous Carbon Substrates. (Under the direction of Dr. Mari S. Chinn).
Clostridium autoethanogenum is an anaerobic acetogen that is capable of metabolizing both energy-rich xylose and the single carbon gases (CO and CO2+H2) found in synthesis gas
(syngas). These features are desirable because they enhance the amount of carbon in
lignocellulosic biomass that can be converted through hydrolysis, gasification, and fermentation
technology to value-added products such as bio-fuels and bio-chemicals. While C.
autoethanogenum may be among the limited number of microorganisms that can naturally metabolize xylose, its innate ability to utilize the substrate is hindered without optimization of
the fermentation conditions. Assessment of the factors which impacted xylose metabolism
ranged from initial xylose concentration to nutrient limitation to pH optimization studies. Once
it was discovered that C. autoethanogenum preferred a growth-optimized pH (~5.8) for sugar metabolism, the bacteria was able to fully consume all fed xylose (up to 30 g/L) and yield an
ideal ethanol to acetate ratio of 1:3 (mass-basis). Unlike other acetogens, C. autoethanogenum is a pH sensitive organism which co-produces both acetate and ethanol during growth rather than
having a distinct growth-associated acetogenic phase followed by non-growth-associated
solventogensis. Ethanol formation serves to prevent acidification of the culture by sequestering
excess reductant in an electron sink. C. autoethanogenum uses the Wood-Ljungdahl pathway to metabolize CO and CO2+H2; however, due to the high reductant demand of the pathway, the
bioenergetics provided by syngas as the sole substrate is limited. Preadaptation studies were
conducted to determine if inoculum adapted to xylose, syngas, or a sugar-gas mixture would
provide an energy boost to the bioenergetics of fermentation systems containing syngas as a sole
could metabolize syngas in an effective and timely manner. Cultures which had stagnant
preadaptation to syngas experienced long lags in cell growth, while cultures that used reactor
agitation during preadaptation to syngas demonstrated ideal growth profiles. Since the gases
present in syngas are sparingly soluble, enhanced mass transfer by means of reactor agitation
was required to increase the concentrations of CO, CO2, and H2 in the liquid phase so that the
cells were able to uptake the gaseous substrate. Based on physiology differences observed
between C. autoethanogenum cultures grown on xylose, syngas, or a mixture of xylose-syngas, a proteomic analysis was used to illustrate how protein expression changes under each substrate
condition. The main pathways which showed changes in protein regulation as a result of the
carbon source available included those related to sugar transport, carbon fixation, and energy
metabolism. Although future optimization work remains, this study has advanced our overall
© Copyright 2018 by Rachel Marie Slivka
by
Rachel Marie Slivka
A dissertation submitted to the Graduate Faculty of North Carolina State University
in partial fulfillment of the requirements for the degree of
Doctor of Philosophy
Biological and Agricultural Engineering
Raleigh, North Carolina 2018
APPROVED BY:
_______________________________ _______________________________
Dr. Mari Chinn Dr. Amy Grunden Committee Chair
_______________________________ _______________________________
DEDICATION
This dissertation is dedicated to my three dogs:
To the memory of Betsy, I asked God to let you stay with me through graduate school and bless your heart you did. You will always be my little dog.
To Electra, my little red ball of fun.
BIOGRAPHY
Who am I? I am the granddaughter of a Polish immigrant who used every ounce of
gumption she had to raise my father and to give him a better life than she had as a child. I am the
great-granddaughter of an Irish milkman from Northeast Ohio. I am a proud descendant of a
young couple by the name of Slivka who left their homeland in Slovakia and started a family in
America in 1908. I am the sister of a veterinarian who lets me think that I am the “smart” one. I
am the daughter of two incredibly gifted, intelligent parents – one is a mechanical engineer and
the other is a Special Education teacher.
Hello, I am Rachel. I was born in Northeast Ohio, but moved to Danville, VA with my
family when I was nine-years-old. Thank goodness because the weather in the South is
considerably more pleasant. After spending my school days as “the girl who always ruined the
curve”, I decided to attend Virginia Tech and pursued a BS in Chemical Engineering. When I
wasn’t studying during undergrad, I loved to hike the trails in the area surrounding Blacksburg,
VA. My younger sister followed me to Virginia Tech, so I also spent many free hours with her
in the land of Hokies. After undergrad, I moved to West Virginia for a brief period to work as a
Process Engineer in the polymer industry. Although I enjoyed the hiking there, the job just
wasn’t for me and I decided to return to academia for a PhD. During graduate school at NC
State, I majored in Biological and Agricultural Engineering and found my calling doing
fermentation research. I love to bake so the ability to mix ingredients together in a lab was fun
for me. While living in Raleigh, NC during graduate school, I took up the new hobbies of
Zumba and salsa dancing. I also continued my existing hobbies of “making stuff” which
included knitting my first afghan and sewing Halloween costumes for several of the dogs in my
ACKNOWLEDGMENTS
I wish acknowledge first and foremost my parents, John and Laura Slivka, who raised me
to be the person I am today. Without your love and guidance, I would not have had the courage
and perseverance to accomplish as much as I have thus far in life. And thank you so very much
for supporting me when I decided to get a PhD! Appreciation also goes to my sister, Reba, who
is my best friend and has supported me in my endeavors just as much as I have supported her in
her own. You are my cheerleader for life!
A big thank you goes to Dr. Mari Chinn who is absolutely the best research advisor. You
have been a fantastic role model and mentor and, on the days when I needed it, you treated me
like a true friend.
Last of all, I want to acknowledge my research family: Joscelin Diaz, Matt Whitfield, Ed
Godfrey, and Ana Zuleta Correa. We have laughed together, vented about crazy things together,
and gone on many a road trip to the field or conferences together. Without your help, graduate
TABLE OF CONTENTS
LIST OF TABLES ... vi
LIST OF FIGURES ... vii
Chapter 1: Gasification and Synthesis Gas Fermentation: An Alternative Route to Biofuel Production ... 1
Summary ... 2
Introduction ... 2
Gasification ... 5
Microorganisms that can convert synthesis gas components to biofuels ... 8
Mechanisms of microbial synthesis gas utilization ... 9
Synthesis gas fermentation ... 12
Future perspective ... 20
References ... 32
Chapter 2: Influence of Carbon Source Preadaptation on Clostridium autoethanogenum... 39
Abstract ... 40
Introduction ... 41
Materials and Methods ... 43
Results and Discussion ... 48
Conclusion ... 62
References ... 69
Chapter 3: Influence of pH Adjustment on Clostridium autoethanogenum Xylose Consumption ... 72
Abstract ... 73
Introduction ... 74
Materials and Methods ... 78
Results and Discussion ... 86
Conclusion ... 105
References ... 113
Chapter 4: Xylose Utilization in the Presence of Synthesis Gas (Syngas): A Proteomic Evaluation of Substrate Transport and Carbon Utilization by Clostridium autoethanogenum... 117
Abstract ... 118
Introduction ... 118
Materials and Methods ... 121
Results and Discussion ... 128
Conclusion ... 144
References ... 162
Appendices ... 166
Appendix A: Stability of the cell membrane. ... 167
Appendix B: A scaled lesson with pH. ... 170
LIST OF TABLES
Table 1.1 Gasifier configurations ... 25
Table 1.2 Composition of synthesis gas from biomass gasification ... 27
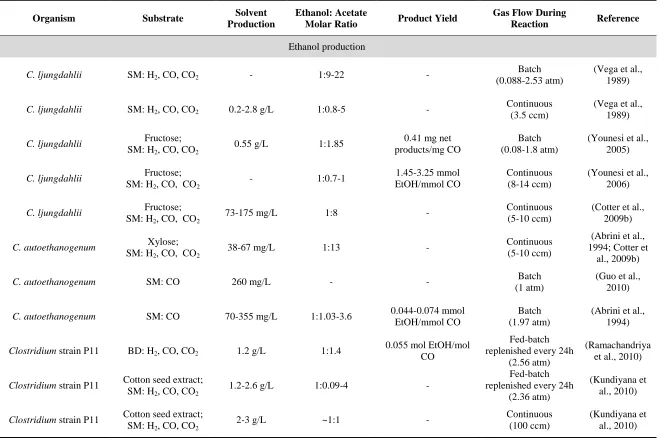
Table 1.3 Reported product profiles for microbial species that metabolize syngas to
solvents ... 28
Table 3.1 Volume losses due to sampling and gains due to base, xylose, and replacement media addition for the first 32 hours for C. autoethanogenum cultures ... 107 Table 3.2 C. autoethanogenum product yields from xylose at initial xylose concentrations
ranging from 5-30 g/L when cultures were pH adjusted to 5.8 via 3M KOH
every 8 hours ... 111
Table 4.1 Key membrane transport proteins differentially expressed by C.
autoethanogenum during xylose (XYL), xylose-syngas (MIX), or syngas
(SYN) carbon source treatments ... 150
Table 4.2 Key cytoplasmic carbon metabolism proteins differentially expressed by C. autoethanogenum during xylose (XYL), xylose-syngas (MIX), or syngas
(SYN) carbon source treatments. ... 151
Table 4.3 Key energy metabolism proteins differentially expressed by C.
autoethanogenum during xylose (XYL), xylose-syngas (MIX), or syngas
(SYN) carbon source treatments ... 158
Table 4.4 Additional cytoplasmic proteins with notably high fold differences expressed by C. autoethanogenum during xylose (XYL), xylose-syngas (MIX), or syngas (SYN) carbon source treatments ... 161
Table A.1 Evaluation of factors impacting the C. autoethanogenum cell membrane ... 168 Table B.1 Summary of culture performance in larger reactors ... 173
Table C.1 Cytoplasmic heme, nucleotide/nucleoside, and amino acid biosynthesis
proteins differentially expressed by C. autoethanogenum during xylose (XYL), xylose-syngas (MIX), or syngas (SYN) carbon source treatments ... 175
Table C.2 Remaining proteins from the experimental data (not included in other tables) with significant expression by C. autoethanogenum during xylose (XYL),
LIST OF FIGURES
Figure 1.1 Ethanol production process from lignocellulosic biomass ... 24
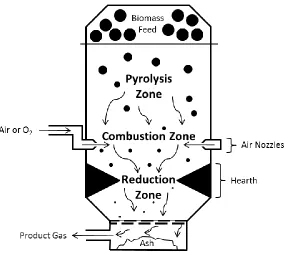
Figure 1.2 Gasification zones in a downdraft gasifier ... 24
Figure 1.3 Gasification reactor types ... 26
Figure 1.4 Wood-Ljungdahl pathway ... 30
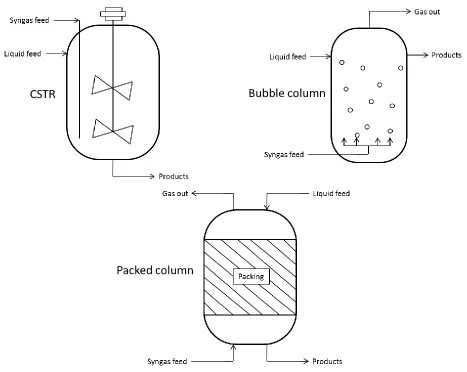
Figure 1.5 Continuous flow bioreactors ... 31
Figure 2.1 Schematic of factors, treatment combinations, and replication for carbon source preadaptation experiments. ... 64
Figure 2.2 C. autoethanogenum performance in xylose-syngas (mixed) fermentations and a xylose only fermentation using different preadaptation sources. ... 65
Figure 2.3 C. autoethanogenum syngas fermentations compared to a xylose only fermentation. ... 66
Figure 2.4 Headspace composition during C. autoethanogenum xylose-syngas (mixed) fermentations. ... 67
Figure 2.5 Headspace composition during C. autoethanogenum syngas fermentations. ... 68
Figure 3.1 Impact of initial xylose concentration on C. autoethanogenum performance ... 108
Figure 3.2 Impact of altered trace elements, vitamin solution, and initial xylose concentration on C. autoethanogenum performance ... 109
Figure 3.3 Effect of potassium phosphate buffer and pH adjustment via 3M KOH on C. autoethanogenum cultures dosed incrementally by 2.5 g/L up to hour 96 and then by 5 g/L to the equivalent of 20 g/L initial xylose ... 110
Figure 3.4 C. autoethanogenum performance at initial xylose concentrations ranging from 5-30 g/L when cultures were pH adjusted to 5.8 via 3M KOH every 8 hours ... 112
Figure 4.1 Performance of C. autoethanogenum fermentations with xylose only, xylose- syngas, and syngas only as the carbon source. ... 146
Figure 4.3 Number of significant proteins in either the A) cell membrane or B) cytoplasmic fraction that showed higher expression in the xylose, xylose-syngas (mixed), or syngas carbon source treatment of C. autoethanogenum ... 148 Figure 4.4 Xylose transport via a monosaccharide-transporting ATPase (CAETHG_4000) .. 149
Figure 4.5 A) Xylose conversion before entry into the pentose phosphate pathway. B) Transcription of a sugar transporter (CAETHG_3935) with genes for xylose
conversion (CAETHG_3932 and CAETHG_3933) ... 149
Figure 4.6 Glycolysis pathway from glucose-6-phosphate to pyruvate in
C. autoethanogenum ... 154 Figure 4.7 Interconversion between CO and CO2, and production of H2 in
C. autoethanogenum ... 155 Figure 4.8 Acetate and ethanol fermentation pathway in C. autoethanogenum ... 156 Figure 4.9 Energy metabolism in C. autoethanogenum: A) NAD biosynthesis and salvage,
B) Reaction of NADPH dehydrogenase, C) Reaction of NADPH-dependent
FMN reductase ... 157
Figure 4.10 Energy metabolism in C. autoethanogenum: Flavin biosynthesis ... 159 Figure 4.11 Energy metabolism in C. autoethanogenum: A) Transcription unit for electron
transport complex, RnfABCDGE type, B, C, D) Transcription units for electron transfer flavoproteins. ... 160
Figure B.1 Variable C. autoethanogenum growth in a 1.5 L fermenter with 10 g/L initial xylose and pH controlled at 5 via 3M KOH. ... 174
Figure B.2 Difference in C. autoethanogenum growth between A) batch and B) continuous (10 mL/min) headspace N2 in a 250 mL modified spinner flask dosed
incrementally by 2.5 g/L to the equivalent of 10 g/L or 20 g/L initial xylose
CHAPTER 1
Gasification and Synthesis Gas Fermentation: An Alternative Route to Biofuel Production
Literature Review
Rachel M. Slivka, Mari S. Chinn, Amy M. Grunden
Summary
Lignocellulosic biomass has been identified among the renewable energy sources to have
the highest potential to minimize dependency on dwindling supplies of fossil fuels. Conversion
of this biomass to biofuels by microorganisms through direct hydrolysis and fermentation can be
challenging. Alternatively, biomass can be converted to synthesis gas (a mixture of CO, CO2,
N2, and H2) through gasification and transformed to fuels using microbial catalysts that can
convert the CO, H2 and CO2 to fuels such as ethanol, butanol and hydrogen. Biomass
gasification-fermentation processing systems have shown promise and companies are now
entering the marketplace for commercial-scale ethanol production from synthesis gas. Isolation
of new organisms capable of higher product yield, as well as functional implementation of
bioreactors that enhance gas solubility for microbial fermentation, make this technology an
attractive option for reducing our dependency on fossil fuels.
Introduction
The world around us is dependent on energy from the cars we drive to the electricity we
use to light our homes. However, the natural resources (petroleum, coal, natural gas, etc.) we
currently use to supply this energy are limited, and as such, there has been an emphasis placed on
development of renewable fuel production systems. The concept of using biomass to produce
biofuels began gaining widespread attention in the 1970’s (Stephanopoulos, 2007) and since then
a variety of concerns from greenhouse gas emissions to volatility in the oil market have made the
development of biofuels technology a necessity. While the current production and use of
biofuels has gradually advanced, it still needs to grow considerably to have an impact on our
energy crisis. For example, the United States produced 30 mega-tons of liquid biofuels in 2008,
International Energy Agency, 2010b). On the global level, renewable energy (biofuels, wind,
solar, etc.) currently only provides 15% of the total energy supply (Lund, 2007).
Gasification-fermentation is the thermochemical and biological conversion of a biomass
substrate to end products such as ethanol, butanol, hydrogen, methane, and acetate. It involves
the partial or incomplete combustion of hydrocarbons to yield CO, CO2, H2, H2O, CH4 and
impurities (ash, tar, and minor species) (Bridgwater, 1995; McKendry, 2002). After gasification
has occurred, the synthesis gas (syngas) is converted to acids and alcohols by select
microorganisms during the fermentation process. There are three primary steps required to
make biofuels from biomass-derived gas: gasification of the raw feedstock, purification of the
resultant syngas, and use of the syngas in either a biological or chemical process to yield the end
products (Demirbas, 2007). Biomass resources that are used in the gasification process range
from agricultural residues, forestry residues, and dedicated energy crops to domestic waste.
Prime examples include wood, corn stover, cotton stalks, nut shells, bagasse, and grasses (Huber
et al., 2006; Sun and Cheng, 2002). The use of these non-food feedstocks and lignocellulosic
biomass is a major advantage of using gasification and fermentation to produce ethanol, butanol,
hydrogen, and other biofuels (Wei et al., 2009).
As opposed to other methods of preparing raw lignocellulosic biomass for the
fermentation process, for example steam explosion, ozonolysis, enzymatic hydrolysis and
acid/base treatment to unlock the sugar units, the gasification method requires no gross
pre-treatment step other than mechanical break-down of the substrate into small chips (Figure 1.1)
(Hayes, 2009; Wei et al., 2009). Steam explosion, ozonolysis, enzymatic hydrolysis and
acid/base treatment are often energy intensive and require numerous chemicals and catalysts for
cuts down the amount of energy, time, and money required to prepare the biomass for processing
(Sun and Cheng, 2002; Wei et al., 2009). Plus, in the process of separating out the cellulose
fraction from hemicellulose and lignin, a large percentage of the initial carbon content may be
lost as “waste” because it cannot be fully extracted from the bulk biomass (hemicellulose and
lignin are interwoven within the crystalline structure of cellulose which makes it hard to break
the chemical bonds), the enzymes responsible for saccharification are inhibited by high sugar
concentrations and pretreatment byproducts (Lin and Tanaka, 2006) and product loss is often
experienced in handling of processed material. Gasification, on the other hand, allows for more
efficient capture of the biomass feedstock as there are no issues with separation of the cellulose
fraction from hemicellulose and lignin because process temperatures are sufficiently high enough
to break the chemical bonds. For most lignocellulosic biomass, the lignin content alone
represents 25-30% of the total mass and 35-45% of the stored chemical energy (Hickey et al.,
2010).
Fermentation of a gaseous substrate can improve conversion of the biomass feedstock as
there is not a requirement for using microbial systems that metabolize both hexose and pentose
sugars. A major drawback of traditional fermentation methods is the fact that many of the
microorganisms used (ex. Saccharomyces cerevisiae; Zymomonas mobilis) cannot naturally metabolize xylose and other pentose sugars (Jeffries and Jin, 2004). Finally, the use of a gaseous
substrate as opposed to dissolved sugars during fermentation permits the decoupling of hydraulic
retention time from the amount of available substrate (Henstra et al., 2007). Compared to
hydrolysis-fermentation, gasification-fermentation is a more efficient process because it yields at
minimum 75% conversion of reactants to products in the gasification stage and over 90%
gasification-fermentation yields almost 60% more ethanol from a unit mass of hardwood than the
hydrolysis-fermentation process outputs (Wei et al., 2009). However, with any given process
there are technological challenges that need to be addressed. These challenges are discussed
further throughout the review.
Gasification
Three transformation and temperature regimes are observed during gasification. In the
primary regime, biomass is converted to gaseous H2O, CO2, and oxygenated vapors and liquids.
Throughout the secondary regime, the oxygenated vapors and liquids react to produce gaseous
olefins, aromatics, oils, CO, CO2, H2, and H2O. The temperature during the secondary regime
ranges from 700-850°C. Finally, in the tertiary regime, the secondary reaction products are
converted to CO, CO2, H2, and H2O at 850-1000°C (Evans and Milne, 1987). Any inorganic
compounds present in the feedstock will react to form ash during gasification (Babu, 2005).
Gasification is an endothermic process which requires thermal energy to drive its reactions
(Munasinghe and Khanal, 2010). Primary reactions that occur during gasification include partial
oxidation (Eq. 1), complete oxidation (Eq. 2), and a water gas reaction (Eq. 3).
𝐶 +1
2𝑂2 ↔ 𝐶𝑂 (1)
𝐶 + 𝑂2 ↔ 𝐶𝑂2 (2)
𝐶 + 𝐻2𝑂 ↔ 𝐶𝑂 + 𝐻2 (3)
Carbon monoxide, hydrogen, and water vapor from the above reactions also participate in the
water gas shift reaction (Eq. 4) and methane formation (Eq. 5) inside the gasifier (McKendry,
2002).
𝐶𝑂 + 𝐻2𝑂 ↔ 𝐶𝑂2+ 𝐻2 (4)
Gasification typically occurs under oxygen limited, fuel-rich conditions with an equivalence ratio
(mass O2/ stoichiometric mass O2) of 0.25 (Kuo, 2005; Reed and Das, 1988). The oxidation
reactions occur within the combustion (oxidation) zone of the gasifier, while the remaining
reactions occur within the reduction zone. Location of these zones (Figure 1.2) is dependent on
the configuration of the gasifier, but regardless of the design, both zones are preceded by a
pyrolysis region where the biomass interacts with hot gas and undergoes thermal decomposition
(Reed and Das, 1988). High moisture levels in the biomass lower the temperature in the
combustion zone of the gasifier which deters the degradation of heavier hydrocarbons.
However, when high water content coincides with the presence of CO, this leads to increased
production of H2 and subsequently increased production of methane (McKendry, 2002).
Feedstock properties such as moisture content and the presence of ash, alkali, and volatile
compounds and feedstock preparation (drying and reduction in particle size) are both vital
parameters which have an impact on the ability to achieve proper gasification and to produce the
desired products (McKendry, 2002).
Currently there are two types of gasifier designs used: fixed bed and fluidized bed. Fixed
bed gasifier configurations can include updraft, downdraft, and cross-flow units, while fluidized
bed configurations are either circulating fluidized beds or bubbling beds. Key differences
between each gasifier configuration are outlined in Table 1.1 and Figure 1.3 (Bridgwater, 1995;
Huber et al., 2006; McKendry, 2002). Fluidized bed gasifiers tend to generate more particulate
matter (char and ash) than fixed bed gasifiers. The principles of fluidized bed technology allow
these gasifiers to operate at a homogeneous temperature; however, the constant intermixing of
the bed material with biomass also allows ash to build up which can lead to slagging (a.k.a. ash
Coal gasification systems have been used since the mid-1800’s to produce energy, steam,
and heat (Kaupp et al., 1984; Turare, 1997). The two main differences between biomass and
coal gasification are the process temperature and the presence of impurities. Biomass has a
higher reactivity than coal, and as a result, the gasification temperatures used with biomass are
lower than those used with coal. A process that functions at lower temperatures means that less
heat is needed to feed the endothermic gasification system for efficient reaction, and the product
gas requires less cooling before storage or use in downstream processes. Despite the benefit of
being a renewable feedstock, the use of biomass requires additional attention in process
development than coal as the presence of potassium, sodium and alkali compounds results in
higher rates of slagging and fouling in the gasifier and downstream equipment (Huber et al.,
2006). A representative component profile for synthesis gas produced from biomass is shown in
Table 1.2. The composition of the product gas obtained from biomass gasification is dependent
on the type of oxidant (air or oxygen) used and the reactor geometry (Bridgwater, 1995).
Purification of syngas streams for subsequent use in microbial fermentation systems is
necessary because the gas is contaminated with particulates, tars, alkali metals, and trace
amounts of chlorine. Without removal of the contaminants, corrosion, erosion, and plugging can
occur in downstream equipment and pipes (Bridgwater, 1995). Equipment that can be used to
clean processed syngas includes scrubbers, filters, cyclones, and spray towers (Bhattacharya et
al., 2001).
Tar levels are dependent on the gasification temperature and the feedstock used
(Bridgwater, 1995). At temperatures below 450°C, tar in the product gas can condense in
downstream equipment. Tar content is removed by either cooling the product gas to 60-80°C
molecular weight compounds through thermal (900-1100°C) or catalytic (800-900°C) cracking.
In order to yield product gas with minimal tar content, the recommended configuration is a
fixed-bed downdraft gasifier (McKendry, 2002). If cleaning operations are minimal downstream, tar
content can also be reduced by using solid catalysts (ex. Ni supported on CeO2/SiO2) inside the
gasifier (Tomishige et al., 2004).
Microorganisms that can convert synthesis gas components to biofuels
Clostridium is a genus of anaerobic bacteria which is usually found in soils, sewage, and the intestinal tract of animals. These microorganisms are known for their ability to produce
ethanol, butanol, acetate, and butyrate during fermentation (Ezeji et al., 2007). The primary
bacterium used to determine the mechanism of syngas metabolism, Moorella thermoacetica
(formerly called Clostridium thermoaceticum), belongs to this group (Drake, H. L. et al., 2008; Pierce et al., 2008), and by extension other Clostridium are considered to be viable targets for current and future syngas fermentation research. Examples of two ethanol producing species
which have been studied in the context of syngas fermentation are Clostridium autoethanogenum
and Clostridium ljungdahlii.
Clostridium autoethanogenum was isolated by Abrini et al. (1994) who classified it as an anaerobic, acetogenic bacterium that can metabolize CO, CO2+H2, xylose, and other sugars to
yield a source of carbon and energy and to produce ethanol and acetate. Its optimal growth is
attained at a temperature of 37°C and pH of 5.8-6.0. Clostridium ljungdahlii is another
acetogenic bacterium which consumes CO, CO2+H2, fructose, and xylose and produces ethanol
and acetate (Tanner et al., 1993). With optimal growth at 37°C and pH 6.0 (Tanner et al., 1993),
genome has reinforced prior discoveries about the organism and also brought to light several new
features (Köpke et al., 2010). The genome confirms that C. ljungdahlii has the necessary
enzymes for hexose metabolism via the Embden-Meyerhof-Parnas pathway, pentose metabolism
via the pentose-phosphate pathway, syngas metabolism via the acetyl-CoA pathway, and ethanol
generation. It has genes for three modes of nitrogen incorporation: assimilation of nitrate, direct
assimilation of ammonia into amino acids, and the fixing of molecular nitrogen. Finally, the
genome shows that rather than using sodium ions or cytochromes and quinones to create a proton
gradient, C. ljungdahlii uses an Rnf complex which is a series of integral and peripheral
membrane proteins used for proton translocation to generate energy (Köpke et al., 2010). Other
species that metabolize synthesis gas components are listed in Table 1.3 with their reported
values for ethanol, butanol and/or hydrogen production.
Mechanisms of microbial synthesis gas utilization
Depending on the reaction conditions and the concentration of species present, syngas
metabolism can be driven towards ethanol, butanol, acetate, and/or butyrate production. The
bacteria which catalyze syngas (CO and CO2+H2) fermentation to ethanol and acetate are
hypothesized to follow the reactions represented by Equations 6-9 (Vega et al., 1989; Vega et al.,
1990):
6𝐶𝑂 + 3𝐻2𝑂 → 𝐶2𝐻5𝑂𝐻 + 4𝐶𝑂2 (6)
4𝐶𝑂 + 2𝐻2𝑂 → 𝐶𝐻3𝐶𝑂𝑂𝐻 + 2𝐶𝑂2 (7)
2𝐶𝑂2+ 6𝐻2 → 𝐶2𝐻5𝑂𝐻 + 3𝐻2𝑂 (8)
2𝐶𝑂2+ 4𝐻2 → 𝐶𝐻3𝐶𝑂𝑂𝐻 + 2𝐻2𝑂 (9)
These obligate, anaerobic bacteria are able to transform syngas by means of the Wood-Ljungdahl
how CO2 was reduced to a methyl group, while Harland Wood focused on the transformation of
CO2 into the carbonyl group on acetyl-CoA (Drake et al., 2008). As a result this pathway is
broken up into an Eastern methyl branch and a Western carbonyl branch (Ragsdale, 1997;
Ragsdale, 2008; Ragsdale and Pierce, 2008). A single CO2 molecule is reduced by six electrons
to CH3-H4folate in the methyl branch, while a second CO2 molecule undergoes reduction to
carbon monoxide in the carbonyl branch; at this point a condensation reaction occurs between
CO, the methyl group, and coenzyme A to produce acetyl-CoA (Ragsdale, 1997). Acetyl-CoA
synthase (ACS) catalyzes the reduction of CO2 to CO. If acetogenesis is initiated by CO (Eq.
7), three of the CO molecules are oxidized to CO2 which makes available the six electrons to
reduce CO2 to a methyl group, and the fourth CO molecule assimilates into the pathway as a
carbonyl group (Drake et al., 2008; Ragsdale and Pierce, 2008). Acetyl-CoA synthase also
catalyzes the oxidation of CO to CO2, but in this sense it is usually called CO dehydrogenase
(CODH) (Drake et al., 1980).
The H2 component of syngas can provide the source of electrons in these reduction
reactions as indicated in equations 8 and 9. For example, C. ljungdahlii expresses assimilatory hydrogenases that allow the microbe to uptake H2 to provide electrons (Köpke et al., 2010).
However, the bioenergetics of the microbes can influence the source of electrons used. This is
often dictated by the media composition, where the preferential source of electrons can be CO
rather than H2. We have observed use of only CO during batch growth of C. ljungdahlii in minimal media when provided syngas components (CO, CO2 and H2), whereas in batch growth
on complex media components (yeast extract, beef extract and peptone) with syngas, CO, CO2
The acetyl-CoA pathway is the primary route used by acetogenic bacteria to generate
fixed carbon and acetyl-CoA and to store energy (Drake et al., 2008; Müller et al., 2004;
Ragsdale and Pierce, 2008). If sufficient CO2 is not provided to acetogens through their external
environment, decreased growth may be observed. (Hsu et al., 1990; Savage et al., 1987).
Elevated proton and acetate levels also hinder growth because they negatively impact the cell’s
ability to maintain a proton motive force and transmembrane electrical potential (Baronofsky et
al., 1984). The substrate level phosphorylation that occurs during the transition from acetyl-CoA
to acetate enables energy storage via ATP generation (Drake et al., 2008).
Unless a catalyst is present, CO and CO2 are not reactive (Ragsdale, 2008). As described
above, the enzyme ACS/CODH catalyzes the conversion of CO2 to CO and vice versa. The
CODH mechanism operates through a “ping-pong” action in which CO reduces CODH, and the
reduced protein transfers electrons to an external redox agent that couples to either reduced
NAD(P)H or ferredoxin dependent processes (Ragsdale, 2007). ACS also initiates the
condensation reaction between CO, the methyl group bound to a corrinoid iron-sulfur protein
(CFeSP), and coenzyme A to produce acetyl-CoA (Menon and Ragsdale, 1996). Formate
dehydrogenase catalyzes the production of formate from CO2. Enzymes related to the
tetrahydrofolate based reaction steps are (in order of utilization): formyl-H4folate synthase,
formyl-H4folate cyclohydrolase, methylene-H4folate dehydrogenase, methylene-H4folate
reductase, and methyltransferase (Pierce et al., 2008). The methyl group of methyl-H4folate is
transported to the cobalt center of a CFeSP by means of methyltransferase (MeTr) catalysis.
This action is part of a sequence of unique reactions in the acetyl-CoA pathway which form
enzyme-bound bioorganometallic intermediates (Ragsdale, 2008; Ragsdale and Pierce, 2008).
acetyl-phosphate and then acetate kinase to yield acetate (Ragsdale and Pierce, 2008). In a similar
fashion, the solventogenesis of ethanol via acetyl-CoA is catalyzed by acetaldehyde
dehydrogenase to yield acetaldehyde and then ethanol dehydrogenase to produce ethanol (Ezeji
et al., 2007). The acetyl-CoA pathway is linked to sugar metabolism by means of pyruvate
ferredoxin oxidoreductase (PFOR) which catalyzes the oxidative decarboxylation of pyruvate to
form acetyl-CoA and CO2 and the reductive carboxylation of acetyl-CoA to yield pyruvate
(Furdui and Ragsdale, 2000; Ragsdale, 2003).
Synthesis gas fermentation
Based on the mechanics of the acetyl-CoA pathway, acetate production results in an
additional ATP synthesis. However, the production of ethanol does not provide the opportunity
for additional ATP production (Klasson et al., 1992). This leads to the assumption that acetate
production is growth related, while ethanol production is non-growth related and higher ethanol
productivity can be attained if growth is purposely regulated. Cotter et al. (2009a) took this concept to the next level and tested the ability to induce resting cultures of C. autoethanogenum
and C. ljungdahlii by removing sources of nitrogen from the liquid media (headspace: inert and batch; carbon: sugar). In media with only yeast extract removed, C. autoethanogenum cells showed higher levels of ethanol production and a more desirable ethanol to acetate ratio
compared to cells grown under normal, unadulterated conditions. However, with all sources of
nitrogen absent, C. autoethanogenum was neither able to sustain a stable culture density nor was it able to achieve a genuine resting state. C. ljungdahlii cells were able to sustain a stable density with all sources of nitrogen removed, but neither ethanol nor acetate could be produced under
these conditions. The lack of significant substrate to product conversion might suggest disrupted
Ramachandriya et al. (2010) also tried to alter the metabolic state of cell cultures by heat shocking Clostridium strain P11 cells to induce sporulation and trigger increased
solventogenesis. Cells heat shocked at 92°C consumed more synthesis gas (headspace gas was
replenished every 24 hours, biomass-derived (BD) syngas), and had higher ethanol yields,
ethanol to acetate ratios, and cell densities than control cultures. Furthermore, the heat shocked
cells transitioned from acid to solvent production a full day earlier than the control cells.
Efforts to increase the ethanol yield over acetate in Clostridia include supplementing the
media, nutrient limiting conditions (ex. nitrogen limitation), addition of a reducing agent, pH
shifts, and addition of hydrogen (Cotter et al., 2009a; Cotter et al., 2009b; Heiskanen et al., 2007;
Hu et al., 2010; Kundiyana et al., 2010; Munasinghe and Khanal, 2010). The availability of
reducing agents is important because they lower the reduction-oxidation (redox) levels of the
microbial environment and impact the solubility of nutrients. Anaerobic microorganisms are
capable of greater metabolic activity at more negative redox potentials (-200 to -500 mV)
(Hickey et al., 2010). Reducing agents can be supplied to change the flow of electrons so that
carbon flow and acid intermediates can be directed towards the production of ethanol (Klasson et
al., 1992). Frankman (2009) found that the reducing agent cysteine sulfide had a bigger
influence on redox potential than the composition of the syngas used in the fermentation vessel
during growth of C. carboxydivorans for ethanol production. In fact, Hu et al. (2010) found that higher cysteine sulfide concentrations in the media during growth of Clostridium strain P11 on synthetic-mixed (SM) syngas led to enhanced ethanol production while lower concentrations
triggered acetogenesis. Another approach used to raise the overall ethanol yield obtained from
with microbial oxidation. The newly formed gases are then fed back into the fermentation vessel
to undergo reaction again (Simpson et al., 2009).
Culture medium formulations are key to establishing stable bacterial cultures that can
effectively ferment synthesis gas. Media for acetogenic bacteria usually consist of reducing
agents, a protein source, trace elements, minerals, and vitamins to produce a healthy cell culture.
Phillips et al. (1993) found that nutritional factors affected cell concentrations which influenced ethanol and acetate yields for C. ljungdahlii grown on SM syngas. Since growth of C.
ljungdahlii in Pfennig’s basal medium yields low cell concentrations (<500 mg/L), it was thought that enriching the medium would provide higher cell yields. However, the doubling of
medium component concentrations resulted in severe growth inhibition, likely due to osmotic
effects on the cells. Limiting B-vitamin concentrations and elimination of yeast extract were
shown to slightly reduce cell growth, but enhance ethanol to acetate ratios. Iron was also
determined to be a limiting trace metal (which may be related to the fixation of CO and CO2 by
carbon monoxide dehydrogenase). An elemental analysis of macronutrients and micronutrients
from this media formulation study indicated that many of the elements were provided in excess.
Therefore, further medium optimization studies are warranted as it is known that the presence of
nutrients in excess can be growth limiting.
In a recent study by Guo et al. (2010), an attempt was made to improve the fermentation media used with C. autoethanogenum. Rather than using the standard DSMZ 640 basal medium for C. autoethanogenum, the medium formulation defined by Rajagopalan et al. (2002) was used as a starting point and then certain ingredients were optimized. Their new medium formulation
uses an initial pH of 4.8 and adjusts components to the following amounts: 0.15 g/L yeast
In experimental trials, the new medium generated a maximum ethanol yield of 260 mg/L (a fairly
high value for C. autoethanogenum cells) with CO (batch headspace, SM) used as the only source of carbon. In a similar study, all or part of the growth media was replaced with cotton
seed extract during fermentation with Clostridium strain P11. The results under both batch and continuous flow (100 ccm) SM syngas conditions were positive and suggest the possibility of
using cotton seed extract in place of more expensive media components to make the fermentation
process more economical (Kundiyana et al., 2010).
Syngas is the central component in gasification-fermentation as it requires successful
production and consumption in order to make the overall process work. In an effort to define the
best mixture of gases, Heiskanen et al. (2007) studied the effect of syngas composition (batch headspace; SM) on a strain of Butyribacterium methylotrophicum that was acclimated to grow solely on carbon monoxide. When both carbon monoxide and carbon dioxide (70:30%) were
used during fermentation, the growth rate and the product concentrations were significantly
higher than with carbon monoxide alone. A possible cause for this shift is the fact that
acetyl-CoA, and hence acetate/alcohol, production requires carbon dioxide. With carbon monoxide and
hydrogen (70:30%) in the fermentation vessel, there were increased levels of butyric acid, but
nearly all of the carbon monoxide was consumed before hydrogen consumption began due to
initial inhibition of the hydrogenase enzyme by carbon monoxide. Finally, a fermentation
headspace which incorporated all three of the main components in syngas (40:35:25% ratio of
H2:CO:CO2) gave rise to near perfect carbon yields (Heiskanen et al., 2007). This indicates that
all three gases are vital for efficient reactant to product conversion.
Along with media composition, proper reactor conditions are crucial to the sustainability
C. ljungdahlii under continuous gas (5, 7.5, and 10 ccm; SM) and batch liquid conditions showed that higher flow rates can lead to higher growth rates and total product levels, and in some cases,
a more optimal ethanol to acetate ratio (Cotter et al., 2009b). The individual rates of gas
consumption as a function of the gas feed rate for each syngas component were comparable
across all three flow rates for the C. autoethanogenum fermentations, but the C. ljungdahlii
results showed a decrease in CO use at 7.5 ccm versus 5 ccm. This effect was attributed to the
reduced gas availability in the media as a result of higher cell densities observed and correlated
decrease in dissolved CO in the 7.5 ccm treatments. This study also showed that flow rate
impacted the rate of net CO2 production by the cells and a more acidic initial media pH (5.5
versus 6.8) led to decreased levels of acetate production by C. ljungdahlii (Cotter et al., 2009b). Studies have also shown that the optimal pH for syngas fermentation ranges between 5.8 and 7.0
(Munasinghe and Khanal, 2010), however adjustment to media pH over the course of the
fermentation can affect final product ratios. Lowering and controlling the media pH (4.0-4.5) in a
continuously stirred tank reactor with cell recycle using cells initially grown up in batch (SM; 30
ccm) resulted in ethanol concentrations as high as 48 g/L and acetate concentrations as low as 3
g/L (560 h) (Phillips et al., 1993).
Higher gas pressures increase the solubility of gas in the liquid phase thus enabling
higher rates of mass transfer and bioconversion (Hickey et al., 2010). Work by Younesi et al.
and Najafpour and Younesi (Najafpour and Younesi, 2006; Younesi et al., 2005) supports this
claim as maximum values for ethanol production, ethanol to acetate ratio, CO2+H2 consumption,
and CO conversion using SM gases were all observed at the highest test pressures used during
rates and found that higher total operating pressures were conducive to increased reactor
productivity (Vega et al., 1990). P. productus is an acetogen which metabolizes CO and CO2 plus H2 primarily to acetic acid and CO2 (Lorowitz and Bryant, 1984). Besides increasing the
mass transfer rates, higher pressure also decreased the gas volume which allowed the use of a
smaller reactor (Henstra et al., 2007). An analysis of reactor size (50 mL versus 100 mL bottles,
both at 1.4 atm) found that although similar mass transfer rates were exhibited, smaller bottles
had twice the growth rate because the headspace difference allowed a greater quantity of CO per
liter (Frankman, 2009).
In order for a microorganism to convert syngas, the gas molecules must cross the
gas-liquid interface and then diffuse through the gas-liquid medium to the cell surface where it can be
incorporated into the cell. Mass transfer can be optimized by maximizing the mass transfer
coefficient or the motive driving force (Vega et al., 1989). For marginally soluble gases (ex.
CO), the magnitude of absorption across the gas-liquid interface is defined by Equation 10
(Klasson et al., 1992).
𝑚𝑜𝑙𝑒𝑠 𝑡𝑟𝑎𝑛𝑠𝑝𝑜𝑟𝑡𝑒𝑑 =𝐻(𝑃𝐺 − 𝑃𝐿)
𝐾𝐿𝑎 (10)
H = Henry’s law constant
PG = partial pressure of the substrate in the gas phase
PL = partial pressure of the substrate in the liquid phase
KLa = mass transfer coefficient
For C. carboxidivorans P7 syngas (SM) fermentations with a continuous gas flow rate of 10 ccm, as the partial pressure of CO increased, the maximum carrying capacity of the cell
population also rose (Hurst and Lewis, 2010). The same effect was observed for the amount of
This occurred because higher operating pressures led to higher rates of CO uptake. On the
downside is the fact that CO also inhibits growth and CO uptake at dissolved CO tensions of
0.8-1.0 atm, but this accumulation may be avoided at higher pressures by maintaining a high cell
density which can absorb greater quantities of CO (Vega et al., 1990).
According to Vega et al. (1990), the relationship between mass transfer, kinetics, cell growth, and end product creation can be explained as follows. At low cell densities, there is an
overabundance of gaseous species in the liquid phase because there are few cells to consume the
substrate. As a consequence, the driving force to produce products is dependent on the kinetic
affinity of the reactants in the system (in this case, the metabolic pathway of the cells).
However, as the density of cells increases, the concentration of gaseous species in the liquid
phase gradually decreases and eventually a point is reached at which the substrate concentration
becomes limited and product inhibition may occur. At this point, the driving force behind the
rate of reaction shifts and is now associated with the speed of interfacial mass transfer. In short,
at the beginning of fermentation, reaction kinetics controls the rate of product (acid, alcohol, or
cell) generation. Then as the fermentation progresses, product synthesis becomes dependent on
mass transfer rates.
Datar et al. (2004) was the first group to demonstrate success in fermenting true biomass derived synthesis gas with C. carboxidivorans P7 as the biocatalyst. In trials, which used a continuous gas flow rate of 180 ccm, they noted that the processed synthesis gas caused the cells
to stop growing, but growth resumed once the cells were transitioned to a pure gas mixture of
CO, CO2, H2 and balance N2. The period of non-growth showed signs of processed syngas
metabolism to ethanol, which was consistent with the common assumption that solventogenesis
Datar et al., Ahmed et al. (2006) hypothesized that tar was the growth inhibitor and overcame stunted cell growth by using a 0.025 µm filter to remove contaminant from the processed gas
(160 ccm feed flow rate; BD). Another issue that arose during C. carboxidivorans P7 trials was inhibition of the hydrogenase enzyme by nitric oxide (Ahmed et al., 2006; Ahmed and Lewis,
2007; Datar et al., 2004). However, provided that nitric oxide levels were kept below 40 ppm,
this inhibition was avoided during experimental trials with a processed (BD) gas flow rate of 10
ccm. (Ahmed and Lewis, 2007). The overall significance of this C. carboxidivorans P7 work is the illustration of how acetogenic bacteria interact with biomass derived synthesis gas and the
types of obstacles that must be dealt with and overcome in order to successfully use this form of
the gaseous feedstock. Tar and nitric oxide are both synthesis gas contaminants which are
produced during the gasification and/or combustion process. In order for biomass gasification
and syngas fermentation to work as a unified concept, each part of the hybrid process chain must
be optimized such that the two can fit together effectively and produce maximal results.
Although there is no optimal bioreactor design due to the various characteristics of the
microorganisms used in fermentation, the reactor vessel has a big impact on the success or
failure of the fermentation process (Kadic, 2010). Aside from the batch reactor, the most
common reactor design is a continuous-stirred tank reactor (CSTR) (Figure 1.5) which allows
continual gas flow into an agitated reactor with a fixed liquid volume (Klasson et al., 1992; Vega
et al., 1990). CSTR’s often yield the highest mass transfer rates; however, high shear rates from
excessive agitation speeds can be prohibitive to cell growth (Kadic, 2010). Higher impeller
speeds break gas bubbles into finer ones which allow the microorganisms greater access to the
substrate gas. Finer bubbles also have a slower rising velocity that enables longer gas retention
al. (Younesi et al., 2006) affirmed this point through C. ljungdahlii fermentation studies in a CSTR as it was found that higher flow rates (ex. 14 ccm), an impeller speed of 550 rpm versus
400 rpm, and pure CO in the headspace led to the highest mass transfer (KLa=135 h-1).
The bubble column reactor is desirable if a long liquid retention time or a sizeable liquid
holdup volume is required. These reactors have a simple design, no moving parts, and require
minimal upkeep. They also exhibit large mass transfer coefficients and a large area at the
gas-liquid interface. On the downside, particles tend to stick together or coalesce in bubble columns
along with the occurrence of substantial back-mixing, but these issues can be avoided with the
use of inert materials to disrupt bubble coalescence (Charpentier, 1981; Kadic, 2010; Klasson et
al., 1992; Vega et al., 1990).
When there is minimal heat exchange, packed columns are often used to achieve small
pressure changes and a minimal liquid holdup volume. On an industrial scale, if any of the
reactants or products is corrosive, the packed column is a good choice as it is much easier to
replace the packing than an agitator or custom made reactor components (Charpentier, 1981;
Klasson et al., 1992). Packed column reactors also readily sustain the microorganisms since the
microbes can form a biofilm on the packing pieces which offer a high surface area. However,
compared to other reactors, the packed column exhibits poor gas and liquid flow rates (Kadic,
2010).
Future perspective
Combined gasification-fermentation technologies offer a unique approach to biofuel
production from renewable, non-food biomass. As with every developing technology there are
process challenges linked to each unit operation that need to be addressed and solutions
established history, yet the use of biomass resources as a feedstock has new implications on
material handling and transport, operational parameters and variability in gas products and
impurities. The use of a subsequent fermentation processing step in conjunction with
gasification necessitates having gas streams compatible with robust microbial growth, and gas
purification methods that are efficient and not cost prohibitive.
The metabolic capacity of microbes to fix single carbon gases and convert them to
biofuels is fairly uncommon and is restricted to a distinct group of microorganisms. These
microbes are obligate anaerobes and are typically slow-growing, yield low cell densities, and can
have complex nutritional requirements. Because of these growth challenges in combination with
mass transfer limitations of the gaseous substrate, research to enhance autotrophic culture
performance is critical to development of commercial-scale biofuel production using the
gasification-fermentation approach.
White et al. (2007) have stated that they can maintain bacterial cultures on syngas (both batch and continuous gas flow) for over two months without any replenishment of the initial
liquid media components. During fermentation, the ethanol concentration was reported to
increase at a constant rate while the acetic acid concentration decreased. Kundiyana et al. (2010) witnessed similar results with biomass-derived syngas and a pilot scale fermenter run in batch
liquid medium with continuous gas sparging at 900 sccm. Using Clostridium strain P11 as their microorganism of choice, they observed a 24 day acetogenesis phase followed by a 35 day
solventogenic phase which was dominated by ethanol production. Such advances are required in
order for gasification-fermentation to be considered a feasible technology for larger scale
Currently one of the outstanding questions for syngas fermentation is what aspect of the
process is most limiting for solvent production. The microbial catalysts are genetically
programmed to produce energetically favored products (acids) and limit solvent production that
can be inhibiting to cell structure integrity and intracellular enzyme activities. To overcome the
innate physiology of these microbes and advance the technology, particular growth conditions
and/or genetic modification designed to redirect metabolism towards solventogenesis and
manage BD syngas toxicity are critical. Low molecular weight gases such as those required for
syngas fermentation have poor solubility in the liquid phase, and therefore can limit substrate
availability to the microbes. Enhancing gas-cell interactions through reactor
design/configurations, operating parameters, and immobilization techniques are also important to
defining an improved process. A combination of research focused on developing better
solvent-producing strains and improved microbial gas consumption will help elucidate the most
significant factors limiting the process.
Recent advances in these areas have likely enabled technology development centered on
the acetogen strains C. carboxidivorans and C. ljungdahlii to reach the stage where companies are licensing their applications. Coskata, Inc. uses C. carboxidivorans as the bacterial
biocatalyst in their semi-commercial scale plant which is designed to allow easy scale-up to
facilities capable of producing 50 million gallons of cellulosic ethanol a year (Coskata, 2011;
Pinatti et al., 2010). In a similar fashion, INEOS Bio is designing a commercial process for C. ljungdahlii syngas fermentation (Green Car Congress, 2008; INEOS Bio,. 2011b; Pinatti et al., 2010; Wei et al., 2009) and, in a joint venture with New Planet Energy, has recently begun
construction on a commercial-scale ethanol biorefinery that is slated to produce 8 million gallons
on bringing syngas fermentation technology to the commercial scale is LanzaTech which uses
these methods to produce ethanol from both syngas and CO-rich steel mill off gases (Lanza
Figure 1.1. Ethanol production process from lignocellulosic biomass. a) Using gasification-fermentation. b) Using traditional methods – pretreatment-hydrolysis-gasification-fermentation.
Table 1.1. Gasifier configurations.
Type Biomass/Air Movement
Fixed bed
Updraft gasifier Feed movement is directed downward while air is
injected in the upward direction from the bottom of the unit.
Downdraft gasifier Feed and air movement are directed downward in the
same direction.
Cross-flow gasifier Feed movement is directed downward while air is
injected in the transverse direction.
Fluidized bed
Circulating fluidized bed gasifier Bed material is circulated from the gasifier to a separation apparatus to remove debris and then back to the gasifier.
Bubbling bed gasifier Air is injected at the bottom of the apparatus and
Table 1.2. Composition of synthesis gas from biomass gasification.
Gasifier Biomass
Component (% Volume, dry)
Reference CO H2 CO2 CH4 C2H4 C2H6 N2
Downdraft Switchgrass 12-18 7-12 10-17 - - - 60 (Kundiyana, Huhnke, and
Wilkins, 2010)
Downdraft 95% Hardwood
chips 23.9 17 11 1.4 - - 46.7 (Yang et al., 2009)
Downdraft (air) n/a 21 17 13 1 - - 48 (Bridgwater, 1995)
Downdraft (O2) n/a 48 32 15 2 - - 3 (Bridgwater, 1995)
Downdraft n/a 22.1 15.2 10.2 1.7 - - 50.8 (Reed and Das, 1988; Reed,
1981)
Updraft (air) n/a 21 11 9 3 - - 53 (Bridgwater, 1995)
Multi-stage hybrid Coconut shell &
charcoal 17-22 11-14 10-15 1-3 - - 50-60 (Bhattacharya et al., 2001)
Bubbling fluidized bed
Empty palm fruit
husks 16.6 5.6 19.2 4.3 - - 54 (Lahijani and Zainal, 2011)
Fluidized bed Switchgrass 14.7 4.4 16.5 4.2 2.4 - 56.8 (Datar et al., 2004)
Table 1.3. Reported product profiles formicrobial species that metabolize syngas to solvents.
Organism Substrate Solvent
Production
Ethanol: Acetate
Molar Ratio Product Yield
Gas Flow During
Reaction Reference
Ethanol production
C. ljungdahlii SM: H2, CO, CO2 - 1:9-22 -
Batch (0.088-2.53 atm)
(Vega et al., 1989)
C. ljungdahlii SM: H2, CO, CO2 0.2-2.8 g/L 1:0.8-5 -
Continuous (3.5 ccm)
(Vega et al., 1989)
C. ljungdahlii Fructose;
SM: H2, CO, CO2
0.55 g/L 1:1.85 0.41 mg net
products/mg CO
Batch (0.08-1.8 atm)
(Younesi et al., 2005)
C. ljungdahlii Fructose;
SM: H2, CO, CO2
- 1:0.7-1 1.45-3.25 mmol
EtOH/mmol CO
Continuous (8-14 ccm)
(Younesi et al., 2006)
C. ljungdahlii Fructose;
SM: H2, CO, CO2
73-175 mg/L 1:8 - Continuous
(5-10 ccm)
(Cotter et al., 2009b)
C. autoethanogenum Xylose;
SM: H2, CO, CO2
38-67 mg/L 1:13 - Continuous
(5-10 ccm)
(Abrini et al., 1994; Cotter et
al., 2009b)
C. autoethanogenum SM: CO 260 mg/L - - Batch
(1 atm)
(Guo et al., 2010)
C. autoethanogenum SM: CO 70-355 mg/L 1:1.03-3.6 0.044-0.074 mmol
EtOH/mmol CO
Batch (1.97 atm)
(Abrini et al., 1994)
Clostridium strain P11 BD: H2, CO, CO2 1.2 g/L 1:1.4
0.055 mol EtOH/mol CO
Fed-batch replenished every 24h
(2.56 atm)
(Ramachandriya et al., 2010)
Clostridium strain P11 Cotton seed extract;
SM: H2, CO, CO2
1.2-2.6 g/L 1:0.09-4 -
Fed-batch replenished every 24h
(2.36 atm)
(Kundiyana et al., 2010)
Clostridium strain P11 Cotton seed extract;
SM: H2, CO, CO2
2-3 g/L ~1:1 - Continuous
(100 ccm)
Table 1.3. (continued).
Clostridium strain P11 Corn steep liquor;
BD: H2, CO, CO2
25.2 g/L 1:0.15 - Continuous
(900 ccm)
(Kundiyana, Huhnke, and Wilkins,
2010)
C. carboxidivorans P7 SM: CO, CO2 - 1:0.17
0.075 mol EtOH/mol CO
Continuous (200 ccm)
(Rajagopalan et al., 2002)
C. carboxidivorans P7 BD: H2, CO, CO2 1.6 g/L 1:0.19 -
Continuous (180 ccm)
(Datar et al., 2004; Liou et al., 2005)
C. carboxidivorans P7 SM: CO, CO2 0.5-2.5 g/L 1:0.96 -
Continuous (10 ccm)
(Hurst and Lewis, 2010)
C. carboxidivorans P7 SM: CO - 1:0.125 0.16 mmol EtOH/mmol
CO
Batch (2.27 atm)
(Liou et al., 2005)
Moorella sp. HUC22-1 SM: H2, CO2 710 mg/L 1:43 -
Batch (1.97 atm)
(Sakai et al., 2004; Sakai et al., 2005)
Butanol production
Butyribacterium
methylotrophicum SM: H2, CO, CO2 - -
0.9-1.1 mg net products/mg CO
Batch (1atm)
(Heiskanen et al., 2007; Zeikus et al.,
1980)
C. carboxidivorans P7 SM: CO, CO2 - 1:0.17
0.018 mol BuOH/mol CO
Continuous (200 ccm)
(Rajagopalan et al., 2002)
C. carboxidivorans P7 SM: CO - 1:0.125 0.04 mmol
BuOH/mmol CO
Batch (2.27 atm)
(Liou et al., 2005)
Hydrogen production
Rhodospirillum rubrum SM: H2, CO, CO2 - -
0.6-0.7 mmol H2/mmol
CO
Continuous (5-14 ccm)
(Younesi et al., 2008)
Figure 1.4. Wood-Ljungdahl pathway. 1) formate dehydrogenase; 2) formyl-H4folate synthase;
3) formyl-H4folate cyclohydrolase; 4) methylene-H4folate dehydrogenase; 5) methylene-H4folate reductase; 6) methyltransferase; 7) CO dehydrogenase; 8) acetyl-CoA synthase; 9)
phosphotransacetylase; 10) acetate kinase; 11) acetaldehyde dehydrogenase; 12) ethanol
REFERENCES
Abrini, J., Naveau, H., and Nyns, E.J. (1994). Clostridium autoethanogenum, sp. nov., an anaerobic bacterium that produces ethanol from carbon monoxide. Arch. Microbiol. 161,
345-351.
Ahmed, A., Cateni, B.G., Huhnke, R.L., and Lewis, R.S. (2006). Effects of biomass-generated producer gas constituents on cell growth, product distribution and hydrogenase activity of
Clostridium carboxidivorans P7T. Biomass Bioenergy 30, 665-672.
Ahmed, A., and Lewis, R.S. (2007). Fermentation of biomass‐generated synthesis gas: Effects of nitric oxide. Biotechnol. Bioeng. 97, 1080-1086.
Babu, S.P. (2005). Observations on the current status of biomass gasification. Biomass & Bioenergy 29, 1-12.
Baronofsky, J.J., Schreurs, W.J.A., and Kashket, E.R. (1984). Uncoupling by acetic acid limits growth of and acetogenesis by Clostridium thermoaceticum. Appl. Environ. Microbiol.
48, 1134-1139.
Bhattacharya, S., Shwe Hla, S., and Pham, H.L. (2001). A study on a multi-stage hybrid gasifier-engine system. Biomass Bioenergy 21, 445-460.
Bridgwater, A.V. (1995). The technical and economic feasibility of biomass gasification for power generation. Fuel 74, 631-653.
Charpentier, J.C. (1981). Mass-transfer rates in gas-liquid absorbers and reactors. Advances in Chemical Engineering 11, 1-133.
Coskata, Inc. Semi-Commercial Facility. (2011)
http://www.coskata.com/facilities/index.asp?source=568A3D3C-AACF-4D95-B297-7264DD2C17B5
Cotter, J.L., Chinn, M.S., and Grunden, A.M. (2009a). Ethanol and acetate production by
Clostridium ljungdahlii and Clostridium autoethanogenum using resting cells. Bioprocess and Biosystems Engineering 32, 369-380.
Cotter, J.L., Chinn, M.S., and Grunden, A.M. (2009b). Influence of process parameters on growth of Clostridium ljungdahlii and Clostridium autoethanogenum on synthesis gas. Enzyme Microb. Technol. 44, 281-288.
Datar, R.P., Shenkman, R.M., Cateni, B.G., Huhnke, R.L., and Lewis, R.S. (2004). Fermentation of biomass-generated producer gas to ethanol. Biotechnol. Bioeng. 86, 587-594.
Drake, H.L., Gößner, A.S., and Daniel, S.L. (2008). Old acetogens, new light. Ann. N. Y. Acad. Sci. 1125, 100-128.
Drake, H., Hu, S., and Wood, H. (1980). Purification of carbon monoxide dehydrogenase, a nickel enzyme from Clostridium thermocaceticum. J. Biol. Chem. 255, 7174-7180. Evans, R.J., and Milne, T.A. (1987). Molecular characterization of the pyrolysis of biomass.
Energy Fuels 1, 123-137.
Ezeji, T.C., Qureshi, N., and Blaschek, H.P. (2007). Bioproduction of butanol from biomass: from genes to bioreactors. Curr. Opin. Biotechnol. 18, 220-227.
Frankman, A.W. (2009). Redox, Pressure and Mass Transfer Effects on Syngas Fermentation. Brigham Young Univeristy.
Furdui, C., and Ragsdale, S.W. (2000). The role of pyruvate ferredoxin oxidoreductase in pyruvate synthesis during autotrophic growth by the Wood-Ljungdahl pathway. J. Biol. Chem. 275, 28494-28499.
Green Car Congress. INEOS Bio to Commercialize BRI Thermochemical/Biochemical Waste-to-Ethanol Process. (2008) http://www.greencarcongress.com/2008/07/ineos-bio-to-co.html
Guo, Y., Xu, J., Zhang, Y., Xu, H., Yuan, Z., and Li, D. (2010). Medium optimization for ethanol production with Clostridium autoethanogenum with carbon monoxide as sole carbon source. Bioresour. Technol. 101, 8784-8789.
Hayes, D.J. (2009). An examination of biorefining processes, catalysts and challenges. Catalysis Today 145, 138-151.
Heiskanen, H., Virkajärvi, I., and Viikari, L. (2007). The effect of syngas composition on the growth and product formation of Butyribacterium methylotrophicum. Enzyme Microb. Technol. 41, 362-367.
Henstra, A.M., Sipma, J., Rinzema, A., and Stams, A.J.M. (2007). Microbiology of synthesis gas fermentation for biofuel production. Curr. Opin. Biotechnol. 18, 200-206.
Hickey R, Basu R, Datta R, Tsai SP. Method of Conversion of Syngas Using Microorgamism of Hydrophilic Membrane. US2010/0047886A1 (2010).
Hsu, T., Daniel, S.L., Lux, M.F., and Drake, H.L. (1990). Biotransformations of carboxylated aromatic compounds by the acetogen Clostridium thermoaceticum: generation of growth-supportive CO2 equivalents under CO2-limited conditions. J. Bacteriol. 172, 212-217. Hu, P., Jacobsen, L.T., Horton, J.G., and Lewis, R.S. (2010). Sulfide assessment in bioreactors
Huber, G.W., Iborra, S., and Corma, A. (2006). Synthesis of transportation fuels from biomass: chemistry, catalysts, and engineering. Chem. Rev. 106, 4044-4098.
Hurst, K.M., and Lewis, R.S. (2010). Carbon monoxide partial pressure effects on the metabolic process of syngas fermentation. Biochem. Eng. J. 48, 159-165.
INEOS Bio. INEOS Bio JV Breaks Ground on 1st Advanced Waste-to-Fuel Commercial Biorefinery in U.S. (2011a) http://www.ineosbio.com/76-Press_releases-15.htm
INEOS Bio. Technology Platform. (2011b) http://www.ineosbio.com/60-Technology_platform.htm
International Energy Agency. IEA Energy Statistics - Oil for United States. (2010a) http://www.iea.org/stats/oildata.asp?COUNTRY_CODE=US
International Energy Agency. IEA Energy Statistics - Renewables for United States. (2010b) http://www.iea.org/stats/renewdata.asp?COUNTRY_CODE=US
Jeffries, T., and Jin, Y.S. (2004). Metabolic engineering for improved fermentation of pentoses by yeasts. Appl. Microbiol. Biotechnol. 63, 495-509.
Kadic, E. (2010). Survey of gas-liquid mass transfer in bioreactors. Iowa State University.
Kaupp, A., Goss, J.R., and United States. Agency for International Development. (1984). Small scale gas producer-engine systems. Vieweg, Wiesbaden, Germany.
Klasson, K.T., Ackerson, M.D., Clausen, E.C., and Gaddy, J.L. (1992). Bioconversion of synthesis gas into liquid or gaseous fuels. Enzyme Microb. Technol. 14, 602-608. Köpke, M., Held, C., Hujer, S., Liesegang, H., Wiezer, A., Wollherr, A., Ehrenreich, A., Liebl,
W., Gottschalk, G., and Dürre, P. (2010). Clostridium ljungdahlii represents a microbial production platform based on syngas. Proceedings of the National Academy of Sciences
107, 13087-13092.
Kundiyana, D.K., Huhnke, R.L., Maddipati, P., Atiyeh, H.K., and Wilkins, M.R. (2010).
Feasibility of Incorporating Cotton Seed Extract in Clostridium strain P11 Fermentation Medium During Synthesis Gas Fermentation. Bioresour. Technol. 101, 9673-9680. Kundiyana, D.K., Huhnke, R.L., and Wilkins, M.R. (2010). Syngas fermentation in a 100-L pilot
scale fermentor: Design and process considerations. Journal of Bioscience and Bioengineering 109, 492-498.