A QUEUEING SYSTEM WHERE CUSTOMERS SIMULTANEOUSLY REQUIRE A RANDOM NUMBER OF SERVERS
-A
NUMERICAL INVESTIGATIONBy
G. Y. Fletcher H. G. Perras
w.
J. StewartCENTER FOR COMMUNICATIONS AND SIGNAL PROCESSING
North Carolina State UniversityRaleigh, NC 27695-7914
Abstract
A closed single node queueing system is analyzed numerically. The node consists of M identical servers fed by a single queue. Each customer simultaneously requires a random number of servers r, l~ r ~ M, which are released at the same time upon service completion. The service time of a customer requiring r servers
1. ~~t~oduction
Multi-server queueing systems in which customers simultaneously require a random number of servers arise naturally in many telecommunication and computer systems. In the multi-server queueing system studied in this paper, a customer can not start its service until all requested servers are available. All servers asso-ciated with a particular customer start and end service at the same time. Such a queueing system arises in satellite communication systems operating under a frequency-division multiple access scheme (FDMA). In such a scheme, the trans-ponder's bandwith is divided into smaller bandwiths. An earth station may transmit on one or more of these smaller bandwiths.
The queueing system studied here can be used to model data multiplexing schemes similar to the time division multiple access scheme (TDMA) for satellites, in which the digital channel is represented by a frame structure consisting of a fixed number of slots. Frames are identical in structure and they occur conse-cutively. A customer is allocated one or more slots of a frame. These slots are used by the same customer for as many successive frames as required. Upon completion of its service, the customer simultaneously releases all his slots. Such a scheme allows a circuit-switching capability to be implemented and it has been proposed
in connection with hybrid switching schemes for integrated voice, image and data communications. This particular circuit-switching scheme can be modelled as a multi-server queue in which customers require a random number of servers. Each slot may be represented by a server. Thus, a frame of s slots wil be modelled by s servers. Furthermore, the number of consecutive frames over which the user will transmit is assumed to have a geometric distribution.
It is interesting to note that relatively little has been reported in the literature on the analysis of this particular queueing system, despite the fact that it commonly arises in many real-life situations. Green [5] studied an M/M/s version of this
queueing system assuming that the servers assigned to the same customer do not end service simultaneously. Thus these servers become available independently. Analytic expressions for the distribution of the waiting time in the queue and the distribution of the busy servers were obtained. A comparison of various service disciplines
associated with this type of queueing system can be found in Green [6]. Brill and Green [2] obtained the waiting time distribution of a customer in a similar system assuming that all servers associated with a customer end service at the same time.
2 (see Brill [3J) and is limited to a two-server queueing system.
Arthurs and Kaufman [lJ studied an Erlang loss type of system assuming that customers require simultaneous service from a random number of servers. Servers assigned to the same customer begin and end service concurrently. The steady-state distribution of the number of customers in the system is shown to have a product-form solution and ;s dependent on the service time distributions only through their means. This product-form solution also holds for general service distributions (see Kaufman [7J and Schwartz and Kraimeche [9]. Kim [8] analyzed numerically a system si~lilar to the one studied by Brill and Green [2J by devising an algorithmic approach to obtain the expected number of customers in the system, when the system size is not too large. Finally, Gopal and Stern [4J studied the problem of controlling access to a system simila. to the one studied by Arthurs and Kaufman [lJ with a heterogeneous mix of circuit-switched traffic.
2. Problem formulation
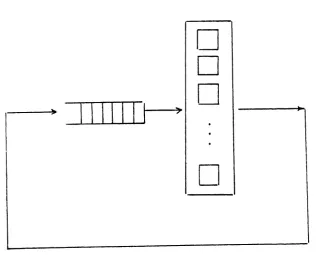
We shall use the queueing model shown in figure 1 to model the circuit-switching system described in the previous section.
o
D
o
o
The model consists of M identical servers (or resources) fed by a single queue. Customers are chosen from the queue by means of the First-Come-First-Served (FCFS) scheduling discipline. However, each customer can request more than one server; in fact a customer may require any number of servers up to the maximum of M. The customer at the head of the queue remains in the queue until the total number of servers he requires becomes available at which time he is simultaneously allocated this number. Since all the servers are identical, the particular ones allocated
is irrelevent. Note that the FCFS discipline may force customers (other than the first) to wait even though there may be sufficient resource available (and hence idle) to service their requests. The advantage of the FCFS algorithm is that it prevents the undesirable phenomenon of lIindefinite postponementll
• Note also that FCFS may
result in several customers being able to enter service simultaneously upon completion of a service.
Each customer monopolizes all the servers that have been allocated to him for a period of time that is exponentially distributed. At the end of this period, the customer simultaneously releases all this resource. For the purposes of the model, we shall assume that a customer belongs to one of R possible classes (R ~ M). A class r custo~er (1 ~ r ~ R) requires r servers simultaneously. To further generalize the model, we shall also assume that the exponetial service time distribution may be class dependent.
The queueing system is closed in that a fixed number of customers, N, circulate in the model. In particualr, there are no external arrivals nor departures. Customers who terminate their service and release their allotment are simply fed back to the end of the queue. At this point, the customer may change class. When a customer of class r terminates and frees r servers, he returns to the queue as a class s customer with probability Pr s
=
Ps (i.e independent of r).The queueing model under study is analyzed with a view to obtaining performance measures such as throughput, distribution of busy servers, and queue-length dis-tribution. ~e note that there is no advantage in choosing N > Msince customers in excess of Mwould be simply forced to wait in the queue. In view of this, for N> Mthe throughput and the distribution of busy servers are identical to those obtained when N= M. Also, for N> Mthe mean queue-length can be easily calculated based on results obtained for the case of N
=
M.behaviour of the following two real-life systems.
a) Th2:2 is an infinite population of customers that utilize the circuit-switching
~ys~em. A customer upon completion of its service, simply departs from the
system.
In this case, the queueing ~odel can be used to study the system under heavy traffic, by assuming N to be so large that the probability the queue is empty is negligible.
b) There is a finite population of customers utilizing the circuit-switching system. Customers that are not queueing up or being served are assumed to be in a "think" state. This system is analogous to the well-known time-sharing (or machine
interference) model.
The queueing model studied here reflects a heavy traffic version of the above system in Nhich customers spend zero time in think state.
There are no known analytical methods available for solving such a queueing system. We shall use numerical techniques to obtain a solution since the only other alter-native, simulation, would be much too expensive. The numerical approach involves choosing an appropriate state description vector for the system; determining the :orresponding transition rate matrix, i.e. the matrix whose(i-j)th component denotes
the rate of transition from state i to state j, and finally calculating from this ~~atrix the sta~ionary probability vector of the system, i.e. the vector whose i-th component denotes the long run probability of being in state i. From this vector we can easily derive all the parameters of interest: the throughput (i.e. the number of customers served per unit time), the queue-length distribution and the distri-bution of busy (or idle) servers.
However, to be able to compute these resul~s efficiently, it is imperative that the di:aension of the matrix (and therefore the number of states that the system can occupy) be kept to a minimum.
3. State Descriptions
A state of the queueing system may be completely described by a vector of length N+ M as follows:
where k. denotes the class of the i-th customer in the queue; i.e. k. E (O,l, ... R)
V i, kj
=
a
Vj > n, n being the number of customers in the queue. The quantity si denotes the identification of the customer that is using the i-th server i.e. si £ {O,l, ... N} with si being equal to zero if the i-th server is idle. Unfor-tunately, the size of the state space generated by this description is extremely large, even for moderate values of Nand M, so that a more compact description is needed.In this particular problem, it is not necessary to distinguish among the customers in the queue. If we allow a customer to postpone identifying its class until it
reaches the head of the queue, then we can simplify the state description considerably. In addition, instead of indicating the identity of the customer associated with each server it suffices to indicate the number of class r customers currently in service, r
=
1,2, ... R, (since the servers are all identical). With these modifications aa state may be described by a vector of length: ... ,c ,
r
where c
r denotes the number of class r customers currently r~ceiving service. Note that the number of customers currently receiving service ;s f c < N the number
r=1 r -R
of customers in the queue ;s equal to N - E C > 0
r=l r
-R
isM - z rc >
o.
rel r
-and the number of idle servers
With this description we can obtain all the performance characteristics we require. Although we have lost information, this is not pertinent to our anaylsis. For example, much of the lost information simply concerns the order of customers in the queue, or which particular customer has possession of a specific server, etc. The number of states generated by this description can still become rather large as is indicated by table 1. Note that limiting the number of classes to which a server may belong reduces the number of states generated. However, the reduction
Number of Possible Customer Classes Number of
Servers, M States
10 1,2,3, ... ,10 138
12 1,2,3, ... ,12 271
16 1,2,3, ... ,16 683
20 1,2,3, ... ,20 2,713
20 1,2,3, ... ,10,12,14, ... ,20 2,543
24 1,2,3, ... ,24 7,337
24 1,2,3, ... ,10,12,14, ... ,24 6,600
24 1,2,3,4, 6,8, 10, 12, 16,20,24 3, 121
30 1,2,3, .•. ,30 28,628
30 1,2,3, ... ,10,12,14, ... ,30 23,959
30 1,2,3, ... ,10, 12, 14, 16, 20,24,28 23,609
30 1,2,3, ... ,10 20,544
32 1,2,3,4, 6,8, 10, 12, 16,20,24,28,32 12,783
Table 1: Number of States
the number of idle servers, i.e. M - m. However we do not always know the class of the customer at the head of the queue (except that it must be strictly greater than M - m)and although we know the number of busy servers and the number of customers being served, we cannot always determine exactly the classes of the customers being served. We are forced to estimate these quantities and hence introduce a source of inaccuracy.
The advantage of this state description is that the number of states remains relatively modest with increasing M. It is not difficult to calculate that the number of states
is equal to
M
L:
i=l =
r~(M+ 1) 2
when all possible customer classes are permitted (i.e. R
=
M) and also N=
M. Thus for M= 30, we obtain only 465 states as compared to 28,628 with the previous state description.The approach which we adoped was to use this simplified state description, (n,m), when it was necessary to analyze the system will all possible job classes present.
If however, only a modest number of job classes could exist (e.g. ~ 5) then it is more appropriate to use the second state description, (c 1,c2, ... cR). In the sequel, we refer to these two approaches respectively as the approximate approach and the exact approach.
4. Generation of the Transition Rate Matrix
We have already referred to the fact that, depending on which state description is used, the total number of states generated is vastly different. However, the amount of work involved in generating the transition rate matrix is approximately the same
irregardless of which of the two approaches is used. This is because determining the rates of transition from one macro state, (n,m), to another (n~,m~) requires a knowledge of all the microstates (of the form (c1,c 2... cR) which may be involved in this transition. Consequently, in this section we shall only discuss the generation of the transition probability matrix for the exact approach.
Computer generation of the transition rate matrix requires the solution of three basic problems. The first is simply to enumerate all of the states of the system. The second is to associate the proper enumeration integer with the vector description of any arbitrary state. The third is to find all of the states which are accessible from an arbitrary given state (as well as the rate associated with each transition). We term these the "enumeration" problem, the "translation" problem, and the IItransition' problem respectively.
8 imparts to the transition rate matrix. Our investigations have led us to use an enumeration algorithm which achieves a somewhat natural progression from those states where the number of customers in service is high to those where it is low. The resulting rate matrix is roughly block lower triangular. To see why this shape is obtained we remark that when a transition occurs the number of customers in service generally increases since it can never decrease by more than one but may increase by several more. Thus most of the accessible states will have a lower state number in our enumeration scheme and will generate entries in the lower triangular part of the transition rate matrix.
The translation algorithm produces the correct state number for a given state vector. Due to the frequency with which it is called, it is perhaps the most time critical routine in the matrix generation procedure. In our implementation the task is accomplished via a binary IIdictionary" tree. The components of the state vector provide keys describing a path to the leaf which contains the associated state
number. In particular, this path is traced by the fo~lowing algorithm which decides whether the left son or the right son of the current node should be visited next and arrives at a leaf whose label is the state number.
current node is root
do while (keys/components remain) consider next key
do while (label of current node fails to match key) visit left son
visit right son
return label of current node (leaf)
As a practical matter the components should be considered in reverse order (pre-cedence of a class determined by its service requirement). This will insure that the resulting tree is as short and full as possible. The tree is built in a
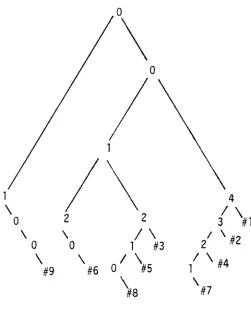
preliminary pre-processing phase and can be viewed as a fixed cost overhead for the remaining calculations. As an example we consider a system with four servers and three classes with weights one, two, and four respectively. This system gives rise to nine states where the order of the enumeration is:
o
\
o
1 4
\
2 2 { \#1
0
\ \
/ \
2' \
#20 0 1 #3
\
\ /\
/ \ #4#9 #6
o
#5 1\8
\#7
Figure 2: The dictionary tree
The synthesis of state transitions is facilitated by the use of two parameters, the number of available (idle) servers (#AVL) and the smallest class waiting (SeW), i.e., the number of the smallest class whose service requirement exceeds #AVL. It has the property that no smaller class could be at the head of the queue (otherwise it would already have entered). These parameters are redundant in an informational sense as their values are completely determined by the state vector; they perform a control function. A transition is generated in two phases. The first, customer departure, is accomplished by decrementing one of the non-zero components of the state vector, and since this frees up servers, we increment #AVL accordingly. The second, customer entry from the queue, is accomplished by a recursive procedure outlined below:
procedure recur
while (choice of classes remains for new customer) consider smallest class not yet tried (SCNYT)
if (servers are available and quota not filled) then "enter" one customer of SCNYT
call recur else
current configuration is an accessible state; "recordll it IIreturn" latest customer entered
return return
The state vector, HAVL, and SCW are passed to the procedure as parameters. (SCW is the initial value of SCNYT.) The activity of lIent er i ng" a customer consists
of incrementing the appropriate component of the state vector, incrementing SCNYT, and decreasing #AVL by the correct amount. The activity of IIr et ur ni ngll a custqrner
consists of decrementing the appropriate component of the state vector, setting SCNYT to one, and increasing HAVL by the correct amount.
The computation of the rate associated with the transition is performed concurrently and accumulated in a separate parameter (RATE). In phase one RATE is initialized as the product of the service rate of the departing class and the number of that class currently in service. In phase two RATE is multiplied by the (perhaps
condi"tional) probability associated with each customer who "enters." The transition is "recorded" by using the translation algorithm to convert the (new) state vector description into the matrix column number where RATE is to be placed.
We sketch the procedure for generating the matrix in terms of the algorithms which we have discussed.
For a given set of system parameters (# customers, # servers, Hclasses, etc.)
the enumeration algorithm generates the vector description of each state (matrix row) which is possible.
For each of these possible states the transition algorithm generates the vector description of every accessible state together with the associated transition rate.
5. Numerical Solution Techniques
The transition rate matrices that are generated by this application are typically extremely sparse and it is important to take advantage of this fact so that no unnecessary computation is performed. In addition, it may also be possible to take advantage of the non-zero structure of the matrix, i.e. the regular position of the non-zero elements within the matrix if such a structue indeed exists. Such a structure is often critical to determining the numerical method of choice to apply to the matrix.
(7,7) (6,6) (6,7) (5,5) (5,6) (5,7) (4,4) (4,5) (4,6) (4,7) (3,3) (3,4) (3,5) (3,6) (3,7) (2,2) (2,3) (2,4) (2,5) (2,6) (2,7)
( 1, 1) ( 1,2) ( 1,3) ( 1,4) ( 1,5) ( 1,6) ( 1,7)
* *
'\.* *
-, * * "'e*
*"*
*
**
'\.:,,*
* *"Ie *
* *
*
«.*
**
7r
* *
*
"**
* *
**
* *
*'*
'\.*
*
**
* *
* **
** * *
*,* **
*
*,*
**
*-, **
* **
**
* * *
* *
**
*
*
**
*
* *
'*
**
*
**
** *
* **
*
*
* *
*
* **'*
,*
*
* *
*
*
**
*
-,
*
*
* *
** *
'* *
**
*
* *
**
* ** *
*'*
* *
** *
*
*
**
** *
**
* **
* *'* * * * * * *
-,* *
*
*
* **
*
**
* * *
** * *
* * * *--- * **
* * * * **
"*
-, **
*
* **
*
* *"* * *
* *
*"
* *
* *
"*
*
*
*
* *
*
*
*
* **'* *
*"* * "* * *
*
* ** *
* * * * **
*
**
'*
*
*
* "* * * "* **
**
** * * * * * **
*
*
* **
* **
-,*Figure 3: The non-zero structure of the rate matrix of the queueing system when N
=
M=
7, customers may be class ;, i=
1,2, ... ,7, li.=
0.25 for i=
1,2, ... ,7,Pi
=
.2 for i=
1,2,3 and1pj=
.1 for i=
4,5,6,7.would yield the most satisfactory structure. One ordering in particular was found that yielded a structure which has many advantages. An example of this ordering and the corresponding non-zero structure of the matrix is given in figure 3. The structure here is so regular that it is easy to devise a sparse storage scheme which minimizes the amount of storage needed. Normally, sparse storage schemes require both a real array to store the actual matrix elements and at least one integer array to keep the position of these elements is the matrix. The absolute regularity of the above matrix makes such integer array unnecessary.
In addition the structure of the matrix suggests that a block iteration method of solution might be appropriate. In particular the predominance of mass on the lower triangular section of the matrix indicates that a block Gauss-Seidel method might be most suitable and this is the method that was adopted. In the implementation of the block Gauss-Seidel method advantage was taken of the triangular structure of the diagonal blocks to minimize the number of operations involved in computing their LU decompostions. This decomposition is necessary only before the first iteration. The remaining non-zero elements of the matrix are involved in multiplication with a vector and consequently were stored in a form suitable for such a multiplication. As a result, each iteration involved very little computation and the overall numerical solution procedure constituted only a small fraction of the total processing time with the method. As has already been indicated, most of the time was absorbed by the matrix generator procedure.
When only a small subset of the possible job classes is permitted, the previous symmetr"ic structure of the matrix disappears. Also, the number of states is greatly reduced so that it becomes feasible to adopt the exact approach. Since the matrix has no inherent structure, it was decided to adopt a simple point Gauss-Siedel solution approach. A straight-forward compact storage scheme was adopted; one in which the non-zero elements were stored consecutively by rows in an one dimensional real array and an integer array used to indicate the location of these elements in their perspec-tive rows. The ordering was chosen to make multiplication with a vector ( the only operation necessary in the point Gauss-Seidal method) convenient.
Results
customers were considered, namely class 1 and class 4. A class 1 customer required one server, whereas a class 4 customer required four servers. (In a circuit-switching environment, a class 1 customer can be associated with a phone-call, whereas a class 4 customer can be associated with image transmission.) The remaining parameters of the system were varied in order to obtain the results shown in the figures below. These parameters are: a) N, the fixed number of customers in the system; b) the vector (P1' P4) indicating the probability of a customer being class 1 or class 4,
(P1 + P4 = 1); and c) the vector (~1' ~4) of the service rate of customers of class 1 and 4 respectively.
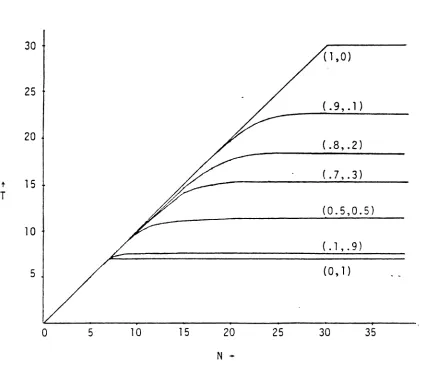
The principal measure of performance obtained was the throughput of the system. This is defined as the average number of service completions per unit time. The expected number of busy servers and the mean queue length were also obtained. Figures 4 and 5 were obtained assuming that ~i = 1, i = 1,4, whereas the remaining figures were obtained assuming that ~1 # ~4·
Figure 4 gives the throughput of the system as a function of the fixed number of customers in the system. The plots were obtained for various values of (Pl,P4). The two trivial cases (1,0) and (0,1) were also included as they can be easily
interpreted intuitively. These two trivial cases correspond to the system containing either all class 1 customers or all class 4 customers. We note that in view of
the fact that ~. = 1, i = 1,4, the throughput of the system is equal to the expected
1
number of customers in service. Now, in the case where all customers are class 1, the expected number of custome~in service is simply N, if N~ 30. It then levels off to 30 for values of N~ 30. In the case where all customers are class 4, the maximum number of customers that can be in service is 7. Therefore, the throughput
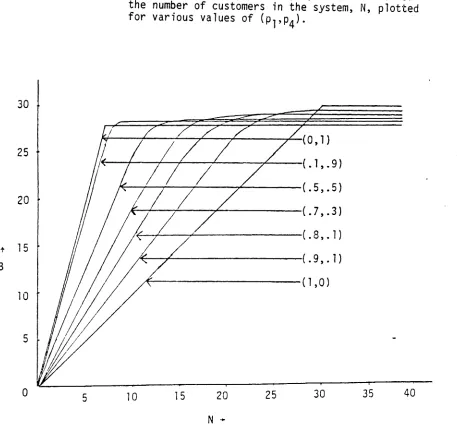
is equal to N for values of N~ 7, and it attains its maximum value for N> 7. Figure 5 gives the mean number of busy servers of the system in a manner similar to that of figure 4.
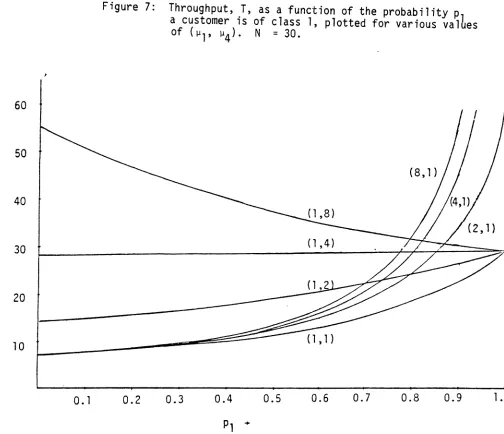
Figure 6 gives the throughput of the system as a function of the number of customers in the system for various values of the service rates (~1' ~4)· The vector (Pl,P2) was taken to be equal to (0.7,0.3). We note that the throughput is increased if ~ 1 orp 4
is increased. Furthermore, higher gains in throughput are obtained if~ 4 was
slightly re-arranged.
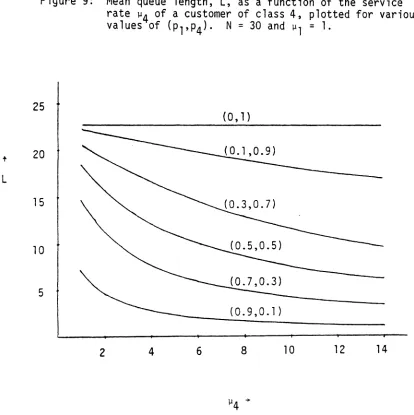
Finally, figure 9 gives the mean queue length as a function of ~ 4 for various values of (Pl,P4)' The results given in this figure, reflect the maximum mean queue length
in a circuit-switching environment with a finite population of customers. Specifi-cally, the results reflect the mean queue-length when the customers spend zero time
in think state.
As it was mentioned above, figures 4 to 9 were obtained assuming two classes of customers and a service mechanism of 30 servers. More complicated configurations requlrlng more than two classes of customers and a larger number of servers can be easily analyzed using the exact numerical procedure described above. Time complexity
Figure 4: Throughput, T, as a function of the number of customers in the system, N, plotted for various
values of (Pl,P4).
30
( 1,0)
25
(.9,.1)
20
(.8'02)
15 (.7,.3)
t
T
(0.5,0.5)
10
(.1,.9)
5 (0,1)
o
5 10 15 20N+
Figure 5: Mean number of busy servers, B, as a function of the number of customers in the system, N, plotted for various values of (Pl,P4)'
40
35
30 25
20
15 10
5 5
o
30
(0,1) 25
(.1,.9)
(.5,.5) 20
(.7,.3)
(.8,.1)
t 15
(.9,.1)
B
( 1,0)
10
Figure 6: Throughput, T, as a function of the number of customers in the system, N, plotted for various values of (~1'~4). The probabilities (Pl,P4) =
(0.7,0.3).
35
30
25 20
15 10
5
o
5
( 1 ,8)
30
( 1 ,4)
25
t"{8,l)
~ 1 2
t 20
(4, 1 )
T (2, 1 )
(1 , 1 )
10
60
Figure 7: Throughput, T, as a function of the probability p a customer is of class 1, plotted for various valLes
of (Ill' 114). N
=
30.50
t 40
T
30
20
10
19
Figure 8: Throughput, T, as a function of the service rate ~4 of a customer of class 4, plotted for various values of (Pl,P4). N
=
30 and ~l=
1.50 60
10
t 40
T (0.7,0.3)
30 (0.9,0.1 )
t(1 .0)
20
Figure 9: Mean queue length, L, as a function of the service rate ~4 of a customer of class 4, plotted for various values of (Pl,P4). N= 30 and ~1 = 1.
25
(0,1)
t
L
20
15
10
5
2 4 6
(0.9,0.1 )
References
1. Arthurs, E., and Kaufman, J.S, IISizing a message store subject to blocking criteria", in Performance of Computer Systems, M. Arata, A Butrimenko, and E. Gelenbe, (Eds), Amsterdam, The Netherlands, North Holland, (1979) 547-564. 2. Brill, P.H., and Green, L., "Queues inwhich customers receive simultaneous
service from a random number of servers - a system point approach", unpublished manuscript.
3. Brill, P.H., "An embedded level crossing technique for dams and queuesll ,
J. of App1. Prob., 16 (1979) 174-186.
4. Gopa1, I. S. and Stern, T.E., "Optimal call blocking policies in an integrated services environment", IBM Research Report RC 9825.
5. Green, L., IIA queueing system in which customers require a random number of servers", Opere Res., Vol. 28 (1980) 1335-1346.
6. Green, L., IIComparing operating characteristics of queues in which customers require a random number of servers", Mgmt. Sci., Vol. 27 (1981) 65-74.
7. Kaufman, J., IIBlocking in a shared resource environmentU
, IEEE Trans. Comm., Com-29 (1981) 1474-1481.
8. Kim, S., IIM/M/s queueing system where custorners demand multiple server usell, Ph.D dissertation, Southern Methodist Univ., (1979).