ABSTRACT
SHARMA, PRIYESH. Breakup of Liquid Jets and Spray Characteristics of Diesel Fuel from Non - Circular Orifices. (Under the direction of Dr. Tiegang Fang).
In view of the stringent emission regulations and depleting fossil resources,
improving the combustion efficiency and lowering the exhaust emissions of internal
combustion engines is monumental. Spray combustion is primarily governed by the fuel
atomization process. High injection pressures and small nozzle orifice diameters are
employed to achieve fine atomization and better air fuel mixing in the engines. However,
increasing injection pressures imposes greater loads on the fuel injection systems and
requires precise manufacturing, thus, is a costly affair.
In an attempt of seeking techniques for improving the fuel atomization process, we
have tested the spray characteristics obtained from non - circular orifices. For a better
understanding of the underlying processes, analysis was carried out on low pressure water
jets as well as high pressure diesel sprays obtained from rectangular, square and triangular
geometries and compared with the corresponding jets and sprays obtained from circular
orifices of similar cross sectional areas. The low pressure analysis was carried out for gauge
pressures varying from 0 psi to 1000 psi while the high pressure analysis used a common rail
diesel injection system discharging the fuel at pressures from 300 to 1000 bars.
To draw a comparison between the circular and non - circular jets and sprays,
penetration, velocity and acceleration and volume have been measured. The measurements
were made by processing the digital images obtained using a high speed video camera. A
laser diffraction particle analyzing system from Malvern was used to measure the droplet size
obtained from the sprays of different geometries. The measurements were carried out at
different axial locations along the spray axis.
The jets and sprays were discharged into the ambient gas at room temperature and
pressure conditions. While for the images captured by the high speed camera the liquids were
injected in the vertical direction, for the droplet size measurements diesel fuel was sprayed in
the horizontal direction. The flow characteristics were analyzed from different directions,
including looking at the flow from the straight edges of the orifices as well as their sharp
corners.
The non - circular geometric jets and sprays demonstrated enhanced instability as
compared to the circular jets and sprays. This has been attributed to the axis switching
phenomenon exhibited by them. Due to axis switching the non - circular jets and sprays
change their spatial orientation periodically along the axial direction and also acquire circular
cross sections during the process. As a result, the non - circular jets yielded shorter breakup
lengths as compared to the circular jets. In order to demonstrate the presence of axis
switching phenomenon in square and triangular jets and high pressure diesel sprays, the jet
and spray widths were plotted along the axial direction. This technique proved very useful
High pressure diesel sprays obtained from non – circular orifices exhibited larger
widths and hence, larger surface areas, greater cone angles, better penetration and hence,
larger spray volumes than the circular sprays. In short, non - circular geometric shapes
achieved better air entrainment and hence, mixing than the circular sprays. The droplet size
obtained depends on the location of measurement and injection pressure and different
behaviors are observed at different locations.
Thus, it was observed that the non – circular orifice geometry induces greater
instabilities in the jets and the sprays thereby leading to their faster disintegration. As a
result, an improvement in the spray characteristics can be achieved using the non - circular
geometries. Axis switching phenomenon plays a key role in improving the spray
characteristics. To conclude, the non – circular geometry provides a cost effective technique
© Copyright 2013 Priyesh Sharma
Breakup of Liquid Jets and Spray Characteristics of Diesel Fuel from Non - Circular Orifices
by Priyesh Sharma
A thesis submitted to the Graduate Faculty of North Carolina State University
in partial fulfillment of the requirements for the degree of
Master of Science
Mechanical Engineering
Raleigh, North Carolina
2013
APPROVED BY:
_______________________________ Dr. Tiegang Fang
Committee Chair
DEDICATION
BIOGRAPHY
Priyesh Sharma was born on October 21, 1986 in the holy city of Ajmer, Rajasthan; in north
western India. He completed his schooling from Mayoor School, Ajmer. Seeking a holistic
development as an engineer he joined BS in Marine Engineering program of Birla Institute of
Technology & Science, Pilani, Rajasthan. The interdisciplinary curriculum of Marine
Engineering and work experience in Chevron Shipping gave him the opportunity of gaining
hands-on experience of working on marine diesel engines. Pursuing his interests in the field
of internal combustion engines he went on to join the North Carolina State University,
Raleigh in Fall 2011. In the Department of Mechanical & Aerospace Engineering, he joined
the research group of Dr. Tiegang Fang. His research work mainly focused on the spray
characteristics of diesel fuel and high pressure fuel injection systems. He finished his Masters
in December, 2012 with the intention of making positive contributions in the field of internal
ACKNOWLEDGMENTS
I owe my profound gratitude to Dr. Tiegang Fang for giving me the opportunity of joining
his research group. I gladly appreciate his support, encouragement and patience. Without his
inspiration and guidance, this work would have not been possible. I consider myself very
fortunate to get the opportunity of working under him.
I would also like to express my gratitude to Dr. William Roberts and Dr. Alexei Saveliev for
taking out time from their schedule to be a part of my thesis committee.
I am thankful for the support I received from Ms. Annie Erwin. Special thanks to Mr. Rufus
Richardson (Skip) for providing the technical support and finishing all the machine shop
requests within short periods of time even when given on short notices.
Thanks to Wei Jing, J R Archer, Dolanimi Ogunkoya, Sandesh Saokar and Suman Basu for
their immense support. Wei and J R provided unconditional help despite of their busy
schedules. Best regards to Amruth Kiran Hegde and Pravin Dandin for their friendly support
during the research work.
All this would have not been possible without the love, support and motivation I received
from my family. I wish to live up to their expectations.
This research was supported in part by the Research and Innovation Seed Funding (RISF)
program from the North Carolina State University and by the Natural Science Foundation
TABLE OF CONTENTS
LIST OF TABLES ... vi
LIST OF FIGURES ... vii
CHAPTER 1: INTRODUCTION ...1
CHAPTER 2: LITERATURE REVIEW ...5
Circular orifice ...5
Non – circular orifices ...16
Summary ...26
CHAPTER 3: EXPERIMENTAL SETUP AND PROCEDURE ...28
Low Pressure System ...28
High Pressure System ...36
CHAPTER 4: RESULTS AND DISCUSSION ...46
Low Pressure Analysis ...46
High Pressure Analysis ...90
CHAPTER 5: CONCLUSIONS ...163
CHAPTER 6: FUTURE WORK ...169
LIST OF TABLES
Table 3-1 Geometrical details of the orifices (in m) ...31
Table 3-2 Physical properties...34
Table 3-3 Reynolds Number for different flow conditions ...34
Table 3-4 Liquid Weber Number for different flow conditions ...34
Table 3-5 Gas Weber Number for different flow conditions ...35
Table 3-6 Geometrical details of the orifices (in m) ...37
LIST OF FIGURES
Figure 2-1 Pictorial representation of the Rayleigh breakup mechanism. Source: Lefebvre [31]. ... 7
Figure 2-2 Jet breakup length, Lb, as a function of jet velocity. Source: Reitz and Bracco [23]. ... 9
Figure 2-3 Schematic representation of the jet breakup length, Lb, jet intact – core length, Lc and the intact – surface length, Ls. Λ is the wavelength of the induced surface perturbations. Source: Lin and Reitz [25] ... 11
Figure 2-4 Relaxation of Laminar velocity profile as suggested by [23, 30]. ... 12
Figure 2-5 Real life examples. (a) Rayleigh breakup. (b) First – wind induced regime. (c) Second – wind induced regime. (d) Atomization regime. ... 14
Figure 3-1 Details of the orifice assembly. ... 29
Figure 3-2 Low Pressure Water Injection System. ... 30
Figure 3-3a Circular orifice. Dia: 295μm ... 32
Figure 3-4 Schematic representation of the high pressure common rail fuel injection system ... 37
Figure 3-5 Details of the circular orifice. Dia.: 0.165mm ... 38
Figure 3-6 Details of the circular orifice. Sides: 0.205 x 0.104 mm. ... 38
Figure 3-7 Details of the circular orifice. Sides: 0.142 x 0.146 mm. ... 38
Figure 3-8 Details of the circular orifice. Sides: 0.171 x 0.161 x 0.169 mm. ... 39
Figure 3-9 – LabVIEW PID loop interface and block diagram. ... 39
Figure 3-10 Pressure regulator circuit. ... 40
Figure 3-11 (a) Injector driver circuit. ... 41
Figure 3-12 Examples of detected signals. ... 42
Figure 4-1 Variation of the steady state mass flow rate for the low pressure jets under different flow conditions. ... 46 Figure 4-2 Variation of the exit velocity for the low pressure jets under different flow conditions. ... 47 Figure 4-3 Variation of the Reynolds number for the low pressure jets under different flow
conditions. ... 49 Figure 4-4. Magnified view of the variation of the Reynolds number in the lower range of injection pressures. ... 50 Figure 4-5 Variation of the WeL for the low pressure jets under different flow conditions. ... 51
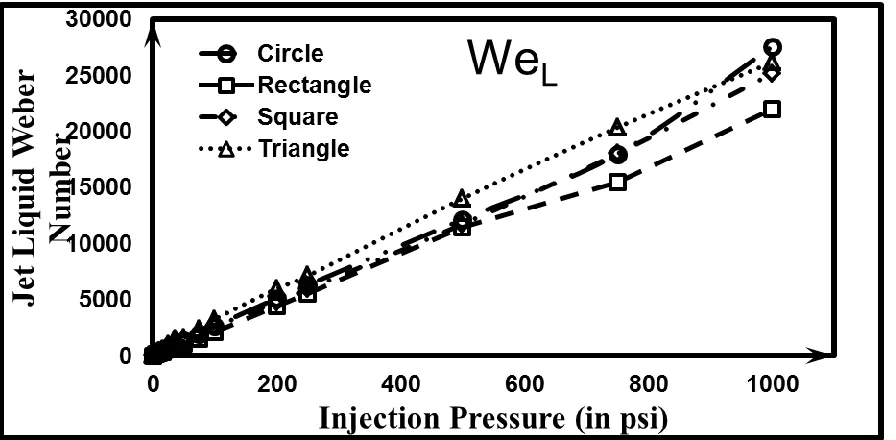
Figure 4-6 Variation of the WeG for the low pressure jets under different flow conditions. ... 51
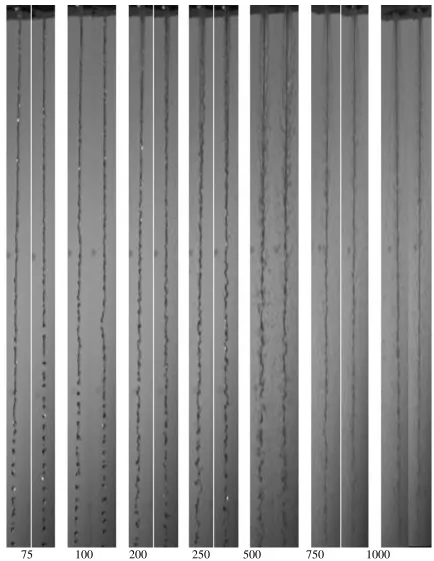
Figure 4-7. Evolution of the low pressure circular jets under different flow conditions. Black bars locate instantaneous breakup points. The relative location of the black bars gives a sense of trend of the changes in the breakup lengths with increase in injection pressure. Numbers below the images indicate the injection pressure in psi. ... 53 Figure 4-8 Evolution of the low pressure rectangular jets under different flow conditions. ... 55 Figure 4-9 Evolution of the low pressure rectangular jets under different flow conditions. Rest details are same as Figure 4-8. ... 56 Figure 4-10 Details of the visible widths from different view planes of the square and the triangular orifices. ... 61 Figure 4-11 Evolution of the low pressure square jets under different flow conditions. Images are in groups of 3. The first image belongs to the ‘SF’ view, the second image belongs to the ‘SS’ view and the last image belongs to the ‘SV’ view. Numbers indicate the injection pressures in psi. ... 64
Figure 4-13 . Evolution of the low pressure square jets under different flow conditions. Rest details
are the same as Figure 4 -11. ... 66
Figure 4-14 Evolution of the low pressure triangular jets under different flow conditions. Images are in pairs. The first image belongs to the ‘TS’ view and the second image belongs to the ‘TV’ view. Numbers indicate the injection pressures in psi. ... 69
Figure 4-15 Evolution of the low pressure triangular jets under different flow conditions. Rest details are the same as in Figure 4-14. ... 70
Figure 4-16 Demonstration of the procedure of jet breakup length Lb measurement using MATLAB. (a) Circle, (b) RL, (c) SF, (d) TS jets at 10 psi injection pressure. ... 71
Figure 4-17 Variation of the non – dimensionalized breakup length with for the liquid jets emanating from circular and non – circular orifices. ... 73
Figure 4-18 Magnified view of the variation of the non-dimensionalized breakup length at low conditions. Error bars are not included. ... 74
Figure 4-19 Variation of non-dimensionalized jet width in different view planes at 0 psi. ... 76
Figure 4-20 Variation of non-dimensionalized jet width in different view planes at 15 psi. ... 77
Figure 4-21 Variation of non-dimensionalized jet width in different view planes at 50 psi. ... 77
Figure 4-22 Variation of non-dimensionalized jet width in different view planes at 250 psi. Error bars are not included. ... 78
Figure 4-23 Variation of non-dimensionalized jet width in different view planes at 0 psi. Error bars are not included. ... 79
Figure 4-37 Variation of non-dimensionalized jet width in different view planes at 250 psi. Error bars are not included. ... 86 Figure 4-38 Variation of droplet size under different flow conditions of the low pressure jets ... 89 4-39 Development of spray injected at 1000 bars from circular orifice with time. Image frame
Figure 4-84 Variation of spray cone angle in different view planes at 80 mm for 400 bars. Errors not
included. ... 125
Figure 4-85 Variation of spray cone angle in different view planes at 80 mm for 500 bars. Errors not included. ... 125
Figure 4-86 Variation of spray cone angle in different view planes at 80 mm for 600 bars. Errors not included. ... 126
Figure 4-87 Variation of spray cone angle in different view planes at 80 mm for 700 bars. Errors not included. ... 126
Figure 4-88 Variation of spray cone angle in different view planes at 80 mm for 800 bars. Errors not included. ... 127
Figure 4-89 Variation of spray cone angle in different view planes at 80 mm for 900 bars. Errors not included. ... 127
Figure 4-90 Variation of spray cone angle in different view planes at 80 mm for 1000 bars. Errors not included. ... 128
Figure 4-91 Variation of spray cone angle in different view planes with injection pressure at 20 mm. ... 129
Figure 4-92 Variation of spray cone angle in different view planes with injection pressure at 80 mm. ... 129
Figure 4-93 Comparison of spray cone angle from different orifices at 20 mm ... 130
Figure 4-94 Comparison of spray cone angle from different orifices at 80 mm ... 130
Figure 4-95 Comparison of spray tip penetration obtained from different orifices at 300 bars. ... 132
Figure 4-96 Comparison of spray tip velocity obtained from different orifices at 300 bars. ... 133
Figure 4-98 Comparison of spray tip penetration obtained from different orifices at 400 bars. ... 134
Figure 4-99 Comparison of spray tip velocity obtained from different orifices at 400 bars. ... 135
Figure 4-100 Comparison of spray tip acceleration obtained from different orifices at 400 bars. ... 135
Figure 4-101 Comparison of spray tip penetration obtained from different orifices at 500 bars. ... 136
Figure 4-102 Comparison of spray tip velocity obtained from different orifices at 500 bars. ... 136
Figure 4-103 Comparison of spray tip acceleration obtained from different orifices at 500 bars. ... 137
Figure 4-104 Comparison of spray tip penetration obtained from different orifices at 600 bars. ... 137
Figure 4-105 Comparison of spray tip velocity obtained from different orifices at 600 bars. ... 138
Figure 4-106 Comparison of spray tip acceleration obtained from different orifices at 600 bars. ... 138
Figure 4-107 Comparison of spray tip penetration obtained from different orifices at 700 bars. ... 139
Figure 4-108 Comparison of spray tip velocity obtained from different orifices at 700 bars. ... 139
Figure 4-109 Comparison of spray tip acceleration obtained from different orifices at 700 bars. ... 140
Figure 4-110 Comparison of spray tip penetration obtained from different orifices at 800 bars. ... 140
Figure 4-111 Comparison of spray tip velocity obtained from different orifices at 800 bars. ... 141
Figure 4-112 Comparison of spray tip acceleration obtained from different orifices at 800 bars. ... 141
Figure 4-113 Comparison of spray tip penetration obtained from different orifices at 900 bars. ... 142
Figure 4-114 Comparison of spray tip velocity obtained from different orifices at 900 bars. ... 142
Figure 4-115 Comparison of spray tip acceleration obtained from different orifices at 900 bars. ... 143
Figure 4-116 Comparison of spray tip penetration obtained from different orifices at 1000 bars. .... 143
Figure 4-117 Comparison of spray tip velocity obtained from different orifices at 1000 bars. ... 144
Figure 4-118 Comparison of spray tip acceleration obtained from different orifices at 1000 bars. ... 144
Figure 4-121 Comparison of spray volume obtained in different view planes at 800 bars. ... 147
Figure 4-122 Comparison of spray volume obtained in different view planes at 1000 bars. ... 147
Figure 4-123 Comparison of spray volume obtained from different orifices at 300 bars. ... 149
Figure 4-124 Comparison of spray volume obtained from different orifices at 400 bars. ... 150
Figure 4-125 Comparison of spray volume obtained from different orifices at 500 bars. ... 150
Figure 4-126 Comparison of spray volume obtained from different orifices at 600 bars. ... 151
Figure 4-127 Comparison of spray volume obtained from different orifices at 700 bars. ... 151
Figure 4-128 Comparison of spray volume obtained from different orifices at 800 bars. ... 152
Figure 4-129 Comparison of spray volume obtained from different orifices at 900 bars. ... 152
Figure 4-130 Comparison of spray volume obtained from different orifices at 1000 bars. ... 153
Figure 4-131 Variation of non – dimensionalized droplet size with injection pressure for circular sprays. ... 156
Figure 4-132 Variation of non – dimensionalized droplet size with injection pressure in RL view. . 156 Figure 4-133 Variation of non – dimensionalized droplet size with injection pressure in RS view. . 157 Figure 4-134 Variation of non – dimensionalized droplet size with injection pressure in RV view. . 157 Figure 4-135 Variation of non – dimensionalized droplet size with injection pressure in SF view. .. 158
Figure 4-136 Variation of non – dimensionalized droplet size with injection pressure in SS view. .. 158
Figure 4-137 Variation of non – dimensionalized droplet size with injection pressure in SV view. . 159 Figure 4-138 Variation of non – dimensionalized droplet size with injection pressure in TS view... 159
CHAPTER 1: INTRODUCTION
The essence of a diesel engine is the introduction of finely atomized fuel into the air
compressed in the cylinder during the compression stroke. Fuel atomization plays an
important role as reduction in mean fuel drop size increases volumetric heat release rates,
lowers exhaust concentrations of pollutant emissions [1-3] and determines the combustion
efficiency, power output and fuel economy of an internal combustion engine. For the
complete combustion of the fuel at the correct time it is necessary that it breaks down into
tiny droplets for better heat transfer and rapid evaporation. These tiny droplets should also be
able to penetrate deep enough in the combustion chamber in order to ensure proper mixing
with air / oxygen. Primarily, most engines use high pressure fuel injection with small orifices
for achieving better atomization and reducing NOx and particulate emissions [6]. Some
recent engine designs achieve as much as 2300 bar injection pressure when pumping inferior
quality fuels like heavy fuel oil. Various other techniques like air blast injection, using
compressed air for fuel atomization, were used earlier but they had their own limitations.
With the development of materials capable of withstanding greater pressure and fatigue loads
safely, direct injection (DI) has emerged as the dominant principle in modern medium and
high speed engines. In (DI) engines, fuel atomization and air / fuel mixing are achieved by
the energy in the fuel spray injected at very high pressure. Additional mixing may be
achieved by the orderly movement of the air in the combustion chamber, which is called ‘air
swirl’. Naturally aspirated engines usually have a degree of swirl and an injection pressure of
virtually no swirl, and have to employ injection pressures of 1200–1800 bars to provide the
mixing energy [4].
Further improvements in fuel atomization cannot be achieved by increasing injection
pressures and reducing orifice size only. Higher pressures impose limitations on the safe
working loads of the engine fuel injection system and precise manufacturing thereby
increasing the equipment cost. Further, smaller orifices are difficult to manufacture and are
prone to blockage. This calls for looking at the basics of the atomization process.
Atomization is one of the different modes of the liquid jet breakup. The breakup of a liquid
jet emanating from an orifice is an ubiquitous phenomenon of nature with its application
related not only to spray and droplet formation in combustion engines but also in fields of
medical aerosols, low pressure plasma deposition, modified gas welding techniques, high
velocity oxy-fuel thermal spraying to name a few [31].
Liquid jet breakup is not a simple process and is influenced by a large number of parameters
including the details of the design of the nozzle, the jet’s velocity and turbulence, and the
physical and thermal states of both liquid and surrounding gas [16 - 18]. As jets are
discharged from an orifice they are subjected to a destabilization process which causes the
breakup of the jet. The destabilization process may originate from the disturbance waves on
the jet surface, initiated within the nozzle due to its geometry and / or cavitation or at the
orifice exit owing to inertia and aerodynamic forces. Two major features to characterize the
destabilization process are the breakup length of the jet, which is defined as the length of the
jet from the nozzle tip to first drop break up, and the droplet size. These two parameters
concentrated majorly on circular orifices though there has been interest in studying the effect
of asymmetric orifices since the nineteenth century. Rayleigh [5] analyzed the experimental
works of Bidone [6] and reported the axis – switching phenomenon observed in jets issued
from non - circular orifices. Due to this phenomenon, liquid jets issued from elliptical
orifices lose their ellipticity at increasing distances from the orifice and further out the
ellipticity is regained but the orientation of major and minor axes is switched by right angles.
The phenomenon is periodic along the jet axis. The unique behavior of jets issued from
non-circular orifices introduces further hydrodynamic instabilities which significantly influence
the jet breakup. Results of the investigations on jets issued from non - circular orifices show
that non - circular geometry of the orifice tends to provide an efficient technique of passive
flow control at a relatively cheaper cost as it involves changes in the geometry of the nozzle
only.
This work experimentally investigates the effect of asymmetric nozzle geometry on the
breakup phenomenon of water jets issued at pressures as low as a few psi and spray
characteristics of Diesel fuel at pressures as high as 1000 bars. It mainly focuses on the
asymmetric geometries with corners – rectangle, square and triangle. The rectangular orifice
also has aspect ratio effects similar to an elliptical orifice. Owing to difficulty in the
manufacturing process and costs involved elliptical orifice could not be covered in this work.
The experiments were conducted in two stages. Firstly, the breakup and axis – switching
phenomena have been studied for water jets emanating at low pressures from 0 to 1000 psi
from non – circular orifices like rectangle, square and triangle and compared with the results
to fall freely under the effect of gravity and hydrostatic pressure of the liquid column and no
external pressure were applied. In the second stage, a high pressure common rail diesel
injection setup was prepared to inject diesel fuel from a single-hole nozzle at pressures
ranging from 300 – 1000 bars. The nozzles used had non – circular geometry (rectangular,
square and triangular) and the results were compared with the spray characteristics of a
circular orifice. In each stage, the jets and the sprays were discharged into quiescent air
background. Care was taken to ensure that the non - circular orifices had the cross sectional
CHAPTER 2: LITERATURE REVIEW Circular orifice
Disintegration of liquid jets
The earliest investigations of the breakup of a liquid jet emanating into another fluid dates
back more than a century. In 1829, Bidone [7] studied the geometric forms of jets produced
by nozzles with non - circular orifices while Savart, 1833 [8], was the first to quantitatively
describe the jet disintegration process. He suggested that if the jet diameter is kept constant,
the breakup length is directly proportional to the jet exit velocity and for constant jet
velocity; the jet length is directly proportional to the orifice diameter. Plateau [9]
demonstrated that the surface energy of a uniform circular cylindrical jet is not the minimum
attainable for a given jet volume. He suggested that the jet tends to break into segments of
equal length, each of which is 2π times longer than the jet radius, such that the spherical
drops formed from these segments give the minimum surface energy if a drop is formed from
each segment. By neglecting the effects of ambient gas density, jet liquid viscosity and the
gravitational forces, Rayleigh [10] demonstrated that a cylindrical laminar jet issued in still
air is unstable with respect to the disturbances of wavelengths larger than the jet
circumference. He calculated the potential energy of the disturbed configuration relative to
the equilibrium value as
(2.1)
where, Es = potential surface energy
bn = constant in Fourier series expansion
γ = dimensionless wave number = 2 /λ
λ = wavelength of disturbance
n = any positive number including zero.
For non symmetrical disturbances, n>>1 and Es is always positive, indicating that the system
is always stable to this class of disturbance. When n = 0 and γ < 1, which is the case for
symmetrical disturbances, shows that the Es is negative and the system is unstable to this
class of disturbance. Hence, a liquid jet that is affected by surface tension forces only will
become unstable to any axisymmetrical disturbance whose wavelength satisfies the
inequality
(2.2)
which corresponds to
(2.3)
Thus, according to Rayleigh, for non viscous liquid jets under laminar flow conditions all
disturbances on the jets with wavelengths greater than its circumference will grow. Among
all unstable disturbances, the jet is most susceptible to disturbances with wavelengths 143.7%
of its circumference or,
(2.4)
where, is the optimal wavelength corresponding to the exponential growth rate of fastest
growing disturbance.
(2.5)
and hence,
(2.6)
Thus, for Rayleigh mechanism of break up the average drop size is nearly twice the diameter
of the undisturbed jet. Figure 2.1shows an example of Rayleigh jet breakup mechanism.
Figure 2-1 Pictorial representation of the Rayleigh breakup mechanism. Source: Lefebvre [31].
These predictions of Raleigh’s mathematical analysis were later confirmed by Tyler [11] who
experimentally showed the following results:
(2.7)
(2.8)
He, thus, concluded that the cylindrical jets break up under the condition required for
maximum instability, as predicted by Rayleigh’s theory. Weber [12] extended the works of
Rayleigh to viscous liquids and also included the effects of ambient gas density. But, his
theoretical predictions did not agree well with the experimental data as pointed out by
Sterling & Sleicher [13]. Chandrasekhar [14] showed mathematically that the minimum
wavelength for jet breakup is same for both viscous and non-viscous liquids, but the
optimum wavelength is greater for viscous liquids and that the effect of relative air velocity
is to reduce the optimum wavelength for jet break up. He also showed that the physical
mechanism of the breakup of a viscous liquid jet in a vacuum is capillary pinching. Taylor
[15] also emphasized on the importance of ambient gas density on the form of jet breakup.
For cases, where the ambient gas inertia force, which is directly proportional to the ambient
gas density, is very large as compared to the surface tension force per unit of interfacial
surface area, the jet disintegrates at the liquid-gas interface into droplets with diameters much
smaller than its own diameter. This mode of breakup refers to atomization where the jet
breaks into a fine spray.
Breakup regimes
After rigorous experimental investigations and the qualitative descriptions obtained from the
linear stability theory, the disintegration of a liquid jet can now be classified into distinct
regimes of breakup. The different regimes are characterized by the appearance of the jet
depending upon the operating conditions. The regimes are due to the action of dominant
forces on the jet, leading to its breakup, and it is important that these forces be identified in
emanated in stagnant gas undergoes four different breakup regimes depending on the
interaction of the liquid inertia, surface tension, and aerodynamic forces acting on the jet.
The different regimes of jet breakup can be schematically shown on a plot of varying
breakup length of the jet as a function of jet velocity, keeping all other parameters constant as
reviewed by Grant and Middleman [20]. This is shown in Figure 2.2.
Figure Error! No text of specified style in document.-2 Jet breakup length, Lb, as a function of jet velocity. Source:
Reitz and Bracco [23].
In order to form a jet, the liquid must have sufficient momentum else it is discharged in the
form of dripping drops. Once the initial momentum is gained (point C), the jet breakup
length increases linearly with the jet velocity. This linear variation (CD) of the breakup
length with jet velocity corresponds to the Rayleigh jet breakup mechanism. This is caused
diameters exceed the jet diameter as predicted by Rayleigh. Thereafter, the curve reaches a
peak (point E) and then decreases. This regime is termed as the first – wind induced regime.
Here, the surface tension effect is augmented by the relative velocity between the jet and the
ambient gas, which produces a static pressure distribution across the jet, thereby accelerating
the break up process. Similar to Regime 1, the breakup takes place many jet diameters
downstream of the nozzle. The drops are pinched off from the jet and their sizes are
comparable to the jet diameter [21]. For higher jet velocities, the nature of the breakup curve
remains controversial. According to Haenlein [22], the breakup curve remains constant or
decreases slightly with increasing velocity (FG) and then it abruptly reduces to near zero.
However, as per the works of McCarthy and Malloy [32] and Grant and Middleman [20] the
breakup length initially increases (FH). These two behaviors of the breakup curve indicate
existence of two distinct regimes in the jet breakup. As per Reitz and Bracco [23], at
sufficiently high jet velocities, jet surface disruption occurs prior to the jet core. Hence, they
have defined, two different breakup lengths, the intact – surface length and the intact – core
length, to clearly demarcate the two phenomena. In Rayleigh and first wind-induced regimes,
the jet breaks up simultaneously over the entire cross section and hence, the two lengths
coincide. The high jet velocity regime, where the jet disruption initiates at the surface and
eventually reaches the core the intact – surface length is different from the intact – core
length. This regime is called the second wind-induced regime. Owing to high relative
velocity between the jet and the ambient gas, the jet is subjected to short wavelength and
disintegrates several diameters downstream the nozzle and the average drop diameter is much
smaller than the jet diameter.
Figure 2-3 Schematic representation of the jet breakup length, Lb, jet intact – core length, Lc and the intact – surface length, Ls. Λ is the wavelength of the induced surface perturbations. Source: Lin and Reitz [25]
The regime where the intact-surface length becomes zero (though the intact-core length may
not necessarily be zero) is identified as the atomization regime [23]. The breakup curve
follows the trend suggested by Haenlein [22], viz. the breakup length drops to zero. Here, the
jet disrupts completely at the liquid-gas interface and the drops formed are much smaller than
the jet diameter. So far, the disruption of the jet at higher jet velocities has been attributed to
the effect of surrounding gas. However, Phinney [28] explained the occurrence of the peak
by considering the initial disturbance level of the jet as a variable contrary to the traditional
concept of constant initial disturbance level. The initial disturbance level is known to vary
with the relaxation of jet velocity profile at the orifice exit, the ambient gas density and the
fluid viscosity effects [13, 29]. Relaxation of the jet velocity is the process by which the
LS
velocity profile of a laminar jet inside an orifice rearranges to the uniform or plug flow
profile because of the cessation of the solid boundary [23, 30]. As soon as the jet leaves the
nozzle orifice, there exists no physical constraint of the nozzle wall; as a result, momentum
transfer between the transverse layers of the jet takes place leading to velocity profile
relaxation [31].
Figure 2-4 Relaxation of Laminar velocity profile as suggested by [23, 30].
McCarthy and Malloy [32], defined a quantity, ϵ, the ratio of the kinetic energy of the fluid
flow to the equivalent kinetic energy under plug flow conditions, such that
(2.10)
where, Ur is the local fluid velocity and U the average fluid velocity over area. For three
different flow situations we have
For plug flow, ϵ = 1.
For fully developed turbulent flow, ϵ = 1.1 to 1.2.
When a fully developed flow emerges from a nozzle, its parabolic profile relaxes into a flat
profile at the same average velocity as shown in Figure 2-3. This process is accompanied by
a reduction in ϵ from 2 to 1 that involves a considerable redistribution of energy within the
jet, thereby bringing to the jet surface liquid particles with radial velocity components and
thus, leading to the creation of forces that can be quite violent, causing the jet to burst. This
phenomenon of “bursting breakup” was also explained and noted by Eisenklam and Hooper
[33] and Rupe [34]. Thus, in addition to the normal jet destabilizing forces, there is present
an additional disruptive mechanism arising from the internal motions associated with
velocity profile relaxation. Turbulent profiles with ϵ = 1.1 to 1.2 are only slightly susceptible
to the profile relaxation effects. However, turbulence produces ruffles on the jet surface
thereby making it more susceptible to the aerodynamic forces. Due to the distinct roles
played by turbulence and aerodynamic forces, the atomization process is classified as
primaryatomization where the jet breakup is the result of the internal forces like turbulence, inertial effects, or velocity relaxation effects and secondary atomization which also involves aerodynamic forces in addition to the internal forces [31]. Secondary atomization or
aerodynamic forces act directly on the jet surface and are responsible for the breakdown of
(a) (b) (c) (d)
Figure 2-5 Real life examples. (a) Rayleigh breakup. (b) First – wind induced regime. (c) Second – wind induced regime. (d) Atomization regime.
The behavior of the jet in different regimes is shown in Figure 2.2. For given inlet condition,
different physical mechanisms are active in the different breakup regimes. In each regime
different physical forces play a dominant role in the breakup. The relevant physical forces
include the surface tension, the inertial forces in the liquid and the surrounding gas, the
viscous forces and the body force. The relative importance of these forces are determined by
the Weber number, Reynolds number, Froude number, Mach number, density ratios and
velocity of the fluids involved [23, 24]. Although the behavior shown is with respect to the
jet velocity, the nozzle internal design effects play an important role, especially for high
speed jet breakup. High speed liquid jets are used extensively in jet cutting applications and
under similar injection conditions, the fuel injected from modern diesel injection systems
undergo rapid atomization. The significant difference in the two jet behavior is the result of
differences in the nozzle interior design features. Diesel nozzles are typically short-length
holes with sharp edged inlets, whereas jet cutting nozzles are contoured nozzles with minimal
initial disturbances to the liquid flow [25].
The criteria for demarcating the different regimes of a cylindrical liquid jet emanated in still
air have been numerically quantified. By balancing the liquid inertia force and the surface
tension force of a free liquid column Ranz [26] determined that dripping no longer occurs
and formation of jet occurs if jet liquid Weber number, , where . The
criterion ambient gas Weber number corresponds to the point where
the inertia force of the surrounding gas reaches about 10% of the surface tension forces. ρL
and ρG are the liquid and gas densities, U is the jet initial velocity and D is the orifice
diameter. Numerical results of Sterling and Sleicher [13] indicate that the maximum in the jet
breakup length occurs when where , .
Thus, it marks the onset of first – wind induced regime. Hence, the criteria for Rayleigh
breakup would be
and or . (2.11)
Ranz [26] further argued that the gas inertia is of the same order as the surface tension force
when . This marks the end of the first-wind induced regime. Thus, the limits for
(2.12)
Thus, also indicates the beginning of the second – wind induced regime where
the aerodynamic forces start to become dominant. Miesse [27] suggested the criterion for the
onset of atomization as .
Hence, the limits for the second-wind induced regime can be defined as
(2.13)
The second – wind induced regime is the last breakup regime where an unbroken section of
jet is visible downstream of the nozzle exit. However, none of the criteria mentioned above
takes nozzle internal flow effects into account.
Non – circular orifices
Till date, majority of the research work has been carried out on the jets issued from circular
orifices. Few studies have considered the asymmetrical orifice geometries. However, the
interest in non - circular orifices dates back to the days of Bidone [7]. Rayleigh analyzed
Bidone’s observations [10] and reported about the unique phenomenon of axis – switching
demonstrated by the jets from non - circular orifices. Citing the experiment of Bidone,
Rayleigh [35] stated, “Thus in the case of an elliptical aperture, with major axis horizontal,
the sections of the jet taken at increasing distances gradually lose their ellipticity until at a
certain distance the section is circular. Further out the section again assumes ellipticity, but
now with the major axis vertical.” The surface tension force of the liquid is considered
responsible for this unique phenomenon. Once the jet is discharged from the elliptical orifice,
the movements of major and minor ends do not stop abruptly at the ideal circular cross
section, i.e., the cross section with minimum surface area but overshoot. This causes the
outward moving minor axis ends to be pushed further outwards and the inward moving major
axis ends to be pulled further inwards. This kind of geometrical transformation superimposed
with the axial motion of jet gives rise to the axis – switching profile on the jet [44]. This
geometrical oscillation from elliptical to circular and back to elliptical cross section persists
until damped by the viscous forces or the jet breaks up downstream owing to growth of
instabilities on its surface.
Rayleigh [36] developed a model to measure the dynamic surface tension using the
wavelength of the axis switching phenomenon of an elliptical jet. Bohr [37] further extended
the work by taking viscosity into consideration which was neglected by Rayleigh. In his
model, he considered finite deviation of the cross section from circularity. Caulk and Naghdi
[48] presented a non linear one dimensional model for an elliptic, viscous jet using the basic
theory of one – dimensional Cosserat continuum [49]. In [38, 39] Bechtel et al. develop a
comprehensive theory of one space dimensional closure models for free viscoelastic free jets
based on the assumption that the jet is slender. They used Galerkin averaging method and
integrated the Navier – Stokes equation over the jet cross section. Their results resulted in
Cosserat equations. The model described in [38] incorporates the effects of elasticity,
viscosity, surface tension and gravity. They later used the model for studying the viscoelastic
elliptical jets for the special case of a Newtonian free jet with constant surface tension [39,
As can be seen, among all the non - circular orifice geometries elliptical orifices have been
studied extensively. The elliptical jets present an intermediate case between round and planar
jets. The main advantage of elliptical cross section over circular case is that it facilitates rapid
mixing and spreading when the liquid is discharged into another fluid [45].
The azimuthal curvature variation in an elliptic jet makes the flow feature very complex.
Even in Diesel spray applications, under some experimental conditions, elliptical nozzles
have shown better performance than circular nozzles. The elliptic spray angle is much larger
than that of the circular spray while the Sauter mean diameter (SMD) of elliptic sprays is
much smaller than that of circular sprays [46]. Furthermore, Messina and Acharya [47]
studied experimentally the velocity field and spreading rate of a liquid spray issued from an
elliptic nozzle with and without primary air. By active control of the air flow, they
manipulated the mixing and dispersion of the spray. Their results show that in comparison to
a circular nozzle, the spray issued from an elliptic nozzle provides better mixing in terms of
higher mass entrainment and greater jet width.
In [43, 44] , Kasyap et al. experimentally studied the axis – switching and breakup length of
elliptic liquid jets and showed that the elliptic jets exhibit more unstable behavior and hence,
have a shorter breakup length than a corresponding circular liquid jet. Furthermore, they
discussed the effect of ellipticity on breakup length and showed that increasing the ellipticity
in some ranges makes the elliptic liquid jet more unstable.
These results clearly indicate that asymmetric geometry of nozzle orifice provide a very
thereby reducing breakup length and droplet size and in some cases, improving mass
entrainment by better mixing.
Using the linear form of one – dimensional Cosserat equations, Amini and Dolatabadi [50,
51] carried out the temporal and spatial analysis of wave propagation in viscous liquid jets
emanating from elliptic cross section orifices and predicted the jet profile as a function of
time and axial space. They validated their results through experimental measurements and
were in agreement with the results obtained by Kasyap et al. [44].
Spray characteristics like spray tip velocity, penetration, width, angle intermittency and heat
release rate of elliptic nozzles at injection pressures varying from 300 to 1300 bars were
studied by Jacobsson, Winkelhofer and Chomiak [61] and were compared with the results
obtained from circular and step orifices. They observed substantial differences in the spray
characteristics. At low injection pressure of 300 bar, the spray width increased twice as fast
in the minor axis plane of the elliptic and step orifice than the circular orifices. Also, the non
- circular geometries showed close-to-nozzle spray cone angles in both the minor and major
axis planes. The spray cone angle for elliptic minor axis plane was 93% larger than one of the
circular orifices used. Moreover, the spray cone angle and spread were larger in the minor
axis plane than the major axis plane for the elliptic nozzle, and the spray became circular at
around 25 mm form the nozzle tip. However, at injection pressures beyond 500 bars no
significant effects of differences in the orifice geometries were observed. Also, even though
the spray characteristics differed at low injection pressures, heat release rates were different
Xi et al. [62] studied the liquid jet atomization from elliptical nozzles by varying the aspect
ratios and observed the phenomenon of axis – switching, i.e. the spray width was larger in
the minor axis plane, then further downstream it became circular and eventually reversed its
configuration along the jet axis. Crighton [63] also reported that elongated jets tend to exhibit
lateral flapping motion along their minor axes. Even in case of air and gas jets, laboratory
studies using elliptic nozzles [64, 65, 66] and nozzles with corners, e.g. rectangular,
triangular, star-shaped [67, 68, 69] have observed that as the jet moves downstream, its cross
section undergoes changes in its geometric shapes similar to those of the nozzle orifice but
with axes successively rotated at angles characteristic of the jet geometry, denoted as the
axis-switching phenomenon. This phenomenon is mainly responsible for the enhanced
entrainment properties of noncircular jets, relative to comparable circular jets, and is a result
of self-induced Biot-Savart deformation of vortex rings with non-uniform azimuthal
curvature and interaction between azimuthal and streamwise vorticity. Due to Biot-Savart
self-induction, portions of the vortex with small radius of curvature, such as the major axis
section of elliptic rings or the vertices in square or triangular rings, will move downstream
faster than the rest, leading to their deformation [45]. As a result, elliptical and rectangular
jets have been reported to have greater entrainment rate than their equivalent circular jets [64,
70, and 71]. Axis switching results from faster growth rate of the jet’s shear layers in the
minor axis plane (plane parallel to the elliptic minor axis) compared to those in the major
axis plane. These differential growth rates result in a crossover point at a certain downstream
distance from the nozzle where the jet’s dimensions at the two axes are equal. In general, the
turbulence level and spectral content emanating from upstream disturbances, velocity and
temperature ratio, nozzle geometry and aspect-ratio, and initial circumferential shear-layer
thickness distribution [45].
The rectangular orifice presents a special case. It incorporates the features of aspect ratio,
similar to an elliptical orifice and the effects of corners, similar to square and triangular
orifices. Nozzle exit shape, aspect ratio, initial turbulence level, and Re affect the
development of the jet. The spreading rate of the rectangular jet is typically higher at the
wide section than at the narrow side. This results in axis switching similar to that of an
elliptic jet. Hertzberg & Ho [72] found that the cross over location is directly proportional to
the aspect ratio of the orifice. Similar to the Rayleigh’s analysis [5] for a cylindrical jet,
Drazin and Reid [52] conducted stability analysis for planar jets. They found that an inviscid
infinite plane jet is stable to all the disturbances because surface tension has always a
damping effect and forces the surface back to its initial shape when perturbed as the
minimum energy occurs when the two surfaces are parallel. However, a finite planar jet is
always unstable to the surface tension instabilities in the form of surface ripples as the initial
shape is not stable to any changes that bring the jet closer to the cylindrical shape. Thus, the
basic tendency is towards contraction, which occurs with considerable inertial overshoot,
leading to axis – switching phenomenon. Moreover, according to Soderberg and Alfredson
[53], the jet is also subjected to the process of velocity profile relaxation as it is issued from
the nozzle. The interaction of the relaxation of the boundary layer or turbulent eddies with
the free surface tension and acceleration due to gravity generates potentially unstable waves
[54] observed inversion or axis switching phenomenon in slab jets and explained it a result of
surface tension and corner vortices. They also observed standing surface capillary waves
fanning out from the edges owing to turbulent velocity profile relaxation.
Because of the proposed better atomization and spray characteristics obtained from non -
circular orifices, they have been used for practical applications as well. Kawamura et al. [55]
studied the spray characteristics of a slit nozzle for direct injection gasoline engines in order
to realize the concept of stratified charge combustion. The slit nozzle forms a thin fan shaped
spray. The results were also compared with those obtained from a swirl nozzle. They
employed slit nozzles of varying thickness and found out that the spray penetration increases
with the slit thickness. However, varying slit thickness does not affect droplet size much. In
comparison to the swirl nozzle, the slit nozzle gives better spray penetration, wider diffuse
spray angle and finer atomization.
They determined some empirical relations for spray penetration and Sauter mean diameter of
droplets based on their experimental observations.
For the first stage of penetration: t < tc
(2.14)
(2.15)
For the second stage of penetration: t > tc
(2.17)
where, y is the spray tip penetration,
c is the coefficient of discharge,
ρa is the surrounding gas density,
ρf is the fuel density,
ρo is the air density under standard atmospheric conditions
t is the time after injection
tc is the critical time
Ae is the Inlet area of the slit orifice
θ is the half spray angle observed from the side
∅is the spray angle observed from the front
∆ P is the difference between the injection pressure and the ambient gas pressure
cs is a constant.
Equation (2.14) is the same as obtained by Arai et al. [56] for the nozzle circular hole
geometry at the initiation of injection. cs was determined to be 0.39 for diesel sprays based on
experimental results. Similarly, the spray tip penetration after the first stage is determined by
equation (2.16) based on Waguri et al.’s [57] spray momentum theory. The solution of
equation (2.14) and (2.16) determines the critical time of penetration as given by equation
Based on the theoretical analysis of the instability of the liquid film and neglecting the
secondary breakup Dombrowski and Hooper [58] determined the relations for the Sauter
mean diameter of the drops by the following equations.
For lower injection pressure,
(2.18)
For higher injection pressure,
(2.19)
where, d32 is the Sauter Mean Diameter of the drop
H is the slit thickness.
Considering the propositions made by Dombrowski and Hooper [58] and Clark and
Dombrowski [59] that the breakup length of liquid film decreases with increase in ambient
air density which causes thicker liquid film and large initial drops at the breakup point and
that droplet coalescence increases with surrounding gas pressure, Kawamura et al. [55]
determined relations for SMD of droplets as follows.
For lower injection pressure ∆P = 0.1 to 0.3 MPa,
(2.20)
For higher injection pressure ∆P = 6 to 12 MPa,
(2.21)
In order to achieve homogeneous lean air-fuel mixture for “rich and lean” combustion and
“lean” diesel combustion, Yamamoto and Niimura [60], used a slit orifice nozzle. They
more homogeneous mixture. They observed the spray from different directions, parallel to
and perpendicular to the nozzle hole slit. When the fuel was injected in ambient pressure of 2
MPa, they found the spray geometry to be symmetrical about the spray axis and similar to
that obtained from a conventional circular hole nozzle. Moreover, the spray penetration and
volume of both the slit and circular nozzles were found to be nearly equal. The spray tip from
the slit nozzle was found to be flatter which they attributed to droplet coalescence. Thus, they
did not observe any improvement in air entrainment by changing the orifice geometry from
circular to rectangular because of the large surface area of the jet in the latter case.
Studies on gases ejected from the noncircular nozzles with corners i.e., square and triangular
showed that the presence of sharp corners in the orifice geometry can increase significantly
the fine-scale turbulence at the corners relative to the flat segments of the orifice [73, 74] and
enhance mass entrainment [75]. Shear-layer growth rates are different at the flat and vertex
sections in square and triangular jets. This difference in spreading rate may lead to axis
switching, or rotation of the jet geometry in the downstream direction. Stretching of the bent
vortex by the shear stresses produces small-scale streamwise vortices at the corners. This
process occurs only in nozzles with corners and is responsible for the initial axis switching
and amplification of small-scale turbulence at the vertices [45].
Results of experiments, stability analysis, and simulations support the concept that the basic
mechanism for the first axis rotation of the jet cross-section is the self-deformation of the
vortex rings due to non uniform azimuthal curvature at the initial jet shear layer. However,
subsequent axis rotations of the jet cross-section are not necessarily linked to successive
Many practical applications like fuel combustion, inkjet printers, medical applications, etc.
require smaller droplet generation. However, it has been found that for a given fluid the
injection pressure scales like γ/r, where γ is the liquid surface tension and r is the droplet
radius. Thus, ejecting smaller droplets requires higher pressures. Chen and Brenner [76] have
theoretically optimized the orifice geometry required to generate minimum droplet size and
determined it to be a non – circular orifice in the shape of stretched triangles. Using
numerical surface minimization techniques, McGuinness, Drenckhan and Weaire [77] have
shown that further improvement can be achieved by making the boundaries of the triangular
orifice three – dimensional or non planar.
Summary
Based upon these reviews, it can be concluded that the non - circular orifices induce
enhanced instabilities in the jets and the sprays. Generally, a cylindrical jet emanated in
ambient conditions is subjected to forces like surface tension, viscosity, inertia, gravitational
and effects of turbulence, cavitation and aerodynamic forces. In case of non-circular
geometric jets, the breakup phenomenon is different. Many of the research works done on the
elliptical orifices have clearly shown that they undergo axis –switching phenomenon which
quickens the disintegration process of the jet/ spray. Thus, the non-circular jets are more
unstable. Hence, it is expected that non-circular orifices should give better atomization as
compared to circular jets. Similar works on slit orifices have shown that slit orifice yielded
better air entrainment and mixing. In liquid jets, axis switching is a result of competitive
interaction between surface tension and inertia forces. Studies carried out on air and gas jets
gases, it is explained to be an outcome of vortex ring deformation by self – induction. Due to
lateral flapping, the jet surface disintegrates quickly, generating smaller droplets. Also, due to
periodic change in the orientation of the jet profile, it has a better interaction with the
surrounding gas which results in enhanced air entrainment and mixing. Despite of such major
changes and advantages over circular orifices, it is very difficult to find such works which
have extensively studied other non – circular shapes like square and triangles and even
rectangle and ellipse for liquid jet pressures varying up to 1000 bars.
Through this work, we have attempted to explore the scope of investigation in the areas of
non –circular jets and sprays. For a thorough study, analyses have been carried out on a large
range of pressures, starting from a few psi going up to 1000 bars. Jets and sprays have been
analyzed from different orientations and for a number of macroscopic and microscopic spray
properties. The results obtained have been compared to those obtained from the circular
orifices. Based upon our findings, we have tried to improve our understanding of the basic
physical processes involved in jet breakup and atomization. For the better utilization of the
depleting fossil resources and controlling the all – pervasive pollution, better advancements
in the field of fuel atomization and spray combustion are required and we have tried to make
CHAPTER 3: EXPERIMENTAL SETUP AND PROCEDURE Low Pressure System
The low pressure water injection system consisted of a stainless steel water storage tank
which was kept under pressurized conditions to supply high pressure water to the orifice.
Tank pressure was controlled using regulated compressed nitrogen supply. Nitrogen gas was
used to prevent rusting. High pressure seamless stainless steel tubes were used to transport
water from the tank to the orifice inlet. A water filter was installed to the outlet of the supply
tank to filter out any contaminants. The water flow to the orifice was controlled using a flow
control valve along with a digital pressure gauge to monitor the injection pressure and
pressure drops occurring in the supply system, especially in the filter. The orifice plate was
installed in the orifice assembly. The orifice assembly (Figure 3-1) comprised of a cylindrical
smoothening chamber of diameter 5 mm and about 32 mm long which delivered water to the
orifice plate. The orifice plates were fabricated using stainless steel and the circular and
non-circular orifices were machined using wire-cut electro discharge machining (EDM) process.
The geometrical details of the orifices are provided in Table 3-1. Details of the experimental
Figure 3-2. Low Pressure Water Injection System.
Stainless steel water storage
tank
Compressed N2
Supply Cylinder Digital Supply Pressure Gauge
Digital Injection Pressure Gauge
1000 Watt Lamp High Speed Camera
White Screen Reflector
Fine Mesh Brass Filter Flow Control
Valve
Table 3-1. Geometrical details of the orifices (in m)
Circle Dia 1:
0.000304
Dia 2: 0.0002870
Avg. Dia:
0.0002955 -
Rectangle Width 1:
0.000135 Length 1: 0.000561 Width 2: 0.000132 Length 2: 0.000564
Square Side 1:
0.000268 Side 2: 0.0002628 Side 3: 0.0002608 Side 4: 0.0002617
Triangle Side 1:
0.000347
Side 2: 0.000381
Side 3:
0.000375 -
X-secnal Area (m2) % Diff. in area Dh (in m) L/D ratio
6.86088 x 10 -8 - 0.0002955 4.30
7.50915 x 10 -8 9.44 0.0002158 5.90
6.93409 x 10 -8 1.06 0.0002633 4.79
5.82578 x 10 -8 -15.08 0.0002113 6.04
Figure 3-3a –d shows the high – resolution image of the different orifices used in the present
study. The injection pressure (gauge) was varied from 0 psi to 1000 psi. 0 psi corresponds to
no external pressure and the liquid was allowed to fall freely under the effect of gravity and
hydrostatic pressure of the water column. High speed visualization techniques were
employed to capture the flow behavior. A high speed camera (Phantom 4.3) with a Nikon®
50-mm f/1.8 lens was used. The pixel resolution was varied as per the requirement in order to
capture the details of the breakup and axis-switching phenomena. A front lighting system
was used to illuminate the jet. For this purpose, a 1000 Watt lamp and a white screen
reflector were employed. In order to observe the geometrical development of the jets from
the non - circular orifices, the jets were analyzed from different orientations or view planes,
including those containing the straight edges and those containing the sharp corners or
No appreciable differences in the two pressures were noted, hence, negligible pressure drop
occurred in the supply system. Also, it means that the hydrostatic pressure of the water
column was also negligible and hence, has not been included in the measurements.
Figure 3-3a Circular orifice. Dia: 295μm
Figure 3-3c Square orifice. Side: 263μm x 263μm
Figure3-3d Triangular orifice. Side: 347μm x 375μm x 381μm.
The experiments were conducted for a wide range of flow conditions of the discharging
liquid jets. Different parameters characterizing the flow conditions are provided in the
Table 3-2 Physical properties
Properties at 20o C
Density of water in kg/m3 998.2071
Viscosity in Pa.s 0.001
Surface Tension in N/m 0.07286
Density of Air in kg/m3 1.2041
Table 3-3 Reynolds Number for different flow conditions
0 5 10 15 25 35 50
C 727.51 1,847.57 2,357.89 2,862.36 3,616.89 4,363.16 5,301.52
R 552.74 1,330.46 1,786.39 2,253.51 2,943.61 3,522.80 4,191.88
S 827.53 1,921.07 2,700.10 3,190.88 4,127.91 4,474.75 4,872.73
T 606.89 2,078.83 2,497.69 3,050.50 3,959.75 4,799.23 4,976.30
75 100 200 250 500 750 1000
C 6,469.58 7,559.60 10,507.29 11,661.52 16,166.39 19,654.06 24,337.42
R 4,916.22 5,721.47 8,315.98 9,361.65 13,410.16 15,600.55 18,560.76
S 6,104.98 7,062.05 9,590.53 10,672.77 14,999.84 18,578.97 21,952.56
T 6,090.31 7,093.92 9,600.38 10,477.96 14,679.56 17,686.36 20,051.50
Table 3-4 Liquid Weber Number for different flow conditions
0 5 10 15 25 35 50
C 24.63 158.83 258.69 381.23 608.70 885.80 1,307.78
R 19.47 112.79 203.34 323.59 552.13 790.78 1,119.69
S 35.76 192.70 380.67 531.63 889.72 1,045.52 1,239.76
T 23.97 281.25 406.00 605.61 1,020.44 1,498.98 1,611.63
75 100 200 250 500 750 1000
C 1,947.54 2,659.08 5,137.05 6,327.66 12,160.71 17,973.68 27,560.15
R 1,540.07 2,085.90 4,406.62 5,584.49 11,458.99 15,508.09 21,951.81
S 1,946.08 2,604.08 4,802.62 5,947.67 11,748.05 18,023.38 25,163.05
Table 3-5 Gas Weber Number for different flow conditions
0 5 10 15 25 35 50
Circle 0.03 0.19 0.31 0.46 0.73 1.07 1.58
Rectangle 0.02 0.14 0.25 0.39 0.67 0.95 1.35
Square 0.04 0.23 0.46 0.64 1.07 1.26 1.50
Triangle 0.03 0.34 0.49 0.73 1.23 1.81 1.94
75 100 200 250 500 750 1000 Circle 2.35 3.21 6.20 7.63 14.67 21.68 33.24
Rectangle 1.86 2.52 5.32 6.74 13.82 18.71 26.48
Square 2.35 3.14 5.79 7.17 14.17 21.74 30.35
Triangle 2.91 3.95 7.24 8.62 16.92 24.56 31.56
The different flow parameters have been calculated using the hydraulic diameter of each
orifice and the steady mass flow rate measurements. The steady state mass flow rates were
measures using a precise spring balance and stopwatch. The discharged liquid was allowed to
attain its steady state and then collected in a vessel. Based upon the pre-injection and
post-injection masses of the vessel and the time duration recorded in the stopwatch, mass flow
rates were calculated using the following relation
(3.1)
where, mf is the post-injection mass of the collecting vessel,
mi is the pre-injection mass of the collecting vessel,
∆t is the time recorded on the stopwatch.
Mass flow rate was measured five times for each injection pressure and an average was then