Analytical Study for Ultimate Pressure Capacity of PCCV
Considering Thermal Effect
Takeshi Kawasato1), Masaaki Ohba1), Akira Shimizu2), Yoshihiko Hino2) 1) The Japan Atomic Power Company, Tokyo, Japan
2) Obayashi Corporation, Tokyo, Japan
ABSTRACT
Recently, the importance of the severe accident management is increasing from a safety point of view. Thus, the accuracy improvement of evaluation methods for the ultimate pressure capacity of PCCV is absolutely essential to establish reliability of the severe accident management methodologies.
The evaluation methods have been developed through the high pressure test of a 1/4-scale prestressed concrete containment vessel (PCCV) model at Sandia National Laboratory in 2000. Analytical studies have been conducted in many countries, and authors have also done some studies.
This paper discusses the ultimate pressure capacity of PCCV in newly planned APWR through the analytical study which utilizes knowledge from the former studies. In the analysis, influence of high temperature inside PCCV is considered which was not considered in the high pressure test. The analysis is carried out until the failure of structural components against the accident thermal and pressure loads.
As a result, the ultimate pressure capacity and the failure mode of the PCCV are identified, and the behavior of the PCCV on the severe accident condition is confirmed. Through the study, the evaluation method for the ultimate pressure capacity of PCCV is established.
1. INTRODUCTION
A round robin analysis was conducted to improve the evaluation method for the ultimate pressure capacity of PCCV through the high pressure test of 1/4 scale PCCV model at Sandia National Laboratory in September, 2000. In a series of analyses, models and analytical methods to simulate the ultimate pressure behavior accurately were suggested. However, these were based on static analyses against the internal pressure load with a normal thermal condition and the thermal history in a severe accident was not considered.
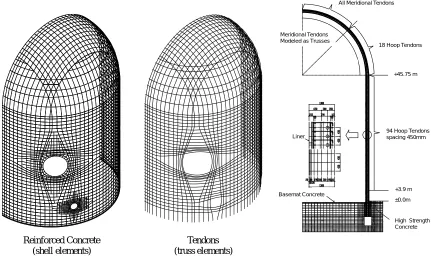
In this study, in addition to the pressure load, the thermal load in a severe accident is considered to clarify the influence of thermal load to the ultimate behavior of PCCV. Thermal dependencies of the material properties are considered in the model. Analyses are conducted using the three-dimensional FE model of PCCV in newly planned APWR in Japan. Figure 1.1 shows the conceptual section of APWR-PCCV.
2. ANALYTICAL MODELING
In this study, the analyses are conducted using two kinds of FE models, a three-dimensional shell model and an axisymmetric model, in order to clarify the ultimate behavior of APWR-PCCV in detail. Figure 2.1 shows the three- dimensional shell model and Figure 2.2 shows the axisymmetric model. Computer code used here is FINAL developed by Obayashi Corporation.
The three-dimensional shell model is a half model of PCCV for the range of 180 degree between the two buttresses including E/H and A/L. It is used for the evaluation of a whole PCCV. The model consists of reinforced concrete modeled by multi-layered shell elements, tendons modeled by truss elements and liner modeled by shell elements which share the nodes with the concrete elements. The buttresses and the additional rebars around the E/H and the A/L are also modeled. Two meridional tendons are modeled as one, and three hoop tendons are modeled as one. The prestress force is set in the tendon elements as the initial tensile stress. The friction between tendon elements and concrete elements is considered as relative slip using link elements connected with the both elements. The base of the model is fixed at the bottom of the
cylindrical wall. Figure 1.1 Conceptual section of
The axisymmetric model is a wedge shape model of two degrees in the circumferential direction for the vertical cross section of PCCV including the base mat. This model aims to evaluate restraint effect of the base mat. Axisymmetric boundary condition is considered to create the same stress condition in PCCV. As the component of the model, concrete is modeled by solid elements divided into 9 layers in the thickness direction of the wall. Vertical reinforcements are modeled by truss elements and horizontal reinforcements are modeled by shell elements. It is assumed that the vertical reinforcements and the horizontal reinforcements are at the same position. Liner is modeled by shell elements considered axial stiffness. Tendons are modeled by truss elements. Hoop tendons in the cylinder wall are arranged in 450mm spacing as well as actual PCCV. No bond is considered between meridional tendons and concrete, while full bond is considered between hoop tendons and concrete. The prestress force is set in the tendon elements as the initial tensile stress.
Reinforced Concrete Tendons (shell elements) (truss elements)
Figure 2.1 Three Dimensional Shell Model Figure 2.2 Axisymmetric Model
3. MATERIAL CHARACTERISTICS
3.1 Thermal Characteristics
For the thermal characteristics of concrete, it is assumed that the thermal conductivity is 1.7 W/mC and the specific heat is 98.2 J/NC. For the thermal characteristics of liner, it is assumed that thermal conductivity is infinite because the difference of temperature between the surface and the back side of liner is negligibly small since the liner is thin (6.4mm). For the heat transfer characteristics, the heat transfer coefficient between liner and concrete is 567.8 W/m2C, between concrete and air is 23.3 W/m2C.
3.2 Mechanical Characteristics
1) Concrete
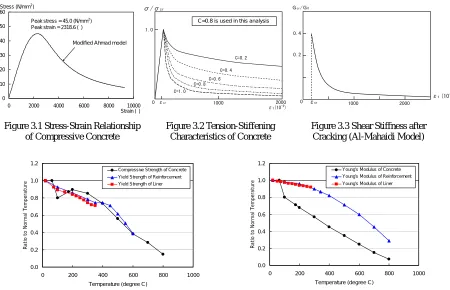
The mechanical characteristic of concrete is considered as follows based on the previous research results. Compressive stress-strain relationship: the Modified Ahmad model[12] shown in Figure3.1 is applied.
Tensile stress-strain relationship: linear until cracking. After the stress reaches the maximum tensile strength, the smeared crack model assuming crack distribution is applied. The tension-stiffening characteristics by Izumo[15] is applied after cracking, shown in Figure3.2.
Failure condition: Willam-Warnke’s 5-parameter model[9] is applied. For the five parameters, experimental value by Onuma[10] et al. is applied.
Shear stiffness after cracking: Al-Mahadi’s model[13] which is a function of the mean strain perpendicular to the crack is applied. The model is shown in Figure 3.3.
All Meridional Tendons
18 Hoop Tendons Meridional Tendons
Modeled as Trusses
+45.75 m
94 Hoop Tendons spacing 450mm
+3.9 m ±0.0m
High Strength Concrete Basemat Concrete
2) Steel
The material constants under normal thermal condition are shown in Table 3.2. For the nonlinear stress-strain relationship, bi-linear model is applied.
3.3 Temperature Dependency of Mechanical Characteristics
Many experimental data regarding the temperature dependency of mechanical characteristic of concrete and steel are shown in the previous papers and reports of academic societies, including Architectural Institute of Japan. Also, those data is comprehensively summarized in "Fireproof guidebook of structure material 2004" (edited by Architectural Institute of Japan) and the European standard "Eurocode". In this study, the temperature dependency is set as shown in Figure 3.4 and Figure 3.5 based on the previous research results.
Figure 3.1 Stress-Strain Relationship of Compressive Concrete
Figure 3.2 Tension-Stiffening Characteristics of Concrete
Figure 3.3 Shear Stiffness after Cracking (Al-Mahaidi Model)
0.0 0.2 0.4 0.6 0.8 1.0 1.2
0 200 400 600 800 1000
Temperature (degree C)
Compressive Strength of Concrete Yield Strength of Reinforcement Yield Strength of Liner
Figure 3.4 Temperature Dependency of Material Strength
0.0 0.2 0.4 0.6 0.8 1.0 1.2
0 200 400 600 800 1000
Temperature (degree C)
Young's Modulus of Concrete Young's Modulus of Reinforcement Young's Modulus of Liner
Figure 3.5 Temperature Dependency of Young Modulus
Table 3.1 Concrete Material Constant under Normal Thermal Condition Position Design Strength
Fc(N/mm2)
Young Modulus Ec(N/mm2)
Poisson's Ratio
ν Coefficient*Linear Expansion (1/ C)
PCCV 45 2.92×10⁴ 0.2 0.9×10⁻⁵
Base Mat 30 2.44×10⁴ 0.2 0.9×10⁻⁵
*Linear Expansion Coefficient : The value at 20 degree in Eurocode Table 3.2 Steel Material Constant under Normal Thermal Condition
Material Yield Strength (N/mm2)
Rupture Strength (N/mm2)
Young’s Modulus (N/mm2)
Poisson's Ratio
ν Linear Expansion Coefficient (1/ C) Reinforcement
(SD345)
345 [1683]
490
[190000] 2.05×10
5
1.2×10⁻⁵ Reinforcement
(SD390)
390 [1902]
560
[170000] 2.05×10
5
1.2×10⁻⁵
Tendon 1580
[7902]
1845
[35000] 2.00×10
5
1.2×10⁻⁵ Liner (SGV410) 225
[1108]
410
[170000] 2.03×10
5
0.3 1.2×10⁻⁵
[ ] : strain at the yield strength or the rupture strength (µ)
Modified Ahmad model
0 10 20 30 40 50 60
0 2000 4000 6000 8000 10000
Strain (µ) Peak stress = 45.0 (N/mm2)
Peak strain = 2318.6 (µ) Stress (N/mm2)
4. PRESSURE AND TEMPERATURE CONDITION
Generally, the functional integrity of a reactor containment vessel is confirmed for the pressure and temperature condition inside the containment 24 hours after the occurrence of accident. However, in this study, it is assumed that the pressure and temperature inside the containment continue rising over 24 hours after the occurrence of accident in order to evaluate the ultimate behavior of PCCV. The pressure and temperature condition in this study is shown in Figure 4.1. The pressure and temperature condition is set based on the accident scenario which assumes to remain saturated condition inside the containment. 0.0 0.5 1.0 1.5 2.0 2.5
0 10 20 30 40 50 60
Time (hour) Int er nal pr es s ur e ( M P a ) 0 50 100 150 200 250 T em per at ur e ( degr ee C ) Pressure Temperature
Figure 4.1 Pressure and Temperature Condition inside Containment
5. ANALYTICAL RESULT
5.1 Result of Temperature Distribution Analysis
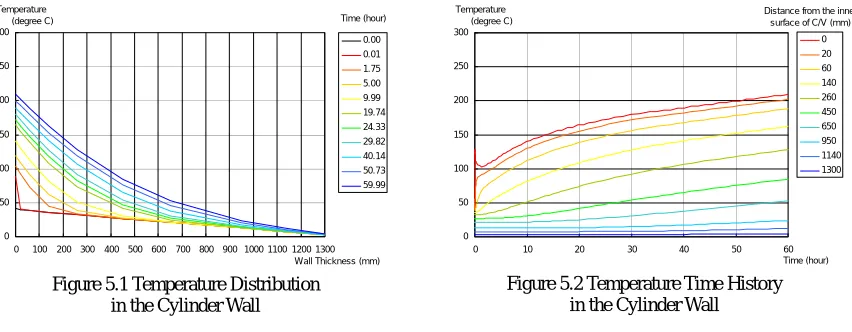
The temperature distribution analysis is performed using the 1-dimensional model in wall thickness direction for dome, cylinder wall and peripheral thick wall area of openings. The temperature condition in winter is used as an initial condition which is 40 degrees Celsius for inside the containment and 1 degree Celsius for outside. It is because the temperature gradient in a wall is steeper than any other seasons. The temperature condition shown in Figure 4.1 is applied to the liner surface.
Temperature distribution and temperature time history in the cylinder wall are shown in Figures 5.1 and 5.2. According to these results, the temperature of the liner and the adjacent concrete surface continue to rise along with the increase of temperature inside the containment and exceed 200 degrees Celsius after 60 hours. On the other hand, the temperature on the outside surface of concrete is about 4.5 degrees Celsius after 60 hours and the rise of temperature is few. In other parts of PCCV, the results are the same as the cylinder wall. In addition, the temperature distribution analysis by the axisymmetric model is also conducted, and the same result is obtained.
Time (hour) 0 50 100 150 200 250 300
0 100 200 300 400 500 600 700 800 900 1000 1100 1200 1300 Wall Thickness (mm) Temperature (degree C) 0.00 0.01 1.75 5.00 9.99 19.74 24.33 29.82 40.14 50.73 59.99
Figure 5.1 Temperature Distribution in the Cylinder Wall
Distance from the inner surface of C/V (mm)
0 50 100 150 200 250 300
0 10 20 30 40 50 60 Time (hour) Temperature (degree C) 0 20 60 140 260 450 650 950 1140 1300
Figure 5.2 Temperature Time History in the Cylinder Wall
5.2 Result of Stress Analysis
1) Displacement Distribution
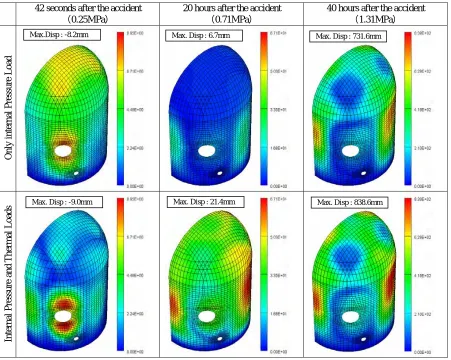
The stress analysis by the three dimensional FE model is conducted considering the internal pressure and the thermal loads. In addition, the analysis considering only the internal pressure load is also conducted. The displacement contours are shown in Figure 5.3. The following characteristics about the displacement are confirmed from these contours.
42 seconds after the accident: regardless of consideration for thermal load, the displacement around the opening is large. It is considered that the displacement caused by prestress load is dominant at this stage of the accident. 20 hours after the accident: the difference by consideration for thermal load is remarkable. The displacement in the case with thermal load is larger than that of without thermal load. It is because the Young's modulus and the yield strength decrease due to temperature dependency of the material property.
40 hours after the accident: the displacement becomes rapidly large along with the increase of internal pressure load in both cases. The area of large displacement is in the cylinder wall on both sides of the thick wall area around openings regardless of consideration for thermal load.
42 seconds after the accident 0.25MPa
20 hours after the accident 0.71MPa
40 hours after the accident 1.31MPa
On
ly
in
tern
al Pressure Lo
ad
In
te
rn
al
Pr
es
sur
e an
d
T
h
er
m
al L
o
ad
s
Figure 5.3 Displacement Contour
2) Strain Distribution
The relationship between the internal pressure load and the strain at the element where the maximum strain occurs are shown in Figure 5.4. The strain contours are shown in Figure 5.5. The following characteristics about the strain are confirmed from these figures.
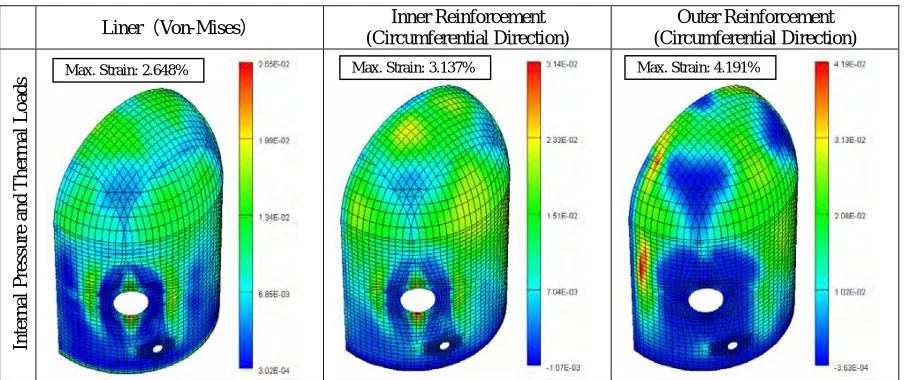
Liner: in the case with the pressure load only, tensile strain increases in the liner. On the other hand, in the case with the pressure and the thermal loads, compressive strain increases at the beginning, and then the strain turns to the tension side gradually. It is because the concrete restrains the thermal expansion of the liner. With the increase of pressure, the difference between the two cases becomes small, and then the case with the pressure and the thermal loads becomes larger at approximately 0.9Mpa. It is because the Young's modulus and the yield strength decrease due to temperature dependency of the material property. The area of large strain is in the circumference of openings and the cylinder wall on both sides of the thick wall area around openings regardless of consideration for thermal load. It is considered that the strain in the circumference of openings is caused by out-of-plane bending deformation produced by support reaction of the hatch due to the pressure load. Moreover, it is considered that the strain in the cylinder wall on both sides of the thick wall area around openings is caused by the difference of stiffness between the general portion of the cylinder wall and the thick wall area.
Hoop Tendon: regardless of consideration for thermal load, the difference between the two cases is small. It is because the tendon is located near the neutral axis of a concrete wall, and is not influenced by the temperature gradient in the wall. In addition, although the strains of tendons are almost equal in the beginning, the maximum strain occurs in the general portion of the cylinder wall below the spring line along with the increase of the pressure. This result corresponds to the displacement distribution.
Inner Reinforcement (circumferential direction): In the case with thermal load, compressive strains are added to the reinforcement until about 0.4MPa. With the increase of pressure, the tensile strain with thermal load increases more than that of without thermal load. It is similar to the strain in the liner. The area with large strain is in the circumference of openings and the cylinder wall on both sides of the thick wall area around openings regardless of consideration for thermal load. It is also similar to the strain in the liner.
Max.Disp : -8.2mm
Max. Disp : -9.0mm
Max. Disp : 6.7mm
Max. Disp : 21.4mm
Max. Disp : 731.6mm
Max. Disp : 838.6mm
Outer Reinforcement (circumferential direction): In the case with thermal load, the tensile strain caused by the temperature gradient already exists in the initial condition. Therefore, the larger strain obviously increases in the case with thermal load. However, the difference between with and without thermal load becomes small along with the increase of the pressure. The area with large strain is in the cylinder wall along the buttress between the E/H opening and the buttress. The strain in the upper end of buttress in the dome is also relatively large. These are the areas where the stiffness changes drastically, and it differs from the areas with large strain in the inner reinforcement. The reason is considered to be by the influence of the bending strain caused by the difference of deformation between the thick wall area and the buttress. According to the displacement contour shown in Fig.5.3, it is confirmed that the deformation in the thick wall area is small and the deformation in the buttress area is relatively large. It is considered that the tensile strain is added to the outer reinforcement in the buttress area and to the inner reinforcement in the both side of the thick wall area because of the difference of deformation.
-2500 0 2500 5000 7500 10000
0.0 0.2 0.4 0.6 0.8 1.0 1.2
Pressur (Mpa)
St
ra
in
(µ
)
Only Pressure Pressure and Thermal
(a) Liner (Circumferential Direction)
-2500 0 2500 5000 7500 10000
0.0 0.2 0.4 0.6 0.8 1.0 1.2
Pressure (Mpa)
St
ra
in
(µ
)
Only Pressure Pressure and Thermal
(b) Hoop Tendon
-2500 0 2500 5000 7500 10000
0.0 0.2 0.4 0.6 0.8 1.0 1.2
Pressur (Mpa)
St
ra
in
(µ
)
Only Pressure Pressure and Thermal
(c) Inner Reinforcement (Circumferential Direction)
-2500 0 2500 5000 7500 10000
0.0 0.2 0.4 0.6 0.8 1.0 1.2
Pressure (Mpa)
St
ra
in
(µ
)
Only Pressure Pressure and Thermal
(d) Outer Reinforcement (Circumferential Direction) Figure 5.4 Relationship between Internal Pressure load and Strain at the Element where the Maximum Strain Occurs
LinerVon-Mises Inner Reinforcement
(Circumferential Direction)
Outer Reinforcement (Circumferential Direction)
In
te
rn
al
Pr
es
sur
e an
d
T
h
er
m
al L
o
ad
s
Figure 5.5 Strain Contour at 40 hours after the accident (1.31MPa)
Max. Strain: 2.648% Max. Strain: 3.137% Max. Strain: 4.191%
5.3 Evaluation of Ultimate Pressure Capacity
1) Evaluation of Structure
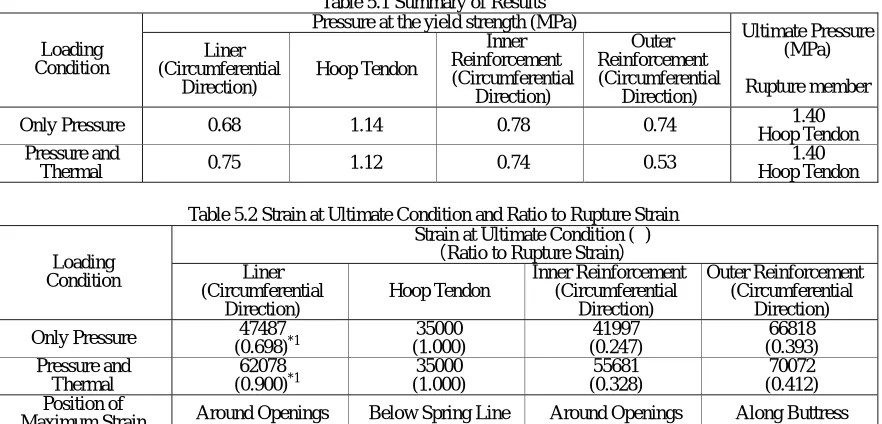
The summary of analytical results by the three dimensional shell model is shown in Table 5.1. Regarding the pressure at the yield strength in the case without thermal load, yield occurs in the order of liner, outer or inner reinforcement, and tendon. For the case with thermal load, yield occurs in the order of outer reinforcement, liner or inner reinforcement, and tendon. It is considered that the order differs because of compressive or tensile strain caused by the temperature gradient depends on the position of the structural element.
On the other hand, the ultimate pressure capacity is determined by the hoop tendon regardless of consideration for thermal load. The rupture pressure of hoop tendon is about 1.4 MPa. It is because that the pressure load becomes dominant in the high pressure condition, and the effect of temperature dependency is small since the temperature of a tendon rises only to about 50 degrees Celsius.
The ratios of the strain of the structural elements at the ultimate condition to the rupture strain are shown in Table 5.2. In addition, the analytical results for the bottom of the cylinder wall by the axisymmetric model are shown in Table 5.3. It is confirmed that the failure of the bottom of the cylinder wall does not occur before the failure of the upper portion of the cylinder wall.
2) Evaluation of Liner
In the case without thermal load, the maximum strain of liner is 4.52% in the general portion and 4.75% around the opening. This strain is less than the rupture strain 6.8%* of the liner. Therefore, in the case without thermal load, it is considered that the rupture of the liner does not occur. In the case with thermal load, the maximum strain of liner is 4.64% in a general portion and 6.21% around the opening. This strain is also less than the rupture strain 6.8%* of the liner. Therefore, it is considered that the rupture of the liner does not occur in the case with thermal load, too.
* The rupture strain in consideration of strain concentration by the weld joint, scallop, and liner anchor end.
Table 5.1 Summary of Results Pressure at the yield strength (MPa) Loading
Condition
Liner (Circumferential
Direction)
Hoop Tendon
Inner Reinforcement (Circumferential
Direction)
Outer Reinforcement (Circumferential
Direction)
Ultimate Pressure (MPa) Rupture member
Only Pressure 0.68 1.14 0.78 0.74 1.40
Hoop Tendon Pressure and
Thermal 0.75 1.12 0.74 0.53
1.40 Hoop Tendon Table 5.2 Strain at Ultimate Condition and Ratio to Rupture Strain
Strain at Ultimate Condition (µ) Ratio to Rupture Strain Loading
Condition Liner
(Circumferential Direction)
Hoop Tendon
Inner Reinforcement (Circumferential
Direction)
Outer Reinforcement (Circumferential
Direction) Only Pressure (0.698)47487 *1 (1.000) 35000 (0.247) 41997 (0.393) 66818
Pressure and Thermal
62078 (0.900)*1
35000 (1.000)
55681 (0.328)
70072 (0.412) Position of
Maximum Strain Around Openings Below Spring Line Around Openings Along Buttress *1: Rupture Strain of Liner: 68000 µ =170000 µ /2.5 Table 5.3 Results by Axisymmetric Model
Strain at Ultimate Condition (µ) Ratio to Rupture Strain Loading
Condition Liner
(Vertical Direction) Meridional Tendon
Inner Reinforcement (Vertical Direction)
Outer Reinforcement (Vertical Direction)
Only Pressure 44070
(0.648)
8064 (0.230)
31886 (0.188)
23064 (0.136) Pressure and
Thermal
43361 (0.638)
8360 (0.239)
30951 (0.182)
23397 (0.138) Position of
Maximum Strain
Bottom of
Cylinder Wall Mid Cylinder Wall
Bottom of
6. CONCLUSION
In this study, the ultimate pressure capacity and the failure mode of the APWR-PCCV are identified, and the behavior of the PCCV on the severe accident condition is confirmed. The results of this study are as follows.
Stress analysis results
The maximum displacement occurs in the general portion of the cylinder wall below the spring line regardless of consideration for thermal load.
For the liner and the inner reinforcement, the strain becomes large in the circumference of openings and the cylinder wall on both sides of the thick wall area around openings.
For the outer reinforcement, the strain becomes large in the cylinder wall along the buttress.
For the hoop tendon, the strain becomes large in the general portion of the cylinder wall below the spring line. Evaluation of Ultimate Pressure Capacity
For the case without thermal load, yield occurs in the order of liner, inner or outer reinforcement and tendon. For the case with thermal load, yield occurs in the order of outer reinforcement, liner or inner reinforcement and tendon
The ultimate pressure capacity is determined by the hoop tendon in the general portion of the cylinder wall below the spring line regardless of consideration for thermal load. The rupture pressure is about 1.4 MPa.
7. REFERENCES
[1] Ohba M., Kawasato T., Kato A., et al.: Analysis Results of a 1:4-Scale Prestressed Concrete Containment Vessel (PCCV) Model Subjected to Pressure and Thermal Loading, The International Slandered Problem No.48 – Containment Capacity report NEA/CSNI/R(2005)5/Vol.3, pp.H1-H53, August 2005.
[2] Overpressurization Test of a 1:4-Scale Prestressed Concrete Containment Vessel Model, NUREG/CR-6810 Report, USA, SAND2003-0840P.
[3] Pretest Round Robin Analysis of a Prestressed Concrete Containment Vessel Model, NUREG/CR-6678 Report, USA, SAND 00-1535.
[4] Yonezawa K., Imoto K., Kato A., Ozaki M., Kiyohara K., Murazumi Y., Sato K.: Pretest and Posttest Analyses for Nonlinear behavior of 1/4PCCV Model Subjected to Internal Pressure, E-298, The First FIB Congress in Osaka, 2002. [5] Takeda T., Yamaguchi T. and Naganuma K.: Report on Tests of Nuclear Prestressed Concrete Containment Vessels,
Concrete Shear in Earthquake, Edited by T. C. C. Hsu, S. T. Mau, Elsevier Applied Science, pp.163-172, 1992. [6] Analysis of Axisymmetric Prestressed Concrete Containment Vessel (PCCV) Including Thermal Effects, May 27,
2004, Revised August 19, 2004
[7] Darwin, D. and Pecknold, D.A.: Nonliner Biaxial Stress-Strain Law for Concrete, J. of EM Div., ASCE, Vol.103, No. EM2, pp.229-241, April, 1977.
[8] Kupfer, H. B.: Behavior of Concrete under Biaxial Stress, J. of E. M. Div., ASCE, Vol.99, No.EM4, pp.853-866, Aug., 1973.
[9] Willam, K. J. et al.: Constitutive Model for the Triaxial Behavior of Concrete, Proc. of int. Assoc. for Bridge & Stru. Eng., Vol.19, pp.1-30, 1975.
[10] Ohnuma, H. et al.: Ultimate Strength Property of Concrete under Triaxial Compressive Stresses, Report of CRIEIPI, No.381021, Dec., 1981, in Japanese.
[11] Elwi, A. A. et al.: A 3D Hypoelastic Concrete Constitutive Relationship, J. of EM Div., ASCE, Vol. 105, No.EM4, pp.623-641, Aug., 1979.
[12] Naganuma, K.: Stress-Strain Relationship for Concrete under Triaxial Compression, Journal of structural and construction engineering (Transactions of AIJ), No.474, pp.163-170, Aug., 1995, in Japanese.
[13] Al-Mahaidi, R. S. H.: Nonlinear Finite Element Analysis of Reinforced Concrete Deep Members, Report 79-1, Dep. of Structural Engineering, Cornell Univ., Jan., 1979.
[14] Amemiya A. and Noguchi H.: Development of Finite Element Analytical Program for High Strength Reinforced Concrete Member Part1: Development of Concrete Model, Annual Convention of AIJ, Proceeding of Structures II, pp.639-640, Oct., 1990, in Japanese.
[15] Izumo J. et al.: An Analytical Model for RC Panels Subjected to In-plane Stresses Concrete Research and Technology, No.87.9-1, pp.107-120, Sep. 1987.