52
Proposed Data Quality Evaluation Method for a Transportation Agency
Fatimah Mohamad Yunusa, Pritheega Magalingam a*, Nurazean Maaropa
, Ganthan
Narayana Samya, Doris Hooi-Ten Wonga,Bharanidharan Shanmugamb, Sundresan
Perumalc
afatimah0710@gmail.com, ampritheega.kl@utm.my, anurazean.kl@utm.my, aganthan.kl@utm.my, adoriswong@utm.my, bbharanidharan.shanmugam@cdu.edu.au, csundresan.p@usim.edu.my
aAdvanced Informatics School, Universiti Teknologi Malaysia, Jalan Sultan Yahya Petra, 54100 Kuala Lumpur, Malaysia. bCharles Darwin University, Ellengowan Drive, Casuarina Campus, Australia
cFaculty of Science and Technology, Universiti Sains Islam Malaysia, Malaysia
______________________________________________________________________________
Abstract
The data quality evaluation is essential towards designing a data assessment method for any company because data is an important asset. Therefore, the purpose of this study is to develop the data quality evaluation method for a transportation agency in Malaysia in order to quantify the quality of data in the SIKAP licensing system. This can benefit the transportation agency to improve the quality of data for the use of reporting, forecasting business operations and data integration with other agency’s systems. The relevant data evaluation dimensions have been identified from literature study and relative data evaluation framework which are necessarily required by the transportation agency to maintain high data quality in the SIKAP system. The process design for the proposed method involves data dimension identification, capturing the relevant database structure, subjective evaluation with a questionnaire and objective evaluation with data profiling. From the design process, the result shows that data evaluation method for a transportation agency must have a minimum of six data quality dimensions. SIKAP, the legacy system is in the process to revamp into a new system. Thus, this research contributes to enhance the current system’s data quality during revamping process and data migration into the new system.
Keywords: Data Quality; Data Dimension; Data Profiling; Evaluation; Transportation System
1. Introduction
Data is an important asset to any agency. It is defined as “stored representations of objects and events that have meaning and importance in the users’ environment”. It is also called as information, that is, “data that have been processed in such a way as to increase the knowledge of the person who uses the data” [1]. However, data is meaningless when there is no quality. One of the most widespread definitions of data quality states that data are of high quality "if they are fit for their intended uses in operations, decision making and planning" [2]. There is an excessive concern about the quality of corporate data. Poor data have many impacts, for example on operations (i.e., causing customer and employee dissatisfaction and increased costs); tactical (i.e., affecting decision making and causing mistrust), and strategic (i.e., affecting the overall organization’s strategy) [3]. Thus, it is important to identify the degree of data quality for the purpose of successful business in any agency.
___________________
53 According to [4], three main attributes from a total of 49 are frequently used to describe data quality; completeness, accuracy and timeliness. The other criteria of these attributes are consistency, accessibility, relevance, up-datedness, validity, periodicity, reliability, precision, integrity and confidentiality [4]. No matter how efficient the process of data entry, errors will still occur, for example, data redundancy, misspelling and others. Gartner survey in 2015 on the usage and adoption of data quality tools revealed that the respondents estimated a loss of $8.8 million in average annually due to the data quality issues. Nevertheless, IBM estimated that the annual cost of poor quality data to business is 3.1 trillion dollars in the US for 2016. Poor data definitely have many impacts towards an organization, such as incoherent management and operational reporting [3]. Thus, all agencies need to adopt data quality evaluation method to ensure the data is accurate and fit their use.
In a transportation agency, high-quality data is crucial for accessing the latest information, better decision-making and policy planning. SPAD (Suruhanjaya Pengangkutan Awam Darat) that is the Land Public Transport Commision is a transportation agency in Malaysia that owns commercial data of vehicles such as taxis, buses, lorries, licenses, operators and enforcement. SIKAP (Sistem Perlesenan Kenderaan Perdagangan), the Driver Safety Practice System is the main operational function in SPAD that process and stores data of vehicles, licenses, permits and enforcement cases. These data are used for dashboard reporting by the operation and management team and other agencies that are integrated into this transportation organization. Research shows that data quality issues in transportation utilize three attributes of data quality that are related to data archiving; suspect or erroneous data, missing data, and data accuracy [5]. In another study, from the analysis of TransGuide data, missing data has accounted for about 25 percent of the overall data quality records [5]. The availability and integrity of data also have important implications for decision making for transportation planning models, infrastructure maintenance, the asset management and to develop models for service regulation [6]. We found that there are data quality issues such as data redundancy, data misspelling and missing value occurs in the SIKAP system. Therefore, there is a need to build data quality evaluation method that is suitable and meets the transportation agency’s requirements. The aim of this research is to propose data quality evaluation method for SIKAP system in a transportation agency. This paper is organized into four sections. The next section describes the previous studies related to this research. Section 3 describes the proposed data quality evaluation method and followed by conclusion in section 4.
2. Literature Review 2.1 Data Quality
54 Table 1: Attributes of data quality
Item Attributes
High data quality
Completeness, accuracy or positional accuracy, timeliness or up-datedness or currency, validity, periodicity, relevance, reliability, precision, integrity, confidentiality or data security, comparability, consistency or internal consistency or external consistency, concordance, granularity, repeatability, readily useable or usability or utility, objectivity, ease with understanding, importance, reflecting actual sample, meeting data standards, use of standards, accessibility, transparency, representativeness, disaggregation. Poor data
quality
Missing data, under-reporting, inconsistencies, data errors or calculation errors or errors in report forms or errors resulted from data entry, invalid data, illegible handwriting, non-standardization of vocabulary, and inappropriate fields.
2.2 Data Quality Dimension
In order to achieve data quality that suits users, customers and business needs, the data should follow a dimension or combination of multiple dimensions. A dimension is a measurable data quality property that can be used to guide the process of valuing the quality [3].Moreover, dimensions are sometimes referred to as attributes or characteristics. The four major data quality dimension components that are critical to the data improvement process are accuracy, completeness, consistency and timeliness [9]. Based on seminal work that has been gathered from data consumers, data quality dimensions are classified into four categories that are intrinsic (accuracy, believability, objectivity and reputation), contextual (appropriate amount, completeness, relevancy, value-added and timeliness), representational (concise, understandable, interpretability, consistency) and accessibility (access security). According to [10], Redman classifies data quality dimensions into data values and data format. Data value dimensions refer specifically to values and the independent ability of the internal representation of data such as accuracy, completeness, currency and consistency. As for data format, information that meets certain criteria, for example, ability to interpret correctly, format that can be applied in various situation and also that can be changed easily are categorized as appropriateness, interpretability, portability, format precision, format flexibility, ability to represent null values, efficient use of memory and representation consistency.
55 requirement of the organization, they have to choose the suitable dimensions accordingly to define the metrics for data quality evaluation.
2.3 Data Quality Problems in Transportation
The transport sector encompasses the movements of people and goods through different modes (e.g. road, rail, or air,) at the urban, intercity and international scale. The availability and quality of transport-related data are important for decision making in the public sector. Data also a prerequisite for private-sector firms making strategic and operational decisions about production, marketing or shipment of goods, or the movement of passengers, as well as by their respective chains of suppliers. The common data problems in transportation that have been identified by the study comprise of three attributes of data quality that are relevant to Intelligent Transportation System (ITS) data archiving; suspect or erroneous data, missing data, and data accuracy [5]. Intelligent Transportation Systems rely on the availability of high-quality data to make correct decisions in diverse traffic situations [11]. The data quality problem that happened in intelligent transportation is an erroneous addressing of data in the databases thus the faulty output of decision algorithms. Data quality problems that faced by the transportation such erroneous data, missing data and data accuracy are serious problems that will affect the operation and cause customer dissatisfaction.
Data managed at the local-level creates another problem for the organization to maintain data. Information silos are one of the problems produced by managing data at the local level [13]. Lee et al.[13] have mentioned that information silos occur in many organizations, which produces a problem like inconsistency of the data definition, format and data values. Besides, operational cost such as excess labour costs, assessment costs, data re-input costs and process failure costs might rise due to poor data detection and correction[14]. These tasks must be conducted by organization especially when the daily business involves crucial data that needs to be used by decision-makers and top management to choose the best path for their company future growth. In order to build trust, poor data should be avoided or treated otherwise an organization will receive bad perception from their customers, partners and difficult to build trust for the future business dealings.
2.4 Data Quality Assessment
The data should be assessed to evaluate the quality and importance of information in an organization. Data quality assessment is the scientific process and statistical evaluation of data to determine whether they possess the quality for business purposes and are usable[15]. According to[10], data assessment follows measures that quantify relevant data quality dimensions. Andreescu et al.[16], mentioned data quality assessment is highly context and application dependent whereby it is difficult to formulate a general solution that will work in all situations. According to [17], data quality methodologies have been defined and developed to measure and improve data quality in organizations. A methodology can be referred as a set of procedures that are designed to measure and enhance the data quality of a specific application.
2.5 Data Quality Assessment Methodologies
There are various methodologies for data quality assessment and improvement that have been developed by the researchers. Here we discuss 4 main methodologies that we focus to derive a suitable quality assessment methodology for SIKAP transportation system.
56 The TDQM methodology was the general methodology which is the outcome of academic research at Massachusetts Institute of Technology. TDQM that is the Total Data Quality Management consist 4 phases: (1) Definition, (2) Measurement, (3) Analysis and (4) Improvement. Phase 1 definition involves Data Analysis, Data Quality Requirement Analysis and Process Modeling. Data Analysis is to define characteristics at 2 levels; high level: description of functionalities for information consumers and low level: description of the basic units and components of the information product and their relationship. Data quality requirement analysis is to define information quality requirements from the perspective of suppliers, manufacturers, consumers and managers. Process Modeling is to define the Information Manufacturing System. Phase 2 refers to measurement where its input is information quality dimensions and the IQ metrics and the output of this phase is information quality problems. Phase 3 is data analysis and used to identify the causes of errors and to determine root causes of the discrepancy. The output of this phase is the list of actions for improving data quality. The last phase is the improvement part. The selection of strategies and techniques is to identify key areas for improvement. The output of this phase is IQ improvement techniques. TDQM is widely accepted as a methodology to ensure data quality. However, TDQM is hard to adapt for larger firms which own large databases [18] because in large organizations many people have responsibilities for data and may have different data user needs.
2.5.2 Data Quality Assessment (DQA)
Data quality assessment in practice involves subjective and objective assessment[19]. Subjective data quality assessments can use a questionnaire to measure the stakeholder perceptions of data quality dimensions. Objective assessments can be independent or task-dependent. Task-independent metrics do not depend on the task which just gives a general view of the data status without the related knowledge of the application and can be applied to any data set, regardless of the tasks at hand. Task-dependent metrics include the organization’s business rules, company and government regulations, and constraints provided by the database administrator that developed in specific application contexts. The analysis begins with subjective and objective assessments of a specific dimension where both are compared. The outcome of the analysis will fall into one of four quadrants. The goal is to achieve a data quality state that falls into Quadrant IV. If the analysis indicates Quadrants I, II, or III, the company must investigate the root causes and take corrective actions. At a minimum level, it will assist to ensure the development of multi-level and multi-tasked metrics so as to measure the quality of data.
2.5.3 AIMQ (A Methodology for Information Quality Assessment) Methodology
57 compare the data quality measurement proposed by them. The AIMQ methodology is very comprehensive and functions better if it addresses specific needs of the organization by creating the questionnaire that comprises well-defined specifications.
2.5.4 Information Quality (IQ) Assessment Framework by Six Sigma Approach
Information Quality (IQ) Assessment Framework by Six Sigma Approach [20] was developed by adopting Six Sigma approach that reflects four phases; (1) Establish IQ Requirements, (2) Identifying IQ Dimensions, (3) Implementing Six Sigma and (4) Assessing IQ. The proposed framework can provide critical factors for data quality, the current and improved quality (sigma) level, the insufficiencies in information systems and the root causes of poor information. This framework implements House of Quality (HOQ) for information quality assessment at phase 3. This is a matrix that composes to sub-matrices that are related to each other whereby customer requirements matrix is created using the customer responses collected from phase 1. Information Quality (IQ) Assessment Framework by Six Sigma Approach is a comprehensive framework. However, much effort such as time and resources are needed to ensure the successful implementation.
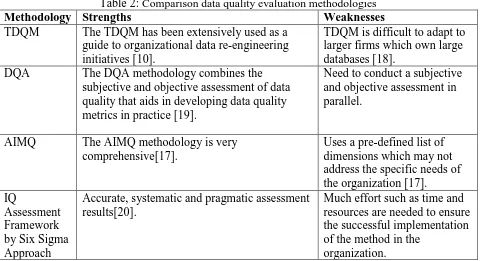
2.6 Comparison of Data Quality Evaluation Methodologies
These four data quality methodologies have been studied. The strength and weaknesses comparison of four data quality methodologies are shown in Table 2.
Table 2: Comparison data quality evaluation methodologies
Methodology Strengths Weaknesses
TDQM The TDQM has been extensively used as a guide to organizational data re-engineering initiatives [10].
TDQM is difficult to adapt to larger firms which own large databases [18].
DQA The DQA methodology combines the
subjective and objective assessment of data quality that aids in developing data quality metrics in practice [19].
Need to conduct a subjective and objective assessment in parallel.
AIMQ The AIMQ methodology is very comprehensive[17].
Uses a pre-defined list of dimensions which may not address the specific needs of the organization [17]. IQ
Assessment Framework by Six Sigma Approach
Accurate, systematic and pragmatic assessment results[20].
Much effort such as time and resources are needed to ensure the successful implementation of the method in the
organization.
58 An organization might consider many data dimensions and attributes that are suitable and meet the organization’s requirements before identifying the right measure to improve data quality.
3.0 The Proposed Data Quality Evaluation Method
Data quality dimensions are identified to choose the relevant dimensions to evaluate the data quality of the SIKAP system. The observation result by SIKAP’s admin indicates data problems such as duplicated data or data redundancy, missing value, incorrect data and misspellings. Through the literature review and the nature of the system, it has been found that accuracy, completeness, consistency, timeliness, relevance and accessibility are important data quality dimensions for the SIKAP system. The proposed method is based on the past literature review and deep understanding of the SIKAP system. Following to that, each dimension will be mapped to a specific data profiling.
Completeness refers to the absence of the essential data, for example, the available data is missing. In the SIKAP system, “missing data” occurred, for example, the user did not key in a field because it is not a mandatory field. Meanwhile, accuracy is defined as the extent to which data are correct, reliable and certified. The data that have been the key in SIKAP should be acceptable and accurate since it is important for business operation. Data accuracy and completeness focus on data stored in corporate databases. On the other hand, consistency is the extent to which data is presented in the same format and compatible with previous data. For example, a vehicle’s date of permit validity has the same value and format in the dashboard reporting as that stored in the database. Relevance refers to an extent for which information is applicable and helpful for the task at hand. The data that contain in SIKAP should suitable for dashboard reporting which will help the operation and management team for analysis and decision making. Accessibility refers to data availability, or easy and fast retrievable. For example, data sets should be available in the database to be accessible for dashboard reporting or to be retrieved by the user when needed. Timeliness reflects how up-to-date the data is with respect to the task it used for. Timeliness is the longevity of data that is used for the task at hand. The data that contain in SIKAP should be up to date and should aid the operation and management team for analysis and decision making. Based on the review in depth, the proposed data quality evaluation method is shown in Figure 1. In the proposed evaluation method, subjective evaluation refers to questionnaire while objective evaluation used data profiling.
59 According to [21], subjective assessment depends on the user experience, the task at hand, and the use of questionnaires. A survey questionnaire is designed to gather users’ perspective on data quality of SIKAP and also to specify of those data quality dimensions priorities for evaluating data quality. In the objective assessment, we used the task-dependent metrics that include the organization’s business rules, regulations, and constraints provided by the database administrator, to be applied to the dataset. Data profiling is the process of examining the data available in an existing data source and collecting statistics and information about that data [22]. Data profiling helps to find data quality rules and requirements that will support further thorough data quality evaluation. Data quality dimensions such as accuracy, completeness, consistency, relevance, timeliness and accessibility can be measured from the database through queries. SQL Server Management Studio software is used to run the SQL-queries. The data quality dimensions identified for SIKAP system is mapped into suitable data profiling and it is shown in Figure 2.
Figure 2:Proposed data profiling for each data quality dimension
60 Figure 3: SIKAP database structure
Based on Figure 2, accuracy can be measured by data profiling using domain validation to ensure the data is correct or no misspelling and wrong data entry occur. Accuracy also can be measured by null check to identify missing values in a column of a table in the database. Completeness can be measured by null check to identify missing values in the SIKAP database table. Consistency can be measured by data pattern whether the data is present in the same format as the previous data. Then, relevance and accessibility can be measured to identify duplicated data or data redundancy in the database. The last is timeliness which can be measured whether the data in the database is up to date by querying the minimum or maximum for date time column. By matching the list of data profiling with the SIKAP database structure we show the evaluation format for each data quality dimensions in Table 3.
Table 3: Evaluation format for each data quality dimension
Data Quality Dimension Data Profiling Data Check Description
Accuracy Domain Validation Vehicle Status; Y, T, null
Accuracy Completeness
Null Value Checks Null value e.g. column VehicleNumber
Consistency Column Pattern VehicleNumber format
Relevance Accessibility
Duplicate Detection VehicleNumber data across three tables of the vehicle; lorry, taxi and bus.
Timeliness Range Validation Minimum or maximum date of
data entry or recorded. E.g. Modified date of vehicle tables.
3.1 Data Quality Evaluation in the SIKAP system workflow
61 entered in the SIKAP system will be evaluated using each data quality dimensions proposed; accuracy, completeness, consistency, relevance, accessibility and timeliness. First, the data will be evaluated with the accuracy dimension. The data quality report will be produced as the output of the data quality evaluation method. The data quality report contains the data quality evaluation results of six main data quality dimensions.
Figure 4: Proposed data quality evaluation method in the SIKAP’s workflow
4.0 Conclusion
62 The proposed data quality evaluation method will help the transportation agency to quantify the quality of data in the existing SIKAP licensing system.
References
[1] Lucas, A. Corporate data quality management: From theory to practice. in Information
Systems and Technologies (CISTI), 2010 5th Iberian Conference on. 2010. IEEE.
[2] Kerr, K., T. Norris, and R. Stockdale, Data quality information and decision making: a
healthcare case study. ACIS 2007 Proceedings, 2007: p. 98.
[3] Laranjeiro, N., S.N. Soydemir, and J. Bernardino. A survey on data quality: classifying
poor data. in Dependable Computing (PRDC), 2015 IEEE 21st Pacific Rim International
Symposium on. 2015. IEEE.
[4] Chen, H., et al., A review of data quality assessment methods for public health
information systems. International journal of environmental research and public health,
2014. 11(5): p. 5170-5207.
[5] Ahn, K., H. Rakha, and D. Hill, Data quality white paper. 2008, US Department of Transportation, Federal Highway Administration.
[6] Barbero, J.A. and L. Uechi, Assessment of Transport Data Availability and Quality in
Latin America. 2012, Inter-American Development Bank.
[7] Chen, M., et al. Survey on data quality. in Information and Communication Technologies
(WICT), 2012 World Congress on. 2012. IEEE.
[8] Sidi, F., et al. Data quality: A survey of data quality dimensions. in Information Retrieval
& Knowledge Management (CAMP), 2012 International Conference on. 2012. IEEE.
[9] Panahy, P.H.S., et al., A framework to construct data quality dimensions relationships.
Indian Journal of Science and Technology, 2013. 6(5): p. 4422-4431.
[10] Batini, C., et al., Methodologies for data quality assessment and improvement. ACM computing surveys (CSUR), 2009. 41(3): p. 16.
[11] Staron, M. and R. Scandariato. Data veracity in intelligent transportation systems: The
slippery road warning scenario. in Intelligent Vehicles Symposium (IV), 2016 IEEE.
2016. IEEE.
[12] Litman, T., Sustainable transportation indicator data quality and availability. Victoria Transport Policy Institute, 2009.
[13] Lee, S.H. and A. Haider, A Framework for Information Quality Assessment Using Six
Sigma Approach. Communications of the IBIMA, 2011.
[14] Eppler, M. and M. Helfert. A classification and analysis of data quality costs. in
International Conference on Information Quality. 2004.
[15] Teegalapally, V., et al., Survey on Data Profiling and Data Quality Assessment for
Business Intelligence. 2016.
[16] Andreescu, I., et al., Measuring Data Quality in Analytical Projects. Database Systems Journal, 2014. 5(1): p. 15-25.
[17] Vaziri, R. and M. Mohsenzadeh, A questionnaire-based data quality methodology.
International Journal of Database Management Systems, 2012. 4(2): p. 55.
[18] Wijnhoven, F., et al., Total data quality management: A study of bridging rigor and
relevance. 2007.
[19] Pipino, L.L., Y.W. Lee, and R.Y. Wang, Data quality assessment. Communications of the ACM, 2002. 45(4): p. 211-218.
[20] Lee, S. and A. Haider, Asset lifecycle information quality management: a six-sigma
63 [21] del Pilar Angeles, M.a. and F.J. GarcĂa-Ugalde, Subjective Assessment of Data Quality considering their Interdependencies and Relevance according to the Type of Information
Systems. International Journal on Advances in Software Volume 5, Number 3 & 4, 2012,
2012.