CYCLIC PLASTICITY AND FATIGUE-RATCHETING BEHAVIOUR OF
SS304LN STAINLESS STEEL MATERIAL
Sumit Goyal,, Suneel K. Gupta, V. Bhasin, K. K. Vaze
Reactor Safety Division, Bhabha Atomic Research Centre, Trombay, Mumbai, INDIA-400085 E-mail of corresponding author: sgoyal@barc.gov.in
ABSTRACT
The integrity assessment of the primary piping components needs to be demonstrated under cyclic loadings, during the normal operation and the design basis accidents such as earthquake event. In order to understand material’s cyclic plasticity and failure behaviour, systematic experimental investigations on specimens and components have been carried on SS 304LN stainless steel material. The material specifications of this steel are same as proposed for Indian Advance Heavy Water Reactor (AHWR) Main Heat Transport (MHT) piping. The tensile and axial fatigue tests are conducted to establish the material’s mechanical properties, low cycle fatigue and cyclic plasticity behaviour. Further to understand fatigue- ratcheting behaviour, a series of uniaxial ratcheting tests on specimens and fatigue-ratcheting tests on pressurized component, that is, elbow are carried out. Various cyclic plasticity models such as multiaxial kinematic hardening and Chaboche model are evaluated using tests data. Modifications have been proposed in the Chaboche model and modified model is able to simulate the cyclic plasticity response that is LCF and ratcheting behaviour for all the loading ranges considered. Effect of thickness variation on global and local response of elbow is analyzed. The test results, their analyses, interpretations and the finite element simulations have been presented in this paper.
INTRODUCTION
Many engineering components in conventional and Nuclear Power Plant (NPP) are subjected to complex stress/strain cyclic loading during their service life. It includes cyclic loading under normal operation as well as during the design basis accident events such as earthquake loads. In some situations, cyclic loading may induce large amplitude stress reversals, which exceed the elastic limit of the material. Under sustained (or primary) loading along with cyclic inelastic (or secondary) loading, in addition to LCF damage, progressive accumulation of deformation or strain (known as ratcheting) may also take place by ratchet action. Ratcheting is definition as the accumulation of plastic strain cycle-by-cycle for certain stress amplitude with a non-zero mean stress.
The process of ratchet strain accumulation during cyclic loading causes reduction in the fatigue life of components and can lead to failure of components. Boussaa [1], Xia [2] etc. has shown significant influence of interaction on fatigue life of component. In view of this, safety and integrity of high energy pressurized piping system is of main concern and many researchers [3-6] have carried out experimental and analytical investigations. The investigations have shown that the fatigue-ratcheting synergy, leading to crack initiation and rupture in few cycles only, is the likely mode of failure [6]. In order to develop rational piping design methods for these failure mechanisms, accurate prediction of ratcheting response is critical. Robust low-cycle fatigue simulation model is required which can simulate and predict cyclic plasticity as well as ratcheting responses and leads to improved design methodology against low-cycle fatigue and ratcheting failures.
In past, a number of investigators like Ohno et. al. [7], Chaboche et. al. [8], Hasan et. al [9], Bari et. al. [10] and Rahman et. al. [11] etc. has been carried out investigations to understand the cyclic plasticity and ratcheting behaviour of materials. Even though much research has been done on modeling of cyclic plasticity behaviour including ratcheting, none of the existing models in the literature is versatile and robust to simulate it accurately. Therefore, understanding and modeling of fatigue-ratcheting phenomena still require several developments before robust plasticity models are constituted.
loading conditions. All the above specimen and component level investigations have generated data and helped in understanding the Indian AHWRs MHT piping failure under complex cyclic loadings.
EXPERIMENTAL DETAILS AND RESULTS
Experiments are conducted on standard solid cylindrical specimens and 6” NB elbows of SS 304LN material. These specimens are fabricated from 6” NB pipe in accordance with requirements of ASTM. The material specifications of this steel are same as proposed for Indian AHWR MHT piping. The chemical composition of the material is given in table 1.
Tests are conducted to characterize the monotonic and cyclic plastic deformation behavior of the material at room temperature (25oC to 30oC). In all, four types of uniaxial specimen and component tests have been conducted.
It includes monotonic tensile test (strain controlled condition), Low Cycle Fatigue (LCF) test (strain controlled condition), uniaxial ratcheting test (stress controlled condition) at specimen level and fatigue-ratcheting test at component level.
Table 1: Chemical composition of SS 304LN stainless steel (in weight %)
Material C Mn P Si S Cr Ni N Mo Nb
SS 304 LN 0.03 1.78 0.024 0.38 0.007 18.26 9.11 0.06 0.16 0.014
Uniaxial Tensile Tests
Two numbers of monotonic tensile tests are carried out to determine tensile properties of SS304LN material at room temperature. Mechanical properties as evaluated from these tests are given in table 2.
Table 2: Mechanical Properties of SS 304LN stainless steel material
Properties Yield Stress σy (MPa) Ultimate Stress σu (MPa) Elongation (%) Young’s Modulus E (GPa)
SS304LN 340 670 65 195
Low Cycle Fatigue (LCF) Tests
Low Cycle Fatigue (LCF) tests are conducted under strain controlled loading at different strain amplitudes ranging from 0.5 to 2.0%. These tests are performed under quasi-static cycling, in which strain rate was maintained at 0.001 (mm/mm)/sec. Table 3 gives the details of LCF tests, that is, specimen ID and applied strain amplitude in different tests. Data of these tests is used for evaluation of various cyclic plasticity model constants.
Table 3: Details of LCF tests
Specimen ID LCF1 LCF2 LCF3 LCF4 LCF5 LCF6 LCF7 LCF8 LCF9
Strain Amplitude (%) 0.5 0.7 0.85 1.0 1.2 1.4 1.6 1.8 2.0
Saturated Stress Amplitude (MPa)
290 342 361 402 459 497 530 560 582
Cyclic Softening/Hardening Behavior
To evaluate the evolution of stress-strain response with number of cycles, that is, cyclic softening/ hardening behaviour of material, test data of LCF have been analyzed in detail. It is observed that the stress-strain response of SS304LN changes cycle-by-cycle, until it gets stabilized in few cycles. Typical stress-strain response of material for 1st, 10th and 50th cycle of 1.0% strain amplitude is shown in fig. 1(a). Stress amplitude variations with
number of cycles, for 1.0% and 2.0% strain amplitude, are also shown in fig. 1(b & c) respectively. From these figures, it is observed that material show cyclic hardening in initial 10 cycles, which is termed as primary cyclic hardening. The stress amplitude variation is still observed, however the rate of change is insignificantly small in comparison to that during initial cycles and it is termed as secondary cyclic softening/hardening. Primary cyclic hardening is followed by cyclic softening or cyclic hardening depending upon the strain amplitude, until failure. It is also observed that for strain amplitude greater than 1.4%, the secondary stress-strain response hardens however, for strain amplitude less than 1.4%, it softens with cycles.
Strain Amplitude_1.0% -450 -300 -150 0 150 300 450
-1.2 -0.8 -0.4 0 0.4 0.8 1.2
Strain (%) St ress ( M P a ) 1st Cycle 10th Cycle 50th Cycle Strain Amplitude_1.0% 0 50 100 150 200 250 300 350 400 450 500
0 200 400 600 800 1000
Number of Cycles (N)
St ress A m pl it ude (M P a )
Strain Amplitude _2.0%
0 100 200 300 400 500 600 700
0 50 100 150 200 250
Number of Cycles (N)
S tr e s s A m p litu d e ( M P a )
(a) Stress-strain response (ε, 1.0%) (b) Stress amplitude variation (ε, 1.0%) (c) Stress amplitude variation (ε, 2.0%) Fig. 1 Cyclic stress-strain responses of 1.0% and 2.0% strain amplitude LCF tests.
Evaluation of Stabilized or Cyclic Stress-Strain Curve
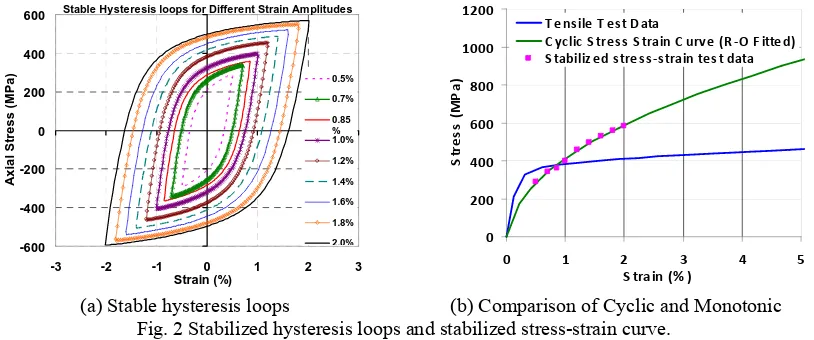
As mentioned earlier, the stress-strain response changes cycle-by-cycle, that is, cyclic softening/ hardening, until it gets stabilized. In many materials, the stabilized or cyclic stress-strain response significantly differs from their monotonic behaviour. In view of this, cyclic stress-strain curve is evaluated using half life criterion in the present work. Value of stabilized stress amplitude is acquired from the stable hysteresis loop corresponding to the applied strain amplitude in the different LCF tests. Stable hysteresis loops for different given strain amplitudes and corresponding saturated stress amplitude is shown in fig. 2 and table 3 respectively.
Stable Hysteresis loops for Different Strain Amplitudes
-600 -400 -200 0 200 400 600
-3 -2 -1 0 1 2 3
Strain (%) A x ia l St re s s (M Pa) 0.5% 0.7% 0.85 % 1.0% 1.2% 1.4% 1.6% 1.8% 2.0% 0 200 400 600 800 1000 1200
0 1 2 3 4
S train (% )
St re s s (M P a ) 5
T ens ile T es t D ata
C yc lic S tres s S train C urv e (R‐O F itted)
S tabiliz ed s tres s‐s train tes t data
(a) Stable hysteresis loops (b) Comparison of Cyclic and Monotonic
Fig. 2 Stabilized hysteresis loops and stabilized stress-strain curve.
Final cyclic stress-strain curve is idealized by Rambarg-Osgood (R-O) equation, as given in Eq. (1).
⎟ ⎠ ⎞ ⎜ ⎝ ⎛ ⎭ ⎬ ⎫ ⎩ ⎨ ⎧ ⎟ ⎠ ⎞ ⎜ ⎝ ⎛ Δ + Δ = Δ n K E 1 1 2 . 2 2 1 2 2 σ σ
ε (1)
The constants of Eq. (1) are evaluated by fitting the cyclic stress-strain data (Δσ/2, Δε/2). The value of R-O constants is k =5714.59 and n = 0.467. Fig. 2 shows the comparison of the stabilized stress-strain data and R-O fitted curve with monotonic stress-strain curve.
FINITE ELEMENT SIMULATION OF CYCLIC PLASTICITY BEHAVIOUR
Determination of Chaboche Model Parameter and Its Performance
Chaboche three decomposed model uses Von-Mises yielding criterion and associated incremental plasticity flow rule as given in Eq. (2) and Eq. (3) respectively.
0
)
)(
(
2
3
)
,
(
ij ij=
ij−
a
ij ij−
a
ij−
o=
f
σ
α
τ
τ
σ
(2)ij p ij
f
d
ε
=λ∂∂σ (3)
In the above equations, σij is the stress tensor, αij is the total backstress tensor, τij is the deviatoric part of the
stress tensor (σij), aij is the deviatoric backstress tensor (that is, the current center of the yield surface), σo is the size
of yield surface, is the plastic strain tensor, dεp
ij is increment in plastic strain tensor (εpij), and λ is a positive scale
factor of proportionality, which is zero in the elastic domain. In Chaboche three decomposed model, each of the three decomposed rules has its specific purpose. Total stress at any point in uniaxial stress-strain hysteresis loop, is the sum of the size of yield surface (σo) and total backstress (αx):
o x
x
α
σ
σ
=
+
(4)Total backstress can be represented as the summation of three backstress components due to each of the kinematic hardening rule. Chaboche proposed that the increment of backstress in deviator stress space can be defined as:
3 2 1 3
1
α
α
α
α
α
=∑
= + += i
i
x and
da
da
da
C
d
ia
idp
p i i
M
i
i
=
ε
−
γ
=
∑
=
3
2
,
1
(5)
Where p is the accumulated plastic strain and final/saturated value of α is depends on values of C and γ as:
x
C
H
=
m
γα
(6)Chaboche three decomposed model have total seven parameters, namely, σo, C1, γ1, C2, γ2, C3 and γ3. Out of
these, six parametersare evaluated from stable stress-strain hysteresis loop of LCF test. The stable stress-strain hysteresis loops are closed and hence, for the simulation of these, γ3 is taken to be equal to zero. However, for a
situation of none-closing hysteresis loop, that is, ratchet strain accumulation, γ3 is an important parameter and is
called as ratcheting parameter. It needs to be evaluated using uniaxial ratcheting data, as would be discussed later in this paper. The Chaboche model parameters should also satisfy the following relationship, at or near the maximum/limiting plastic strain in a given stabilized hysteresis loop:
( )
{
pl p x o
x
C C
C σ σ ε ε
γ
γ + = − − 2 − −
3
2 2
1
1
}
(7)The above equation assumes that at or near the maximum plastic strain, first two backstress components, that is, α1 & α2 saturates with respect to strain.
For the evaluation of Chaboche model parameters, stable hysteresis loop of ±1.0 % strain amplitude LCF test is used. The size of yield surface (σo) is taken to be cyclic yield stress which in present work is evaluated from
stress-strain hysteresis loop corresponding to the half of the linear portion by 0.02% strain offset. It has been seen that stress-strain hysteresis loops are non-linear, however, up to 0.02% offset strain the effect of non-linearity is insignificant. Therefore, the definition of size of yield surface (σo) is subjective and based on judgment. It may
further be noted that if slightly different value of σo is chosen then the other Chaboche model parameters would
change accordingly but consistency among different sets would be maintained. The evaluated values of Chaboche three decomposed model parameters are given below:
In order to verify applicability of evaluated Chaboche model parameters, the FE analysis of axial fatigue specimens are carried out, for different strain amplitudes. Comparison of FE simulated stable hysteresis loop (using evaluated model parameters) with test is shown in fig. 3(a), for 1.0 % strain amplitude. It is evident from the comparison that hysteresis loop exactly matches at maximum plastic strains εLp and at other intermediate strain
values also the predicted stress matching is very close with respect to test results. Same set of parameters is used for the FE simulation of other axial fatigue tests. The comparisons of simulated stable hysteresis loops for strain amplitude 0.7% and 1.4% with corresponding tests result are shown infig. 3(b). It is observed from the figure that for strain amplitude 0.7% and for 1.4%, it over and under predicts the stress-strain hysteresis loop, respectively. The stress amplitude response as evaluated by FE analyses are also compared against those which are recorded in tests for each of applied strain amplitude, shown in fig. 3(c). It is observed from this figure that evaluated stress amplitude (in strain controlled condition) is deviates from the corresponding stress amplitude as recorded in the test. Therefore, same set of constants would leads to considerable deviation in strain amplitude prediction in case of analysis under stress controlled condition (such as uniaxial ratcheting loading).
Strain Amplitude_1.0% -450 -300 -150 0 150 300 450
-1 -0.5 0 0.5 1
Plastic Strain (%)
A x ia l S tr e s s ( M P a ) Experiment FE_Analysis -600 -400 -200 0 200 400
-1.25 -0.75 -0.25 0.25 0.75 1.25
Plastic Strain (%)
A xi a l S tr ess ( M P a) Experiment FE_Analysis FE A l i E i
250 300 350 400 450 500 550 600
250 350 450 550
Tests Recorded Stress Amplitude
FE E v al uat e d S tr ess A m p li tude Test Data FE_Analysis
(a) For strain amplitude 1.0 % (b) For strain amplitude 0.7% & 1.4% (c) Peak stress comparison Fig. 3 Comparison of stable stress-strain hysteresis loops and peak stress for various strain amplitude using single
set of Chaboche parameters (corresponding to 1.0%).
From the above study, it is concluded that single set of Chaboche model parameters are unable to predict maximum/peak stress for different strain amplitudes LCF tests. It may be noted that for 1.0% strain amplitude the error in prediction of stress amplitude is nearly zero, since the Chaboche model parameters (given earlier) are derived from stable hysteresis loop for 1.0% strain amplitude only. In other words, the Chaboche model parameter’s value would differs for stable hysteresis loops corresponding to different strain amplitudes. This is one of apparent drawback of classical Chaboche model which is not widely published in open literature. The possible cause for this limitation, in Chaboche model, is elaborated in next subsection.
Evolution of Size of Yield Surface (σo) and C3Parameter
In view of above discussion, hysteresis loops for different LCF tests are compared, as shown in fig. 4. For this comparison, loops are rigidly shifted in stress-plastic strain plane such that starting point of loading portion of all loops could match.
Comparison of Hysteresis Loops: Linear portion
0 200 400 600 800 1000 1200
0 1 2 3
Plastic Strain (%)
A x ia l S tr e ss ( M P a 4 ) 0.5% 0.7% 0.85% 1.0% 1.2% 1.4% 1.6% 1.8% 2.0%
Comparison of Hysteresis Loops: Slope
-200 0 200 400 600 800 1000 1200
0 1 2 3 4
Plastic Strain (%)
A x ia l S tr e s s (M P a ) 0.5% 0.7% 0.85% 1.0% 1.2% 1.4% 1.6% 1.8% 2.0%
From the comparison, it is clear that linear portion of loops, which represents twice of size of yield surface (σo), is not matches, that is, it is not constant and varies with applied strain amplitude. From the fig. 4, it is also clear
that even slope of loops in third region are not same but different for different loops. It is concluded that there is requirement of different value of parameters for simulation of different loops depending on the applied strain amplitudes. This observation has not been considered in widely used cyclic plasticity models. This is possibly the reason of classical Chaboche model’s failure in simulation of the simplest case of stabilized hysteresis loops of different strain amplitudes with universal set of parameters, as highlighted earlier.
Based on LCF experimental data, the size of the yield surface (σo) and value of C3 are determined for each
test directly from the corresponding stable hysteresis stress-strain loop. The size of the yield surface (σo) has been
determined corresponding to 0.02% strain offset, as mentioned earlier. Fig. 5(a) and 5(b) shows the variation of size
of the yield surface (σo) and C3 with plastic strain amplitudes. It is clear from fig. 5 that size of yield surface (σo)
and C3 are not a constant but function of plastic strain amplitude (Δεp/2) and can be best represented by Eq. (8).
) 2 / ( 3616 . 0
396
.
137
pe
o
ε
σ
=
ΔMPa and
⎥ ⎥ ⎦ ⎤ ⎢
⎢ ⎣ ⎡
⎟⎟ ⎠ ⎞ ⎜⎜ ⎝ ⎛ Δ + =
−1.4233
3 1863.6 1 2 p
C
ε
MPa (8)150 200 250 300
0 0.5 1 1.5 2
Plastic Strain (%)
Y
iel
d
S
u
rf
a
ce (
M
P
a
) Size of Yield Surface
Exp. Fit
0 2000 4000 6000 8000 10000 12000
0 0.5 1 1.5 2
Plastic Strain
C3
P
a
ra
m
e
te
r (
M
P
a
)
C3
Power fit
(a) Evolution of yield surface with strain amplitudes (b) Slope of third linear region, C3
Fig. 5 Evolution of size of yield surface and slope in high strain region with plastic strain
Modification in Chaboche Three Decomposed Model
It is clear that for the simulation of hysteresis loops of different strain amplitude for SS304LN material, there is requirement of evaluation of individual set of Chaboche model parameters. In view of this, for the evaluation of model parameters for different strain amplitudes, their experimental stress-strain hysteresis loops have been reanalyzed in detail.
As parameters (C1, γ1) represent the first region of hysteresis loop, that is, onset of non-linearity, therefore,
these can be taken as constant for all the hysteresis loops under consideration. Now value of other two parameters (C2, γ2) can be evaluate for different hysteresis loops, by repeating the same procedure as used for 1.0% strain
amplitude. Fig. 6(a) and 6(b) shows variation of C2 and γ2 with respect to plastic strain amplitudes.
30000 40000 50000 60000 70000 80000
0 0.5 1 1.5 2
Plastic Strain (%)
C
2
Pa
ra
m
e
te
r (M
Pa
)
C2 Exp. Fit
250 300 350 400 450 500 550 600
0 0.5 1 1.5 2
Plastic Strain (%)
G
a
m
m
a
2
P
a
ra
m
e
te
r
(Y
2
)
Gamma 2
Power Fit
(a) Variation of C2 (b) Variation of γ2
C2 and γ2 with respect to plastic strain amplitudes can be representing by equation as:
(
)
[
3.1 /2]
2
77000
1
e
pC
=
−
− Δε MPa and⎥ ⎥ ⎦ ⎤ ⎢
⎢ ⎣ ⎡
⎟⎟ ⎠ ⎞ ⎜⎜ ⎝ ⎛ Δ + =
−0.823
2
2 1 44 .
169
ε
pγ
(9)
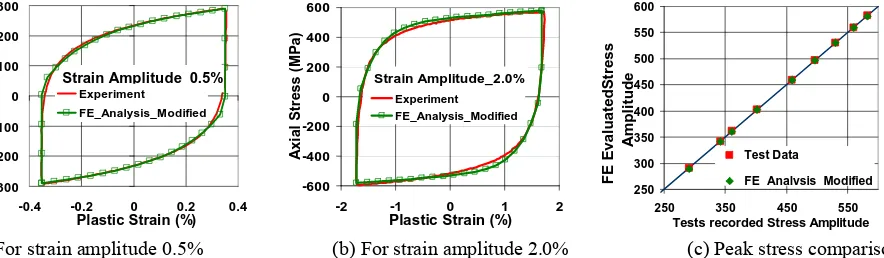
The stable stress-strain hysteresis loops of different strain amplitude are again simulated by FE analysis using Chaboche parameters as function of strain amplitude. The FE results are compared with experimental results, as shown in fig. 7. It is observed that by considering dependence of parameters on strain amplitude, the comparison with experimental results is nearly perfect. In this case, the peak stress response is exactly simulates (for different strain amplitudes) unlike the case in which size of yield surface (σo) is treated as constant, see fig. 3 and fig. 7.
Strain Amplitude_0.5%
-300 -200 -100 0 100 200 300
-0.4 -0.2 0 0.2 0.4
Plastic Strain (%)
Ax
ia
l S
tress (
M
P
a
)
Experiment FE_Analysis_Modified
Strain Amplitude_2.0%
-600 -400 -200 0 200 400 600
-2 -1 0 1 2
Plastic Strain (%)
A
x
ia
l S
tre
s
s
(
M
P
a
)
Experiment FE_Analysis_Modified
250 300 350 400 450 500 550 600
250 350 450 550
Tests recorded Stress Amplitude
FE E
va
luat
edS
tr
e
s
s
A
m
pl
it
ude
Test Data
FE Analysis Modified
(a) For strain amplitude 0.5% (b) For strain amplitude 2.0% (c) Peak stress comparison Fig. 7 Comparison of hysteresis loops and peak stress for various strain amplitude using individual/different set of
Chaboche parameters
Finally, it is clear from the above analysis that Chaboche model with proposed modifications, that is, dependence of model parameters on strain amplitude, is able to simulate the stable LCF response satisfactorily for all the different loading ranges considered.
Uniaxial Ratcheting Tests and Simulation using Chaboche Model
Uniaxial ratcheting tests are conducted to understand the material behaviour when subjected to cyclic loading in presence of sustained mean stress. Under such condition irreversible strain accumulation occurs with each cycle known as ratcheting strain, due to ratchet action. Uniaxial stress controlled ratcheting tests are conducted at various combinations of mean stress (M) and stress amplitude (A). From the analysis of strain history of these tests, ratcheting strain as well as strain range variation with cycle is evaluated. Ratcheting strain is taken to be the maximum values of strain in a cycle and strain range is taken as the difference of maximum and minimum strain. Chaboche three decomposed model has been used for the simulation of uniaxial ratcheting tests. Out of its seven parameters, the value of six parameters is evaluated using LCF tests data, as mentioned above. However, model’s seventh parameter, γ3, controls the rate of ratcheting. Therefore its vale needs to evaluate by tuning of uniaxial
ratcheting response. Test data of M120A360 (M is 120 MPa and A is 360 MPa) is used.
As discussed earlier that cyclic yield stress strongly depends on the strain amplitude/range. Therefore value of cyclic yield stress is evaluated on the basis of strain range prediction, as observed in actual test. For FE analysis other Chaboche model parameters are used corresponding to the stable strain range in the test. In the present analysis of these tests, FE simulation is performed for initial 100 cycles only.
First of all, for the evaluation of ratcheting parameter (γ3), simulation of M120A360 is carried out with
different values of γ3 (1, 1.3, and 1.5) and compared with experiment in fig. 8(a). From the figure, it is clear that
absolute values of ratchet strain accumulation are not matching in any of these cases. Chaboche model parameters are evaluated from stabilized hysteresis loops, which show significant hardening in comparison to monotonic response. In addition due to cyclic hardening, which takes place in initial few cycles before stabilization, actual accumulation will be more. In view of these, to account the cyclic hardening effect before stabilization, a constant shift is applied and predicted strain accumulations are re-plotted in fig. 8(b). From this figure, it is clear that out of various values, γ3 equal to 1.3 shows closer match with experiment. Value of parameter γ3 is equal to 1.3 and same
Uniaxial Ratcheting: Evaluation of γ3 0 2 4 6 8 10 12
0 20 40 60 80 100
No. of Cycles (N)
R a tc he ti ng S tr a in (% )
Experiment Gamma 3= 1.0 Gamma 3= 1.3 Gamma 3= 1.5
Uniaxial Ratcheting: Evaluation of γ3
(after rigid shift)
4 6 8 10 12
0 20 40 60 80
No. of Cycles (N) 100
Comparison of Strain Range
0 0.2 0.4 0.6 0.8
0 20 40 60 80 10
No. of Cycles (N)
St ra in R a ng e ( % ) R a tc het ing S tr a in ( % ) 0 Experiment FE Analysis Experiment Gamma 3= 1.0
Gamma 3= 1.3 Gamma 3= 1.5
(a) Accumulated ratchet strain (b) After rigid shift (C) Strain range
Fig. 8 Comparison of ratcheting strain response in FE analysis using Chaboche model with experiments.
From the analysis, it is observed that Chaboche model with proposed modifications is able to simulate ratcheting rate only. This is due to cyclic hardening of the material before stabilization. Further development in cyclic plasticity models is essential to account phenomena such as cyclic hardening/softening.
Fatigue-Ratcheting Tests on Elbows and Simulation
In comparison to other components of piping system, elbow is more flexible component and it leads to large deformation. Pressurized elbow when subjected to large amplitude bending loads, as in case of design basis earthquake load, undergoes radial dilation due to ratcheting. In order to understand this, four numbers of fatigue-ratcheting tests on 6″ NPS Sch 120 large radius elbows of SS304LN stainless steel material have conducted by the authors recently [12]. These tests are conducted under different combinations of internal pressure and in-plane reversible cyclic bending loading. There is requirement of 3-D FE modeling and analysis of these tests for simulation of the local as well as global response of the elbow.
M L K A B C D E F G H I J Fixed End Intrados 1
24 , 2 23 , 3 22 , 4 21 , 5 20 , 6 19 , 7 18 , 8 17 , 9 16, 10 15 , 11 14 , 12 Extrados 13 In tra d os Ex tr ad os Crown Crown 2 3 4 5 6 7 8 9 10 11 12 13 14 15 16 17 18 19 2 0 21 22 23 24 1
ERTSS_Thickness Variation in Axial Direction
10 11 12 13 14 15 16 17 18 19 20
0 15 30 45 60 75 9
Angle (Theta)
Th ic kn e ss (m m ) Intrados Intrados 0 0 10 30 50 70 80 90 100 110 130 150 170 180
Extrados
Extrados
(a) Grid marking to identify various locations (b) Thickness variation along axial direction at grid locations Fig. 9 Grid marking and measured thickness variation in elbow
Generally the elbow is modeled as uniformly thick and leads to considerable ease in modeling. In actual elbow, its thickness varies along axial as well as circumferential direction. During the elbow ratcheting tests, the thickness of elbow is measured at about 288 grid locations and it is found that the thickness variation is about ±23% with respect to average thickness, as shown in fig. 9. In view of it, effect of thickness variation on local and global response is studied here. Detailed 3-D non-linear FE analysis is performed on uniform average and actual thickness models. In view of the symmetry, only symmetric half domain is modeled, using 20 noded solid elements. Fig. 10(a) shows the FE model of elbow-pipe assembly for fatigue-ratcheting test, respectively.
analyses, local stress/strain pattern in elbow and gross deformation response, that is, load-load line displacement (L-LLD) response is evaluated.
Load-LLD Comparison: 1 & 10 Cycle
-150 -100 -50 0 50 100 150
-60 -40 -20 0 20 40 60
Load Line Displacement (mm)
Lo
ad
(
k
N)
Uniform Thk Model Actual Thk Model
Comparison of Hoop Strain
-2 0 2 4 6 8 10
0 2 4 6 8 10
Number of Cycles (N)
St
ra
in
(
%
)
Uni_ Crown _ID_ Hoop Act_ Crown _ID_ Hoop
(a) Fine Meshed FE model (b) Load-Load line displacement (c) Hoop strain at ID of crown of elbow Fig. 10 FE model and effect of thickness variation on global and local response of elbow
The gross deformation response of the two models is found similar, as shown in fig.10 (b) for 1st and 10th
cycle. However, comparison of local stress-strain response of the two models shows that uniform thickness model resulted in under prediction of local strain range and strain accumulation at crown region, as shown in fig. 10(c). From this analysis, it clear that local thickness variation has insignificant effect on gross deformation, however, it affects the local stress/strain response. Local strain range and accumulated strain are very important for fatigue damage/integrity calculations. In view of this, it is concluded that FE modeling with uniform thickness consideration leads to un-conservative assessment. Hence it is important to model actual elbow thickness variation in FE analysis.
FE analysis of elbow fatigue-ratcheting test, QCE_RAT_6_L1, is performed with actual thickness model using Monotonic stress-strain curve with Kinematic Hardening Law (M-KHL) model and Chaboche cyclic plasticity material models, as evaluated earlier. From the FE analysis, L-LLD and local strains at various locations have been evaluated and compared with the recorded in experiment.
Load-LLD Comparison: 1st Cycle
-150 -100 -50 0 50 100 150
-60 -40 -20 0 20 40 60
FE_Chaboche FE_MKHL Experiment
Load-LLD Comparison: 10th Cycle
-200 -150 -100 -50 0 50 100 150
-60 -40 -20 0 20 40 60
FE_Chaboche FE_MKHL Experiment
Fig. 11 Comparison of FE evaluated load-load line displacement (L-LLD) response with test.
Comparison of Hoop Strain: Crown OD
-1 1 3 5 7 9
0 2 4 6 8 10
Comparison of Hoop Strain: Crown ID
-2 0 2 4 6 8 10
0 2 4 6 8 10
Number of Cycles (N)
H
oop
S
tr
a
in (
%
)
Number of Cycles (N)
H
o
o
p
S
tr
a
in (%
)
Experiment Crown 1_G7 FE_Chaboche Experiment Crown 2_G19 FE_Monotonic Experiment Near Crown_G20
FE_Chaboche FE_M-KHL
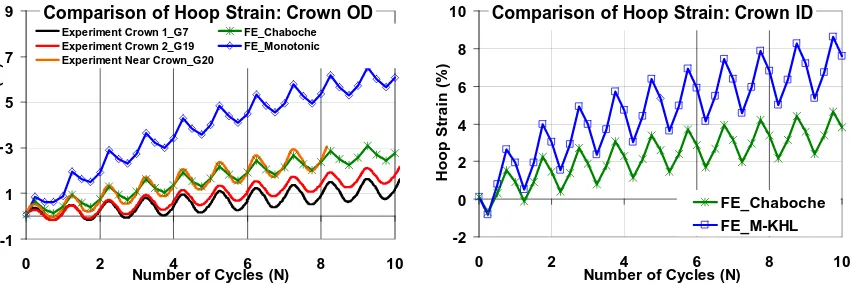
Fig. 12 Comparison of FE evaluated ratcheting strain with test recoded at inner and outer surface of Crown
Generally material shows extra hardening under multiaxial loading and non-proportional loading [13]. This is possibly the reason of under prediction of L-LLD response and over prediction of ratcheting strain by Chaboche model, even its parameters are evaluated using uniaxial tests data for this material. Further development in cyclic plasticity models is essential to account phenomena such as cyclic hardening/softening, extra hardening due to multiaxial and non-proportional loading.
CONCLUSION
The Experimental and analytical investigations have been carried out to understand cyclic plasticity response of SS304LN material. The insights gained from the tests followed FE analysis are discussed here:
• SS304LN material show cyclic hardening in initial 10 cycles, which is termed as primary cyclic hardening followed by cyclic softening or cyclic hardening depending upon the strain amplitude, until failure. For strain amplitude greater than 1.4%, the secondary stress-strain response hardens however, for strain amplitude less than 1.4%, it softens with cycles.
• Material showed non massing behavior therefore, single set of 3-decomposed Chaboche model parameters are unable to simulate cyclic plastic (LCF) response for different strain ranges. The size of cyclic yield surface (σo)
and 3-decomposed Chaboche model parameters like C2, γ2 andC3 are found to be strong function of strain
range.
• To simulate LCF response for different strain ranges, the dependence of yield surface (σo), C2, γ2 andC3 on
strain range must be accounted. Classical Chaboche model does not account it, since these parameters are assumed as material constants. In current paper, a modification to Chaboche model is proposed where these parameters are taken as function of strain range. The modified model very closely simulated the cyclic plastic (LCF) response for all nine LCF tests. Although it’s general numerical implementation needs to be developed. • Chaboche model with proposed modifications is able to simulate uniaxial ratcheting rate only. This is due to
cyclic hardening of the material before stabilization, which is not considered in Chaboche model.
• The FE Analysis of fatigue-ratcheting test on pressurized elbow showed that both the strain range and ratchet strain accumulation is more at inner side of crown region. Thus, it supports the test observation that in pressurized elbows crack initiates at the inner side of crown region only. Reasonable matching, with respect to local strain, is observed for Chaboche model.
Further development in cyclic plasticity models is essential to account phenomena such as cyclic hardening/softening, extra hardening due to multiaxial and non-proportional loading.
REFERENCES
[1] Boussaa D., Van, K.D., Labbe, P., Tang, H.T., “Fatigue–Seismic Ratcheting Interactions in pressurized Elbows”, Journal of Pressure Vessel Technology, Vol. 116, 1994, pp. 396-402.
[3] Garud, Y. S., Durlofsky, H. and Tagart, S. W, “Analysis and prediction of fatigue – ratcheting comparison with tests and code rules”, ASME PVP, Vol-366, 1993
[4] Yahiaoui, K., Moffat, D. G. and Moreton, D. N., “Response and cyclic strain accumulation of pressurised piping elbows under dynamic in-plane bending”, Journal of strain analysis, Vol-31-2, 1996
[5] Touble, F., Baly, N. and Lacire, M. H., “Experimental, Analytical and regulatory evaluation of seismic behaviour of piping system”, ASME Journal of Pressure Vessel Technology, Vol. 121, 1999 pp. 388-392.
[6] Suneel K. Gupta, Sumit Goyal, Vivek Bhasin, Vaze K.K., Ghosh A.K, Kushwaha H.S., “Ratcheting-Fatigue Failure of Pressurized Elbows made of Carbon Steel”, SMiRT-20, Finland, 2009
[7] Ohno, N., Kachi, Y., “A constitutive model of cyclic plasticity for nonlinear hardening materials” Journal of Appl. Mech., Vol. 53, 1986, pp. 395–403.
[8] Chaboche , J. L., “On some modifications of kinematic hardening to improve the description of ratcheting effects”, International Journal of Plasticity, Vol. 7, 1991, pp. 661–678.
[9] Hassan, T. and Kyriakides, S., “Ratcheting in cyclic plasticity, Part I: uniaxial behavior”, International Journal of Plasticity, Vol 8, 1992, pp. 91–116.
[10] SHAFIQUL, BARI, “Constitutive Modeling for Cyclic Plasticity and Ratcheting”, Ph.D Thesis, North
Carolina State University, 2001.
[11] Rahman, S. M., Hassan, T., Edmundo, C, “Evaluation of cyclic plasticity models in ratcheting simulation of straight pipes under cyclic bending and steady internal pressure”, International Journal of Plasticity,
Vol. 24, 2008, pp. 1756–1791.
[12] Sumit Goyal, Suneel K. Gupta, Vivek Bhasin, K. K. Vaze, A. K. Ghosh, S. Vishnuvardhan, M. Saravanan, DM. Pukazhendhia, P. Gandhi, G. Raghava,“Fatigue Ratcheting Investigation on Pressurised Elbows made of SS304 LN”, Fifth ICTACEM, 27-29 December 2010, pp. 578-580.