A Quantitative Exploration of Viral Energetics,
Genomics
,
and Ecology
Thesis by
Gita Mahmoudabadi
In Partial Fulfillment of the Requirements for the degree of Doctor of Philosophy
CALIFORNIA INSTITUTE OF TECHNOLOGY Pasadena, California
2018
ACKNOWLEDGEMENTS
There are many people to whom I am forever indebted. Without them, my journey in science may never have started or would not have been nearly as fulfilling. Without a doubt, my parents’ numerous sacrifices have served as the foundation for the incredible educational opportunities that I have received. I want to thank them and my sister for having held a fan on the sparks of my curiosity, and for giving me the courage to chase after my dreams. I am deeply grateful to my grandmother who has always encouraged me to pursue an academic life, believing that passing on one’s knowledge is the greatest form of public service.
Coming to Caltech was a dream come true. I am incredibly privileged for having been at this institution and for having learned from so many passionate scientists throughout the years. Above all, I am very lucky to have met Rob. I decided to join Rob’s lab after taking his course on Physical Biology of the Cell, which weaved together topics as seemingly disparate as thermodynamics and transcription. I remember leaving the class feeling inspired, a feeling that has prevailed the passage of time. Those early lectures made lasting impressions on me as is evident from the “street-fighting mathematics” approach employed in estimating the energetic cost of building a virus. Having now been behind the scenes, I know that Rob’s seamless performances and engaging books come at a high cost. I am very happy to have had a tough coach whose motto is “bloody drills and bloodless battles”.
I am also grateful to Rob for the chance to experience a side of biology that is often overshadowed. I was part of the first generation of spoiled graduate students who went to South Korea to TA for Rob’s Evolution course, which later convened in Indonesia for a biogeography field trip that included 4 AM hikes and boat trips to the Wallace Line. Besides the obvious cool-factor of cooking your breakfast at the summit of Mt. Batur using the heat from this volcano, or supping towards Alaska’s glaciers past the puzzled seals, Rob’s motivation for leading these adventures, in his own words, was to show us that “there is more to biology than PCRs”. I am greatly indebted to both the physicist Rob and the naturalist Rob. Much of my curiosity about the global distribution of viruses arises from learning about Wallace, Darwin, and their specimen collections on these trips.
committee and provided me great feedback. I would also like to thank Ron Milo and Michael Lynch who have been instrumental in our work on bioenergetics. I have also gained invaluable insight from my interactions with Bill Gelbart, Eddy Rubin, Markus Covert and David Baltimore who have reviewed our work on viral genomics. I would like to thank the Boundaries of Life collaborators, in particular Steve Quake, Nathan Wolfe, and Grant Jensen who have introduced me to the Shadow Life hypothesis. I would like to Linas Mazutis and his lab for helping us start single-virus, single-cell infection experiments. I would also like to thank Richard Murray and Michael Elowitz in whose labs I rotated and learned about cell-free synthetic circuits and epigenetic regulation. I am grateful to Niles Pierce and Linda Scott for welcoming my class to Caltech and guiding us through the first year.
It was a pleasure to mentor several undergraduate students: Adam Catching, Alison Cheung, Brian Silver, Matt Morgan, and Ana Mahmoudabadi. I thoroughly enjoyed and substantially benefited from these one-on-one mentoring experiences. I would also like to thank many former and current members of the Phillips lab whom I am lucky to have met and learned from: Maja Bialecka-Fornal, Kelsey Homyk, Franz Weinert, James Boedicker, Geoff Lovely, Lacramioara Bintu, Hernan Garcia, David Van Valen, Stephanie Johnson, Mattias Rydenfelt, Heun Jin Lee, Robert Brewster, Justin Bois, Yi-Ju Chen, Arbel Tadmor, Daniel Jones, Katie Miller, Celene Barerra, Jonathan Gross, Manuel Razo, Stephanie Barnes, Nathan Belliveau, Helen Foley, Griffin Chure, Soichi Hirokawa, Bill Ireland, Suzy Beeler, Vahe Galstyan, David Angeles, and Muir Morrison.
Stephanie Tzouanas, Alborz Mahdavi, and many others for their friendship. I would like to especially thank Parisa Farmand, Melika Motamedi, Zahra Daftarian, Sheliza Bhanjee, Aliyah and Nadia Saadein, Mariya Akbashev, Ghazal and Ava Motakef, Lynn Tsai, and Sam Amin for their help as citizen scientists on my experiments.
I don’t even know where to begin with thanking Reza Khiabani, my best friend and the love of my life. We would not have made it through several years of long-distance relationship had it not been for his unwavering love and encouragement, so I will end with a quote from Hafez. Thank you Reza for lighting up my world.
Even after all this time
the Sun never says to the Earth “you owe me.”
ABSTRACT
Over the past couple of decades, technological advancements in sequencing and imaging have unequivocally proven that the world of viruses is far bigger and more consequential than previously imagined. There are 1031 viruses estimated to inhabit our planet, outnumbering even bacteria. Despite their astronomical numbers and staggering sequence diversity, environmental viruses are poorly characterized. In this thesis we will demonstrate our three-pronged exploration of viruses through the lenses of energetics (Chapters 2 and 3), genomics (Chapter 4) and ecology (Chapter 5). We will first focus on one of the defining features of viruses, namely their reliance on their host for energy, and demonstrate the energetic cost of building a virus and mounting an infection. In our second study, we
PUBLISHED CONTENT AND CONTRIBUTIONS
Mahmoudabadi G, Milo R, & Phillips R. (2017) Energetic cost of building a virus.
Proceedings of the National Academy of Sciences 114(22):E4324-E4333. doi:10.1073/pnas.1701670114
G.M. initiated the project, carried out energetic cost estimates, prepared the data, and participated in the writing of the manuscript.
Mahmoudabadi, G., & Phillips, R. (2018) A comprehensive and quantitative exploration of thousands of viral genomes. eLife 7:e31955. doi: 10.7554/eLife.31955.001
!
TABLE OF CONTENTS
Acknowledgements………... . iv
Abstract ………... ... viii
Published Content and Contributions ………... . ix
Table of Contents ………... .... x
Chapter IV: A comprehensive and quantitative exploration of thousands of viral genomes ……… ... IV-1 4.1 Introduction ... IV-1 4.2 Exploring the NCBI viral database ... IV-8 4.3 Viral genome lengths, gene lengths and gene densities ... IV-11 4.4 Noncoding percentages of viral genomes ... IV-18 4.5 Viral functional gene categories ... IV-19 4.6 Viral genome organization ... IV-22 4.7 Discussion ... IV-25 4.8 Materials and Methods ... IV-27 4.9 Supplementary Information ... IV-32 4.10 References ... IV-41 Chapter V: Human Phageprints: Commensal phage communities reveal individual-specific and temporally-stable signatures ... V-1 5.1 Introduction ... V-1 5.2 Results ... V-7 A. Discovery of phage families ubiquitous across humans ... V-7 B. An exploration of three phage families reveal the presence of highly personal phage communities with varying degrees of conservation across different oral sites ... V-8 C. A bioinformatic search for the bacterial hosts ... V-18 D. Oral phage community temporal dynamics in the span of 30 days
... V-19 E. Phage community comparisons across siblings, couples, and
LIST OF ILLUSTRATIONS AND/OR TABLES
Number Page
Chapter II Figures
1. The distinction between direct and opportunity costs associated with synthesizing molecular building blocks ... II-2 2. The energetic cost of molecular building blocks. ... II-7 3. Growth yields per unit carbon consumed as a function of the heats of combustion of the carbon substrate ... II-14
SI Dataset
1. A detailed breakdown of the energetic cost of molecular building blocks depicted in Figure 2 ... II-20
Chapter III Figures
1. The energetics of a T4 phage infection ... III-8 2. The energetics of an influenza infection ... III-10 3. A breakdown of the direct cost (top) and the total cost (bottom) of various viral processes during T4 (left) and influenza (right) viral infections (normalized to the sum of all costs during an infection, as shown in the center of each pie chart) ... III-12 4. Generalizing viral energetics ... III-16 5. Evolutionary forces acting on genetic elements within viral genomesIII-20
Tables
1. The direct, opportunity, and total energetic costs of viral processes for T4 and influenza ... III-5
1. A breakdown of direct and opportunity costs associated with amino acids, DNA, RNA, and lipids in the context of heterotrophic A) bacterial and B) eukaryotic metabolism ... III-31
SI Tables
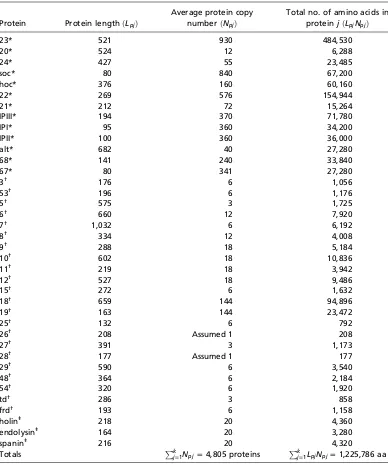
1. T4 bacteriophage structural proteins and their average copy numbers per virion ... III-44 2. Influenza A virus proteins and their average copy numbers per virion ... ... III-45
SI Datasets
1. A list of viruses and their associated costs used to estimate replication to translation cost ratios shown in Figure 4 ... III-55 2. A list of direct and total fractional cost estimates, !!, for genetic elements of lengths 1, 10, 100, 1000, and 10,000 base pairs across 30 dsDNA viruses (Figure 5) ... III-55 3. A detailed breakdown of opportunity and direct costs of building blocks across heterotrophic bacterial and eukaryotic metabolisms (using glucose as the sole carbon source) ... III-55
Chapter IV Figures
6. Normalized abundance of functional gene categories across different viral groups ... IV-21 7. Alignment of the most common gene order patterns for dsDNA bacterial viruses ... IV-25
Tables
1. Viral genomic statistics based upon different classification systems. . IV-15
SI Figures
1. Further exploration of the largest fraction of the eukaryotic virome: viruses of Opisthokonta supergroup (animals) ... IV-33 2. Histograms of genome length (Log10) across all complete viral genomes associated with a host ... IV-34 3. Exploring homology across genomes and proteins in gene order pattern C ... IV-36
SI Tables
1. Genome length statistics for viral groups across different classification systems (rounded to the nearest kilobase) ... IV-37 2. Median gene length statistics for viral groups across different classification systems (rounded to the nearest base) ... IV-38 3. Percent noncoding DNA (or RNA) for viral groups across different classification systems (rounded to the nearest percentage) ... IV-39
SI Text Files
5. BLASTP report for the capsid protein found in Acinetobacter phage Petty, Lelliottia phage phD2B, and Synechococcus phage S-CBP4 genomes ... IV-40 6. BLASTP report for the large terminase protein found in Acinetobacter phage Petty, Lelliottia phage phD2B, and Synechococcus phage S-CBP4 genomes .. IV-40
Chapter V Figures
14. A schematic summary of the main experimental and bioinformatic methodologies presented in this chapter ... V-32 15. Pairwise Pearson correlation coefficient values calculated for HB1 phage community compositions as a function of A) 98%, B) 97%, C) 95%, D) 90% and E) 80% sequence similarity thresholds for OTU formation . V-44 16. Rarefaction plot for HB1 marker using data from 3 samples, belonging to subject 6 supra-gingiva (red), subject 12 buccal mucosa (purple), and subject 17 sub-gingiva (blue) ... V-45 17. Rarefaction plots of HB1 marker segmented based on OTU relative abundance ... V-48 18. Sources of error and variation in experimental processes used in this study
... V-50 19. Standard deviations of OTU relative abundances calculated for all experimental processes ... V-51 20. Number of non-reproducible OTUs across three samples obtained from subject 37 tongue dorsum (HB1 marker), presented as a function of OTU relative abundance ... V-52 21. Panel A is the Pearson correlation matrix of all HB1 phageprints ... V-54
Tables according to base 4 arithmetic. The last letter in the barcode sequence is a parity letter and allows for detection of errors within the barcode sequence (See Error-detecting Barcode Design) ... V-40 SI Figures
3. HA phage family network. Two types of nodes exist: OTU nodes (purple), and subject nodes ... V-58 4. HA phage-host network (expanded version of SI Figure 3, showing each oral site) ... V-59 5. HB1 phage family network (expanded version of Figure 7) ... V-61 6. Percentage of HB1, PCA2 and HA phage family OTUs belonging to each taxonomic group identified in SI Table 1, SI Table 3, and SI Table 5 . V-71 7. The nucleotide alignment of HB1 phage family OTU representative sequences ... V-72
SI Tables
C h a p t e r I
Introduction
Over the past couple of decades, technological advancements in sequencing and imaging have unequivocally proven that the world of viruses is far bigger and more consequential than previously imagined (1-7). There are 1031 viruses estimated to inhabit our planet, outnumbering even bacteria (8, 9). Viruses have been shown to impact biogeochemical cycles (10-13) and evolution of host organisms (4, 14-16).
Despite their astronomical numbers and staggering sequence diversity (17, 18), we have large gaps in our understanding of environmental viruses. This is in part due to the field being at its infancy. It is also due to the conceptual and technical challenges that are unique to the study of viruses. For example, in contrast to ribosomal RNA sequences that are conserved across cellular genomes and serve as the basis for taxonomic and evolutionary studies, there are no universally conserved sequences within viral genomes. As a result, we have not yet been able to develop a genomic classification for viruses. Moreover, our understanding of the deep-time evolutionary history of viruses remains limited.
discovery of viral reverse transcription. The future of biology will also likely be impacted by the study of viruses that are caught breaking biology’s perceived rules.
Viruses have also offered us the platform and the tools for some of biology’s most infamous experiments. Hershey and Chase used a phage infection experiment to contest the popular assumption that proteins, rather than DNA, were responsible for inheritance (21). Luria and Delbruck also used a phage experiment to challenge Lamarckian evolution (22). Furthermore, Viruses have significantly contributed to our molecular biology toolbox (23). In lieu of recent technological advances, the study of viruses will inevitably result in even greater number of tools and insights.
In this thesis we will demonstrate our three-pronged exploration of viruses through the lenses of energetics (Chapters 2 and 3), genomics (Chapter 4), and ecology (Chapter 5). We will first focus on one of the defining features of viruses, namely their reliance on their host for energy, and demonstrate the energetic cost of building a virus and mounting an infection. Although many experimental studies make it clear that viruses are parasitic entities that hijack the molecular resources of the host, a detailed estimate for the energetic cost of viral synthesis was largely lacking. To quantify the energetic cost of viruses to their hosts, we first had to develop a framework for describing cellular energetic costs and their evolutionary consequences (Chapter 2).
influenza infection. The costs of these infections relative to their host’s estimated energy budget during the infection reveal that a T4 infection consumes about a third of its host’s energy budget, whereas an influenza infection consumes only about 1%.
Building on our estimates for T4, we show how the energetic costs of double-stranded DNA phages scale with the capsid size, revealing that the dominant cost of building a virus can switch from translation to genome replication above a critical size. Lastly, using our predictions for the energetic cost of viruses, we provide estimates for the strengths of selection and genetic drift acting on newly incorporated genetic elements in viral genomes, under conditions of energy limitation. This novel, physical approach to the study of viruses provides a promising path towards a deeper understanding of factors governing viral burst sizes, life-cycle strategies, and evolutionary trajectories.
In our second study we turned to another hallmark feature of viruses, namely their genomic diversity. We developed one of the largest surveys of complete viral genomes, providing a comprehensive and quantitative snapshot of viral genomic trends for thousands of viruses (Chapter 4). We explored the diversity and biases of the NCBI viral database and provided distributions of viral genome length, gene length, gene density, noncoding DNA (or RNA) percentage, and abundances of functional gene categories across thousands of viral genomes. We also created a coarse-grained method for visualizing viral genome organization. Because existing viral classification systems were developed prior to the sequencing era, we present our analysis in light of different classification systems in order to assess the utility of each classification in capturing genomic trends.
this reason, we chose to specifically target human oral phages to explore their communities as a function of space and time. Considering the lack of universal phage markers, we aimed to discover environment-specific markers so that we could study previously unexplored phage families. As we will demonstrate, this marker-based approach reveals phage community composition with a resolution that cannot be achieved through typical metagenomic studies. We will further demonstrate that at this resolution, phage community composition can serve as a fingerprint, or a “phageprint” – highly unique to each individual and stable over at least 30 days.
By creating sample collection kits and instructional videos, we crowd-sourced sample collection, thereby gathering ~700 samples from individuals living in different parts of the world, including samples from genetically related individuals and couples. To our knowledge, our study is one of the largest studies of human oral phages and the first to demonstrate the feasibility of human identification based on phage sequences. It highlights yet again the astounding viral sequence diversity that underlies the highly complex and personal phage communities.
1.1 References
1. Breitbart M & Rohwer F (2005) Here a virus, there a virus, everywhere the same virus? Trends in microbiology 13(6):278-284.
2. Suttle CA (2007) Marine viruses—major players in the global ecosystem. Nature Reviews Microbiology 5(10):801-812.
3. De Paepe M, Leclerc M, Tinsley CR, & Petit M-A (2014) Bacteriophages: an underestimated role in human and animal health? Frontiers in cellular and infection microbiology 4:39.
4. Quirós P, et al. (2014) Antibiotic resistance genes in the bacteriophage DNA fraction of human fecal samples. Antimicrobial agents and chemotherapy 58(1):606-609.
5. Wahida A, Ritter K, & Horz H-P (2016) The Janus-Face of bacteriophages across human body habitats. PLoS pathogens 12(6):e1005634.
6. Edlund A, Santiago-Rodriguez TM, Boehm TK, & Pride DT (2015) Bacteriophage and their potential roles in the human oral cavity. Journal of oral microbiology 7.
7. Norman JM, et al. (2015) Disease-specific alterations in the enteric virome in inflammatory bowel disease. Cell 160(3):447-460.
8. Suttle CA, Chan AM, & Cottrell MT (1990) Infection of phytoplankton by viruses and reduction of primary productivity. Nature 347(6292):467-469.
9. Bergh Ø, BØrsheim KY, Bratbak G, & Heldal M (1989) High abundance of viruses found in aquatic environments. Nature 340(6233):467-468.
10. Motegi C, et al. (2009) Viral control of bacterial growth efficiency in marine pelagic environments. Limnology and Oceanography 54(6):1901-1910.
12. Wilhelm SW & Suttle CA (1999) Viruses and nutrient cycles in the sea: viruses play critical roles in the structure and function of aquatic food webs. Bioscience 49(10):781-788.
13. Weitz JS & Wilhelm SW (2012) Ocean viruses and their effects on microbial communities and biogeochemical cycles. F1000 biology reports 4.
14. Modi SR, Lee HH, Spina CS, & Collins JJ (2013) Antibiotic treatment expands the resistance reservoir and ecological network of the phage metagenome. Nature 499(7457):219-222.
15. Stern A & Sorek R (2011) The phage host arms race: shaping the evolution of
microbes. Bioessays 33(1):43-51.
16. Stern A, Mick E, Tirosh I, Sagy O, & Sorek R (2012) CRISPR targeting reveals a reservoir of common phages associated with the human gut microbiome. Genome research 22(10):1985-1994.
17. Youle M, Haynes M, & Rohwer F (2012) Scratching the surface of biology’s dark matter. Viruses: Essential agents of life, (Springer), pp 61-81.
18. Paez-Espino D, et al. (2016) Uncovering Earth’s virome. Nature 536(7617):425-430. 19. Baltimore D (1970) RNA-dependent DNA polymerase in virions of RNA tumour
viruses.
20. Temin HM & Mizutani S (1970) RNA-dependent DNA polymerase in virions of Rous sarcoma virus. Nature 226(5252):1211-1213.
22. Luria SE & Delbrück M (1943) Mutations of bacteria from virus sensitivity to virus resistance. Genetics 28(6):491.
23. Rittié L & Perbal B (2008) Enzymes used in molecular biology: a useful guide. Journal of cell communication and signaling 2(1-2):25-45.
C h a p t e r I I
!
A Quantitative Framework for Estimating Cellular
Energetic Costs and their Evolutionary Consequences
2.1 Introduction
The possible interplay between the energetic cost of a cellular structure and its evolutionary fate is a subject that will become increasingly important as evolutionary cell biology matures as a science. All of biology starts at the level of the cell, which houses a myriad biochemical processes, information storage mechanisms, and physical substructures. To fully understand the mechanisms of evolution, it is ideal to start at the cellular level, where we can tease apart the ways in which complex molecular structures emerge from the assembly or transformation of building blocks such as amino acids, nucleotides, and lipid molecules. Thanks to the advances in biochemistry, much of the information to accomplish this task is either in hand or within reach. As a result, we argue it is time to outline a logical framework for quantifying the relationships between the energetic costs of cellular structures and their susceptibility to establishment and modification by the processes of evolution. Here, the phrase “cellular structure” will be used as an umbrella term broadly referring to any cellular entity built from building blocks, be that entity a few base pairs of DNA, an entire chromosome or an organelle.
these issues. We first aim to provide a clear depiction of the definitions and subtleties in performing energetic censuses of the cell. We then attempt to examine the evolutionary consequences of cellular structures based on their energetic cost. Finally, we highlight some of the remaining conceptual uncertainties in this area.
2.2 The energetic cost of a cellular structure
Cellular structures are assembled from molecular building blocks such as amino acids, nucleotides, lipids, and carbohydrates. If not provided by the outside environment, these building blocks must be synthesized within the cell by processes requiring carbon skeletons and the expenditure of energy. In fact, in the context of the metabolism of many bacteria, all building blocks as well as coenzymes and prosthetic groups can be synthesized from a small number of precursor metabolites (11). If some building blocks are available externally, the biosynthetic costs will be diminished, but there will still be costs of transformation to arrive at the full set of internal building blocks (the cost of converting one amino acid to another, for example). Here, we will assume that all molecular building blocks are derived from one carbon source, namely glucose, and further assume that sources of inorganic nitrogen and other trace elements are provided in excess within the growth media. These assumptions are especially applicable to growth conditions in the laboratory.
Moreover, the assembly cost of a cellular structure is obtained by adding up the requirements for construction of that structure from its molecular building blocks, e.g., the necessities for polymerizing a protein from its constituent amino acids, adding post-translational modifications, and folding the subsequent chain into the appropriate globular form. Finally, there will often be maintenance costs, e.g., accommodation of molecular turnover, and identification and elimination of cumulative errors.
have additional side effects (e.g., promiscuous binding or aggregation) that are difficult to quantify and irrelevant to construction/maintenance costs. What has been summarized in the paragraphs above, however, are the direct costs of a cellular structure, which do not fully describe the energetic consequences for the cell. We use PD to symbolize the unit of direct cost.
of macromolecules such as proteins from building blocks requires additional post-synthesis costs such as the cost of polymerization and maintenance. The polymerization costs per nucleotide or amino acid are denoted. Direct costs are shown by solid orange arrows, whereas the opportunity costs are denoted in shades of green and dotted lines. The same color scheme is used in Figure 2.
The construction and maintenance of a cellular structure represents a drain on resources that could otherwise be allocated to other cellular functions. When metabolic precursors that can be fully metabolized for ATP production are instead allocated as carbon skeletons to the production/maintenance of a particular cellular structure, this diversion eliminates their availability for other purposes, a consequence that we refer to as the opportunity cost. We use PO to symbolize the unit of opportunity cost.
the sole carbon source. B) The metabolic pathways from which the opportunity cost of each precursor metabolite can be estimated. From dihydroxyacetone phosphate (dhap) onwards, there are two molecules of each precursor metabolite generated. Precursor metabolites that are not implicated in the synthesis of building blocks are shown as grey circles. Positive and negative signs indicate gains and losses in ATPs or electron carrier molecules from the conversion of one precursor metabolite to another. The names for each precursor metabolite denoted are as follows: ribose-5-phosphate (r5p),
erythrose-4-phosphate (e4p, or eryP), alpha-ketoglutarate (αkg),
dihydroxyacetone phosphate (dhap), 3-phosphoglycerate (3pg), oxaloacetate (oaa), phosphoenolpyruvate (pep), pyruvate (pyr), acetyl-CoA (acCoA). C) The opportunity cost of each precursor metabolite estimated in the context of both heterotrophic bacteria and eukaryotic cells as detailed in the SI. D) The opportunity cost of a molecular building block is equivalent to the number of precursor metabolites and electron carrier molecules used during its synthesis times their respective opportunity costs. The direct cost of synthesizing a molecular building block is the number of ATP (or ATP-equivalent) hydrolysis events required during the synthesis of each building block (orange). All costs shown are estimated in the context of a heterotrophic bacterial metabolism. The average direct cost provided for building blocks does not include post-synthesis costs such as polymerization or maintenance. See SI Dataset 1 for further details.
Another source of opportunity cost is the pool of electron carrier molecules used in
the synthesis of molecular building blocks. If electron carriers such as NAD(P)H were to be
preserved rather than used in the synthesis of molecular building blocks, they would result in 2
and 2.5 ATP molecules within the bacterial and eukaryotic electron transport chain,
respectively (16). To distinguish between these two sources of opportunity cost, we have
otherwise, we will refer to the opportunity cost of a molecular building block as the sum of all opportunity costs.
Moreover, the total cost of producing a trait and diverting structures from alternative usage to do so is then the sum of the direct and opportunity costs,
!! =!!!+!!!, [1]
where all costs represent the cumulative expenditures over the entire lifespan of the cell. Whereas !! is expected to reflect ATP (and ATP-equivalent) hydrolysis reactions resulting in heat dissipation in the cell, !! will not be manifested in heat production, given that the ATP is not actually produced or consumed. We have used the symbol PT to denote the number of ATP formation/hydrolysis reactions associated with the total cost definition (Figure 2).
2.3 Which is more biologically relevant, the direct or the total cost?
on cellular energetics, however, have implicitly adhered to the total cost definition, thereby
including the opportunity costs of molecular building blocks (4, 9, 10, 14, 18).
The total cost definition is useful when the overall carbon source availability is limiting.
It also offers the advantage of comparison with results from chemostat experiments as a way
of determining the cost of a particular biological structure relative to the collective costs of a
cell at a given growth rate. During a chemostat experiment, the number of glucose molecules
required per unit time to grow cells at a set growth rate is measured. This number can then be
converted to an energetic value by assuming that every glucose molecule consumed by the cell
is fully metabolized. However, not all glucose molecules are used for energy production. In
fact, as we will briefly discuss in the following section, depending on the growth rate, the
majority of glucose molecules consumed may be converted to biomass. As a result, the cost of
a cell as measured through chemostat experiments includes both the direct and the
opportunity costs of cellular processes, and is inherently a total cost estimate. Thus, when
considering the energetic burden of a given process on a cell’s energy budget as measured by
chemostat experiments, the total cost definition provides a more meaningful approach.
2.4 What fraction of a cell’s total cost is direct cost?
One approach to estimating the total cost of a bacterium is to consider its mass in
carbon. With a doubling time of 30 minutes, an E. coli cell growing on glucose as its sole carbon source will be ≈50% carbon in dry weight which amounts to 0.1 pg (5 x 10⁹ carbon
molecules) for a cell with an approximate volume of 1 µm3 (19). Considering that every glucose molecule contributes 6 carbons, we can deduce that this bacterium’s energy and
carbon demand is met by ≈109 glucose molecules. Because every glucose molecule can
glucose molecules to a total energetic cost of ≈3 x 10¹⁰ P
T. This estimate for the total cost of E. coli is similar to those obtained from growth experiments in chemostats (10).
To obtain the direct cost estimate of a bacterial cell, we can make use of the fact that
translation incurs the greatest cost for cells (5, 9, 10, 14). An E. coli cell with a volume of 1 µm3 (the size can range between ≈0.5 and 2 µm3 depending on growth rate) contains on the order
of three million proteins (20). With an average protein length of 300 amino acids (21), an E. coli cell of this size will be comprised of 109 amino acids. The direct costs of polymerization (4 P
D) and synthesis from precursor metabolites (2 PD) (Figure 2) are 6 ATPs per amino acid, and thus the direct cost of translation is about ≈6 x 10⁹ P
D. We can compare this cost to the direct cost of genome replication, ≈ 108 P
D, for an E. coli genome that is comprised of 5 x 10⁶ base pairs. This is because the direct cost of polymerization (2 PD) and synthesis of nucleotides from precursor metabolites (11 PD) amounts to 13 PD per nucleotide. As such, the direct cost of translation far outweighs the direct cost of genome replication. The cost of transcription in both cellular and viral contexts has also been shown to be lower than the cost of translation (8, 10). Thus, we will take the direct cost of translation as a proxy for the sum of all direct costs.
With that assumption, the ratio of direct cost of an E. coli cell (≈6 x 10⁹ P
D) to its total cost (≈3 x 10¹⁰ P
T) is 0.2. This estimate suggests that the majority of glucose molecules consumed by an E. coli cell during rapid growth are not fully metabolized and instead are used to synthesize biomass.
2.5 Energy as one of several possible limiting factors to growth
conditions on a defined medium with a single compound providing carbon and energy, the growth yield per carbon consumed increases linearly with the substrate heat of combustion (which is inversely related to the degree of oxidation) up until a threshold value, thereafter leveling off (Figure 3). This suggests that below a critical substrate value of ≈10 kcal/g
Figure 3. Growth yields per unit carbon consumed as a function of the heats of combustion of the carbon substrate (which also serves as the source of energy). Results are taken from various sources in the literature; all results for eukaryotes involve fungi (mostly yeasts).
The energetic costs can still be evaluated as given here but their effect on growth will be diminished due to the greater impact of iron shortage on growth rate.
Regardless of the substrates being consumed, all aspects of cellular maintenance and growth require energy. Although the yields of microbes (per unit carbon consumed) grown on alternative substrates vary substantially with the nature of the substrate, the direct costs necessary to build an offspring cell are relatively constant. This is consistent with the positive scaling in Figure 3 (except in the above mentioned case of highly reduced substrates such as some alcohols and methane), and provides at least partial justification for using ATP as a universal currency as opposed to carbon or some other micronutrient.
2.6 The evolutionary implications of the energetic cost of a cellular structure Given a value for the total energetic cost of a cellular structure (or modification thereof), what are the overall evolutionary implications? To answer that question we need to consider two central issues: 1) what is the scaling of the cost of a cellular structure relative to the total cost of building and maintaining the cell? and 2) how do we convert the appropriately scaled measure of this energetic cost to a corresponding change in fitness. Supposing the cell has a baseline total energy budget per cell cycle of !! (which includes the costs of both growth
and maintenance, with a capital ! denoting a whole-cell cost), the addition of an energetic
burden to the trait under consideration alters the lifetime energy budget to !!! =!!
!!+!!!. Under the assumption that energy availability influences fitness, if the cell-division time is ! in
the absence of the trait, then we qualitatively expect this additional energetic investment in the trait to alter the cell-division time to !!! > !!.
without such an additional energetic investment. From standard haploid selection theory, the selective disadvantage of building a cellular structure in an energy-limited environment is defined as
! =!!!!!!!!ln2, [[2!]
where != ln 2 /! denotes an exponential rate of growth. Assuming that!Δ! = !!′−!! ≪
!! which we suspect will be valid for most single-gene modifications, we can simplify the
selective disadvantage to
! ≃!!!!! ln2. [[2!]
If we assume that energy is the only limiting factor and further assume that !! ≪!! so that
the increment in cell-division time scales proportionally with the increased investment, we can write
!! ≃ !! 1+!!! !! .
[3]
This then leads to the simple result that
s≃!!!
!! ln2, [4]
showing that the intrinsic selective disadvantage associated with the energetic cost of a trait under energy limited conditions scales directly with the proportional increase in the total energy demand per cell cycle.
It is important to note that there are some caveats with respect to the preceding derivation. First, it is assumed that the addition of the trait does not somehow alter the cell's basic metabolic makeup in ways that would modify the total baseline energy budget !!. Even if this
alteration to !! is small, which seems likely for cellular modifications involving just one or two
genes. Second, we have focused entirely on the bioenergetic costs of producing a trait. There
may be additional costly side effects, if for example a novel protein promiscuously interacts
with inappropriate substrates, aggregates with other cellular structures, and/or excessively
occupies cellular volume or membrane real estate.
2.7 Supplementary Information
2.7.A Opportunity cost of precursor metabolites in heterotrophic bacteria
In this section we will use the units of P, without any subscripts, to refer to ATP (and
ATP-equivalent) hydrolysis events (using the subscripts without having first derived the
opportunity cost of a metabolite is meaningless). Once we have derived the opportunity cost
of a precursor metabolite here in this section, we will accompany it with the symbol PO in later figures and tables to clearly mark these costs as opportunity costs. We will estimate the
opportunity cost of precursor metabolites,!!!""!#!"#$!%, by
!!""!#$%&'$( =!!!"#−!!!"#$%"&, [1]
where !!"#!represents the net energetic gain from the complete metabolism of a glucose
molecule into water and carbon dioxide, and !!"#$%"& is the net energetic gain from the partial
metabolism of a glucose molecule into a precursor metabolite. Under aerobic respiration, !!"#
is ≈ 26 P in E. coli (15). In the event that there is a net energetic cost from the conversion of
glucose into a precursor metabolite, !!"#$%"& will be a negative value.
In the synthesis of lipids, dihydroxyacetone-phosphate (dhap) is used as a precursor.
This precursor is generated during glycolysis (Figure 2). Each glucose molecule results in the
energetic cost of 2 P (!!"#$%"& =−2). The opportunity cost of two
dihydroxyacetone-phosphate molecules is 2 P greater than that of glucose, or 28 P (SI Eq. 1). The opportunity
cost of one dihydroxyacetone-phosphate molecule is therefore ≈ 14 P (Figure 2).
To simplify the opportunity cost estimates further, we could employ a shortcut. Rather
than estimating the opportunity cost of each precursor metabolite by calculating the !!"#$%"&
from glucose as the starting point, we could obtain the opportunity cost of metabolite j,
!!""!#$%&'$(! , from the opportunity cost of metabolite i, !!""!#$%&'$(! , by
!!""!#$%&'$(! =!!!""!#$%&'$(! −!!
!"#$%"&!→! , [2]
where !!"#$%"&!→! represents the net energetic gain from the conversion of metabolite i to
metabolite j.
For example, during glycolysis each molecule of dihydroxyacetone-phosphate is
converted to a molecule of 3-phosphoglycerate (3pg), resulting in the production of 1 NADH
molecule and 1 ATP. In E. coli, each NADH molecule results in the production of ≈ 2 ATP
molecules under aerobic conditions (11); therefore the net energetic gain from this conversion
is ≈ 3 P. Hence, the opportunity cost of each 3-phosphoglycerate molecule would be ≈ 11 P,
which is 3 P less than the opportunity cost of a dihydroxyacetone-phosphate molecule (SI Eq.
2).
If not used as a precursor, 3-phosphoglycerate is converted to phosphoenolpyruvate
(pep) in glycolysis (Figure 2). In this process, however, there is zero energy expenditure or
gain. As such, the opportunity cost of a phosphoenolpyruvate molecule is the same as that of a
3-phosphoglycerate molecule’s, which is ≈ 11 P. Both of these precursors come before
pyruvate (pyr) in glycolysis. In converting a phosphoenolpyruvate molecule into a pyruvate
therefore ≈ 10 P (1 P less than a phosphoenolpyruvate opportunity cost) (Figure 2). Pyruvate
can be converted to oxaloacetate (oaa) with the expenditure of 1 ATP. The opportunity cost of
oxaloacetate is ≈ 11 P (10 P + 1 P) (Figure 2).
Pyruvate is further converted to acetyl-CoA (acCoA), and in the process one molecule
of NADH is generated, which is equivalent to 2 P (Figure 2). The opportunity cost of
acetyl-CoA is therefore ≈ 8 P (10 P - 2 P) (Figure 2). One molecule of acetyl-CoA and one molecule
of oxaloacetate are then eventually converted to alpha-ketoglutarate (αkg) (Figure 2). The sum
of the opportunity costs of acetyl-CoA (8 P) and oxaloacetate (11 P) is 19 P, and because 1
molecule of NADH is generated in their conversion to alpha-ketoglutarate, the opportunity
cost of alpha-ketoglutarate is ≈ 17 P (or, 19 P – 2 P) (Figure 2). Similarly, alpha-ketoglutarate
is eventually converted to oxaloacetate, and 2 NADH, 1 GTP, and 1 FADH2 molecules are
generated (Figure 2). This is a net gain of ≈ 6 (assuming 1 P from each FADH2), reducing the
opportunity cost of oxaloacetate to ≈ 11 P (17 P – 6 P). Note, this is consistent with the
opportunity cost of oxaloacetate derived from the anaplerotic pathway described earlier (the
conversion of pyruvate to oxaloacetate via the pyruvate decarboxylase enzyme).
Glucose can also be converted to ribose-5-phosphate (r5p) in the pentose phosphate
pathway, and in the process 2 NADPH molecules are generated, which is equivalent to 4 P
(Figure 2). We subtract 4 P from the possible 26 P that glucose would be converted to under
respiratory conditions, and we arrive at 22 P as the opportunity cost of ribose-5-phosphate (SI
Eq. 1) (Figure 2). The same calculation can be used for erythrose-4-phosphate (e4p), resulting
2.7.B Opportunity cost of precursor metabolites in heterotrophic eukaryotes
To estimate the opportunity costs of precursor metabolites in heterotrophic
eukaryotes, we can carry out very similar calculations to those performed for heterotrophic
bacteria. For eukaryotes, !!!", or the total energetic gain from the complete metabolism of a
glucose molecule into carbon dioxide and water is higher. This is because each NAD(P)H and
FADH2 molecule results in a higher number of ATPs within the mitochondrial electron
transport chain compared to the bacterial electron transport chain. Specifically, each
NAD(P)H molecule is equivalent to ≈ 2.5 P and each FADH2 molecule corresponds to ≈ 1.5
P ((16),(22) pages 517-518), resulting in 30-32 P per glucose molecule. Note, the theoretical
yield of 38 P per glucose molecule has been shown to be an overestimate due to the outdated
assumptions that each NAD(P)H molecule is equivalent to 3 P and that each FADH2 molecule
generates 2 P (16). We will therefore use 32 P as !!"#.
Each glucose molecule results in the production of two dihydroxyacetone-phosphate
molecules, with this process having a net energetic cost of 2 P. The opportunity cost of two
dihydroxyacetone-phosphate molecules is 2 P greater than that of glucose, or 34 P (SI Eq. 1).
The opportunity cost of one dihydroxyacetone-phosphate molecule is therefore 17 P (Figure
2). As described earlier, in the conversion of dihydroxyacetone-phosphate molecule into a
3-phosphoglycerate molecule, 1 NADH and 1 ATP molecules are produced. This is equivalent
to a net energetic gain of ≈ 3.5 P. The opportunity cost of a 3-phosphoglycerate molecule is
therefore ≈ 13.5 P (17 P – 3.5 P) (SI Eq. 2) (Figure 2).
The opportunity cost of a phosphoenolpyruvate is the same as that of a
3-phosphoglycerate, which is ≈ 13.5 P. In converting phosphoenolpyruvate into pyruvate, there
therefore ≈ 12.5 P. Pyruvate can be converted to oxaloacetate with the expenditure of 1 ATP. Hence, the opportunity cost of oxaloacetate will be ≈ 13.5 P.
Pyruvate is converted to acetyl-CoA, and in the process one molecule of NADH is
generated. As a result, the opportunity cost of acetyl-CoA is ≈ 10 P (12.5 P – 2.5 P). One molecule of acetyl-CoA and one molecule of oxaloacetate are converted to alpha-ketoglutarate
in the TCA cycle. The sum of the opportunity costs of acetyl-CoA (10 P) and oxaloacetate
(13.5 P) is 23.5 P, and because 1 molecule of NADH is generated in their conversion to
alpha-ketoglutarate, the opportunity cost of alpha-ketoglutarate is ≈ 21 P (23.5 P – 2.5 P). Alpha-ketoglutarate is eventually converted to oxaloacetate, and 2 NADH, 1 GTP, and 1 FADH2
molecules are generated. This is a net gain of ≈ 7.5 P (assuming 1.5 P from each FADH2),
reducing the opportunity cost of oxaloacetate to ≈ 13.5 P (21 P – 7.5 P). Note, this is again consistent with the opportunity cost of oxaloacetate derived from the anaplerotic pathway.
Glucose can also be converted to ribose-5-phosphate in the pentose phosphate
pathway, and in the process 2 NADPH molecules are generated, which is equivalent to 5 P.
The opportunity cost of ribose-5-phosphate is thus ≈ 27 P. The same calculation can be used for erythrose-4-phosphate, resulting in ≈ 27 P as its opportunity cost.
2.8 References
1. Berg JM, Tymoczko JL, & Stryer L (2012) Biochemistry 7th Ed.
2. Voet D & Voet JG (2011) Biochemistry, 4-th Edition. New York: John Wiley& Sons
Inc:492-496.
3. Bauchop T & Elsden SR (1960) The growth of micro-organisms in relation to their
energy supply. Microbiology 23(3):457-469.
4. Atkinson DE (1971) Adenine nucleotides as universal stoichiometric metabolic
coupling agents. Advances in enzyme regulation 9:207-219.
5. Stouthamer AH (1973) A theoretical study on the amount of ATP required for
synthesis of microbial cell material. Antonie van Leeuwenhoek 39(1):545-565.
6. Tempest DW & Neijssel OM (1984) The status of YATP and maintenance energy as
biologically interpretable phenomena. Annual Reviews in Microbiology 38(1):459-513.
7. Russell JB & Cook GM (1995) Energetics of bacterial growth: balance of anabolic
and catabolic reactions. Microbiological reviews 59(1):48-62.
8. Mahmoudabadi G, Milo R, & Phillips R (2017) Energetic cost of building a virus.
Proceedings of the National Academy of Sciences 114(22):E4324-E4333.
9. Akashi H & Gojobori T (2002) Metabolic efficiency and amino acid composition in
the proteomes of Escherichia coli and Bacillus subtilis. Proceedings of the National
Academy of Sciences 99(6):3695-3700.
10. Lynch M & Marinov GK (2015) The bioenergetic costs of a gene. Proceedings of the
National Academy of Sciences 112(51):15690-15695.
11. Neidhardt FC, Ingraham JL, & Schaechter M (1990) Physiology of the bacterial cell:
12. Geiler-Samerotte KA, et al. (2013) Quantifying condition-dependent intracellular
protein levels enables high-precision fitness estimates. PloS one 8(9):e75320.
13. Dekel E & Alon U (2005) Optimality and evolutionary tuning of the expression level
of a protein. Nature 436(7050):588-592.
14. Wagner A (2005) Energy constraints on the evolution of gene expression. Molecular
biology and evolution 22(6):1365-1374.
15. Kaleta C, Schäuble S, Rinas U, & Schuster S (2013) Metabolic costs of amino acid
and protein production in Escherichia coli. Biotechnology journal 8(9):1105-1114.
16. Silverstein T (2005) The mitochondrial phosphate‐to‐oxygen ratio is not an integer.
Biochemistry and Molecular Biology Education 33(6):416-417.
17. Andersen KB & von Meyenburg K (1980) Are growth rates of Escherichia coli in
batch cultures limited by respiration? Journal of Bacteriology 144(1):114-123.
18. Craig CL & Weber RS (1998) Selection costs of amino acid substitutions in ColE 1
and colIa gene clusters harbored by Escherichia coli. Molecular biology and evolution
15(6):774-776.
19. Milo R, Jorgensen P, Moran U, Weber G, & Springer M (2010) BioNumbers—the
database of key numbers in molecular and cell biology. Nucleic acids research 38(suppl
1):D750-D753.
20. Milo R (2013) What is the total number of protein molecules per cell volume? A call
to rethink some published values. Bioessays 35(12):1050-1055.
21. Milo R & Phillips R (2015) Cell biology by the numbers (Garland Science).
22. Berg JM, Tymoczko JL, & Stryer L (2002) Biochemistry. 5th. (New York: WH
C h a p t e r I I I
!
Energetic Cost of Building a Virus
!
3.1 Introduction
Viruses are biological ‘entities’ at the boundary of life. Without cells to infect, viruses as we
know them would cease to function, as they rely on their hosts to replicate. Though the
extent of this reliance varies for different viruses, all viruses consume from the host’s energy
budget in creating the next generation of viruses. There are many examples of viruses that
actively subvert the host transcriptional and translational processes in favor of their own
replication (1). This viral takeover of the host metabolism manifests itself in a variety of
forms such as in the degradation of the host’s genome or the inhibition of the host’s mRNA
translation (1). There are many other experimental studies (discussed in the SI) (2-6) that
demonstrate viruses to be capable of rewiring the host metabolism. These examples also
suggest that a viral infection requires a considerable amount of the host’s energetic supply.
In support of this view are experiments on T4 (7), T7 (8), Pseudoalteromonas phage (9), and
Paramecium bursaria chlorella virus-1 or PBCV-1 (10), demonstrating that the viral burst
size correlates positively with the host growth rate. In the case of PBCV-1, the burst size is
reduced by 50% when its photosynthetic host, a freshwater algae, is grown in the dark (10).
Similarly, slow growing E. coli with a doubling time of 21 hours affords a T4 burst size of
just one phage (11), as opposed to a burst size of 100-200 phages during optimal growth
conditions.
These fascinating observations led us to ask the following questions: what is the
host cell? To our knowledge, the first attempt to address these problems is provided through a kinetic model of the growth of Qß phage (12). A more recent study performed numerical simulations of the impact of a phage T7 infection on its E. coli host, yielding important insights into the time course of the metabolic demands of a viral infection (13).
To further explore the energetic requirements of viral synthesis, we made careful estimates of the energetic costs for two viruses with very different characteristics, namely the T4 phage and the influenza A virus. T4 phage is a double-stranded DNA (dsDNA) virus with a 169 kb genome that infects E. coli. The influenza virus is a negative-sense, single-stranded RNA virus (-ssRNA) with a segmented genome that is 10.6 kb in total length. The influenza virus is a eukaryotic virus infecting various animals, with an average burst size of 6000, though note that the burst size depends upon growth conditions (14). Similar to many other dsDNA viruses, T4 phage infections yield a relatively modest burst size, with the majority of T4 phages resulting in a burst size of approximately 200 during optimal host growth conditions (15). To determine the energetic demand of viruses on their hosts, the cost estimate for building a single virus has to be multiplied by the viral burst size and placed in the context of the host’s energy budget during the viral infection.
3.2 Energetic cost units and definitions
Given that the energetic processes of the cell take place in many different energy
currencies ranging from ATP and GTP hydrolysis to the energy stored in membrane
potentials, it is important to have a consistent scheme for reporting those energies.
Adenosine triphosphate (ATP) serves as the most common energy currency of the cell, a
function that is universally conserved across all known cellular life-forms (16, 17). Under
physiological conditions, the hydrolysis of ATP usually releases about -50 kJ/mol (16, 18). In
addition to ATP, which most commonly serves as the energy currency of the cell, there are
other nucleoside triphosphates such as GTP that are approximately energetically equivalent
to ATP. We will refer to these molecules as ATP-equivalent.
We follow others in their reporting of cellular costs by using the number of ATP
(and ATP-equivalent) hydrolysis events as a proxy for energetic cost. Similar to Lynch and
Marinov (19), we will use the symbol P as a shorthand notation to represent an ATP (or an
ATP-equivalent) hydrolysis event. We will additionally employ subscripts to clearly label the
results obtained under different energetic cost definitions, which have already been
introduced in Chapter II (e.g. opportunity cost denoted by PO, direct cost denoted by PD,
and total cost denoted by PT). Lastly, in reporting some of our final cost estimates we will
convert the number of ATP (or ATP-equivalent) hydrolysis events to units of Joules and kBT
by assuming 50kJ of negative free energy change per mole of P at physiological conditions.
As a reminder of topics discussed in Chapter 2, the distinction between total and
direct cost definitions is that under the total cost definition, in addition to accounting for
direct costs, we attribute an energetic cost to the building blocks that are usurped from the
example, the direct cost definition is the more appropriate choice when estimating heat
production and power consumption of a viral infection (SI sections B, K). The total cost
definition, on the other hand, is aligned with traditional energetic cost estimates made from
growth experiments in chemostats, where substrate consumption and cell yield is monitored,
and allows for a clear comparison between the cost of an infection and the cost of a cell.
This is because the cost of a cell, derived through chemostat experiments, implicitly includes
the opportunity cost component, which is the cost of diverting precursor metabolites from
energy-producing pathways towards the synthesis of molecular building blocks. And while
our approach would certainly benefit from detailed experimental studies that reveal the
fluxes in the host metabolome during an infection, the assignment of an energetic value to
each metabolite allows us to simplify the problem from reporting changes in the
concentration of hundreds of metabolites to reporting a single energetic value associated
with the viral infection. This value can then be compared to the cellular energy budget.
We will generally estimate the cost of a certain viral process for a single virus, and
then multiply this cost by the viral burst size to determine the infection cost of a given
process. Subscript v will denote the cost estimates made for a single virus, and the subscript i
will refer to a cost estimate made for an infection. We relegate the energetic cost estimates
for all viral processes to the SI sections C through I.
3.3 The energetic costs of T4 and Influenza
By estimating the energetic costs of influenza and T4 life-cycles, we show that
surprisingly the cost of synthesizing an influenza virus and a T4 phage are nearly the same
(Table 1). The outcome of the analysis to be discussed in the remainder of the chapter is
viruses, the energetic cost of translation outweighs other costs (Table 1, Figures 1, 2, 3), though as we will show at the end of the chapter, since translation scales with the surface area of the viral capsid and replication scales as the volume of the virus, for double-stranded DNA phages larger than a critical size, the replication cost outpaces the translation cost.
To get a sense for the numbers, here we provide order-of-magnitude estimates of both the costs of translation and replication and refer the interested reader to the SI sections C through I for full details. As detailed in the SI Tables 1 and 2, both T4 and influenza are comprised of about 106 amino acids. We can estimate the total cost of translation by appealing to a few simple facts. First, the average opportunity cost per amino acid is about 30 PO. Second, the average direct cost to produce amino acids from precursor metabolites is 2 PD per amino acid (SI Figure 1). Finally, each polypeptide bond incurs a direct cost of 4 PD. We can see that the total cost of an amino acid is approximately 36 PT (30 PO + 6 PD). As a result, the translational cost of an influenza virus and a T4 phage both fall between 107 to 108 PT (Table 1).
opportunity costs do not exactly match up to the total costs presented in this table).
The cost of viral replication can be approximated in a similar fashion: we have to
consider that the T4 genome is comprised of roughly 4x10⁵ DNA bases and that the
influenza genome is composed of an order of magnitude fewer RNA bases (≈104). The total
costs of a DNA nucleotide and an RNA nucleotide, including the opportunity costs as well
as the direct costs of synthesis and polymerization, are approximately 50 PT (SI Figure 1, SI
Dataset 3). As a result of T4’s longer genome length, its total cost of replication (≈107 P T) is
about an order of magnitude higher than that of an influenza genome (Table 1, Figure 1,
translation (step 4), genome replication (step 5), and genome packaging (step 7) are shown. See SI sections C through I and Table 1.
The cost estimates of different viral processes during T4 and influenza infections are
summarized in Figures 1-3 and Table 1. The overall cost of a T4 infection is obtained by the
sum of replication (!!"#/!), transcription (!!"/!!), translation (!!"/!!), and genome
packaging (!!"#$/!) costs required during the infection (SI sections C-I, Table 1, Figure 1,
Figure 3). These costs together amount to ≈3 x 10⁹ P
D in direct cost and 1 x 10¹⁰ PT in total
cost (SI sections C-I, Table 1, Figure 1, Figure 3, assuming a burst size of 6000). The total
cost of a T4 infection is also equivalent to the aerobic respiration of ≈4 x 10⁸ glucose
molecules by E. coli (26 ATP per glucose (20)). Alternatively, it is equivalent to ≈2 x 10¹¹ k BT
Figure 2. The energetics of an influenza infection. The direct and total costs
of viral processes are denoted and can be distinguished by their units (PD and
PT, respectively). The energetic requirements of viral entry (steps 2,3),
genome replication (step 8) and viral exit (step 10) are shown. See SI sections C through I and Table 1.
Similarly, the cost of an influenza infection is obtained by adding up the costs of
entry (!!"#$%), intracellular transport (!!"#$%&'/!), replication (!!"#/!), transcription (!!"/!),
translation (!!"/!), and exit (!!"#$/!) required during the infection (SI sections C-I, Table 1,
Figure 2, Figure 3). These processes have a cumulative cost of ≈8 x 10¹⁰ P
D and 6 x 10¹¹ PT ,
for the assumed burst size of 200. The sum of costs in an influenza infection (6 x 10¹¹ P
T) is
equivalent to the aerobic respiration of ≈2 x 10¹⁰ glucose molecules by a eukaryotic cell (32
ATP per glucose). It is also equivalent to ≈1013 k
BT. It is interesting to note that for both
viral infections the opportunity cost components are the dominant component of the total
Figure 3. A breakdown of the direct cost (top) and the total cost (bottom) of various viral processes during T4 (left) and influenza (right) viral infections (normalized to the sum of all costs during an infection, as shown in the center of each pie chart). The direct cost of a T4 phage infection is approximately 3 x 10⁹ P
D (top) while the total cost is 1010 PT (bottom). The
direct and total costs of an influenza infection are approximately ~8 x 10¹⁰ P D
and 6 x 10¹¹ P
T, respectively. Numbers are rounded to the nearest percent,
and viral processes costing below 0.5% of the infection’s cost are not shown. See SI sections C through I for energetic cost estimates for viral entry, intracellular transport, transcription, viral assembly, and viral exit.
Even though individually a T4 phage and an influenza virus have comparable
is only ≈3% of the direct cost of an influenza infection. Similarly, the total cost of a T4
phage infection is ≈2% of the total cost of an influenza infection. To contextualize these
numbers, the host energy budget (or the host energetic cost, depending on the viewpoint of
a virus versus a cell) during the infection has to be taken into account. The total cost of a cell
is experimentally tractable through growth experiments in chemostats, in which cultures are
maintained at a constant growth rate. The number of glucose molecules taken up per cell per
unit time can be determined. The number of glucose molecules can then be converted to an
energetic supply by assuming typical conversion ratios of 26 or 32 ATPs per glucose
molecule depending on the organism (20). This energetic cost estimate will be a total cost
estimate because not all glucose molecules taken up by the cell are fully metabolized to
carbon dioxide and water to generate ATPs and are used as building blocks for biomass
components instead. During the cellular life-cycle, the cell has to double its number of
building blocks prior to division, and to do so, a fraction of glucose molecules taken up is
diverted away from energy production towards biosynthesis pathways. As such, cellular
energetic cost estimates that are derived from chemostat experiments are total cost estimates
because they report on the combined opportunity and direct costs of a cell.
Based on chemostat growth experiments (19), the total energy used by a bacterium
and a mammalian cell with volumes of 1 !"! and 2000 !"!, respectively, are ≈3 x 10¹⁰ P T
and ≈5 x 10¹³ P
T, during the course of their viral infections (SI section J). A simpler estimate
for arriving at the total cost of E. coli with a 30-minute doubling time is by considering the
dry weight of E. coli (≈0.6 pg at this growth rate) (22). Given that about half of the cell’s dry
weight is composed of carbon (22), an E. coli is composed of ≈2 x 10¹⁰ carbons, supplied
from ≈3 x 10⁹ glucose molecules, since each glucose contributes 6 carbons. With the 26
which is similar to the number obtained from chemostat growth experiments (19)(SI section
J).
Moreover, we estimate the fractional cost of a viral infection as the ratio of total cost
of an infection, !!/!, to the total cost of the host during the infection, !!/!. For the T4
infection with a burst size of 200 virions, !!/! ≈1 x 10¹⁰ P
T (Table 1) and !!/! ≈3 x 10¹⁰ PT,
therefore the fractional cost of the T4 infection is ≈0.3. Interestingly, a calorimetric study of
a marine microbial community demonstrated that 25% of the heat released by microbes is
due to phage activity. (23) If we assume that the majority of the direct cost of a cell is
associated with translation (19, 21), these calorimetric studies square well with our estimate
for the ratio of direct costs. In contrast, the influenza infection despite its larger burst size
(6000 virions) leading to a higher !!/! (≈6 x 10¹¹ P
T) has a fractional cost of just 0.01 as the
host cell is much bigger. Finally, we estimate that the heat release due to the T4 and
influenza viral infections are approximately 0.2 nJ and 2 nJ, respectively (SI section K). While
influenza infection results in an order of magnitude more heat, the average power of T4 and
influenza infections are surprisingly very similar, on the order of 200 fW (SI section K).
3.4 Scaling of viral energetics with size for phages
While we have concluded that for the influenza virus and the T4 phage the
translational cost outweighs the replication cost, the ratio of these two costs varies according
to the dimensions of a virus. In the case of T4 and influenza, these two viruses have
comparable dimensions and consequently were built from a similar number of amino acids
(SI Tables 1 and 2). However, because for double-stranded DNA phages, the capsid is
mostly composed of proteins whereas the virion interior is mostly dedicated to the genetic
object as it grows in size, the ratio of translational cost to replication cost also diminishes
with increasing radius of a spherical capsid. This simple rule governs not just the nucleotide
or amino acid composition of a virus, but more fundamentally, it governs the elemental