Statistical Analyses of Missing Translations in Simultaneous Interpretation
Using a Large-scale Bilingual Speech Corpus
Zhongxi Cai
1, Koichiro Ryu
2, Shigeki Matsubara
3 1Graduate School of Informatics, Nagoya University,2Tsu City College3Information and Communications, Nagoya University 1,3Furo-cho, Chikusa-ku, Nagoya, 464-8601, Japan
2Isshindennakano 157, Tsu, Mie, 514-0112, Japan
[email protected], [email protected], [email protected] Abstract
This paper describes statistical analyses of missing translations in simultaneous interpretations. Eighty-eight lectures from English-to-Japanese interpretation data from a large-scale bilingual speech corpus were used for the analyses. Word-level alignment was provided manually, and English words without corresponding Japanese words were considered missing translations. The English lectures con-tained 46,568 content words, 33.1% of which were missing in the translation. We analyzed the relationship between missing translations and various factors, including the speech rate of the source language, delay of interpretation, part-of-speech, and depth in the syntactic structure of the source language. The analyses revealed that the proportion of missing translations is high when the speech rate is high and delay is large. We also found that a high proportion of adverbs were missed in the translations, and that words at deeper positions in the syntactic structure were more likely to be missed.
Keywords:Simultaneous interpretation, Speech corpus, Bilingual corpus, Speech translation
1.
Introduction
In simultaneous interpretation, an interpreter must convey their translation to the target language while simultaneously listening to, comprehending, and memorizing the content of the source language speech. This is challenging and in-volves a number of difficulties that can reduce the quality of the interpretation. If such difficulties can be detected auto-matically, a support environment for simultaneous interpre-tation that presents the speech content or provides candidate translations could be achieved.
Gile (1995) referred to interpretation difficulties as “prob-lem triggers”. Such triggers include the density of the source speech (e.g., the delivery rate and the density of in-formation in the content). In addition, unfamiliar names, numbers, and complex syntactic structures, etc. are chal-lenging for interpreters. Since most of the time interpreters work at near capacity, such additional challenges can lead to failure (Gile, 1999). Interpretation failures include er-rors, omissions, and infelicities (Gile, 2009). In this paper, omissions are used to identify when an interpreter has en-countered a difficulty.
Time constraints are severe in simultaneous interpretation such that it is impossible to translate all speech content; thus, omissions are inevitable (Dillinger, 1994). To im-prove interpretation quality or develop a method to train interpretation skills, several studies have investigated sions in simultaneous interpretation. Various types of omis-sions have been described and several factors related to omissions have been studied (Barik, 1994). However, these analyses, which were based on observation, did not clarify the correlation between the identified factors and the occur-rence of omissions.
In this paper, to detect occasions where interpreters would encounter difficulties, we statistically analyzed the correla-tion between source speech features and interpretacorrela-tion
con-ditions and the occurrence of missing translations. In the analyses, we used 88 lectures of English-to-Japanese (E-J) interpretation data from the Simultaneous Interpretation Database (SIDB) (Matsubara et al., 2002). Note that word-level alignments were created manually.
2.
Missing Translations in Simultaneous
Interpretation
In simultaneous interpretation, departures from the source speech in interpreters’ renditions include omissions, addi-tions, and errors. Omissions refer to items that are present in the source speech but not included in the translation (Barik, 1994). However, if an interpreter does not trans-late a lexically irrelevant repetition or a mistake in the source speech, such as a false start, it is not considered an omission because these are phenomena in spontaneous lan-guage. Barik classified omissions into four categories, i.e., skipping, comprehension, delay, and compounding omis-sions. Barik found that more qualified interpreters omit 5% to 10% of the source speech, and less qualified interpreters omit 20% to 25%. Dillinger (1994) investigated the differ-ences between experienced and inexperienced interpreters relative to comprehension and found that only 65% to 80% of propositions were processed accurately by experienced interpreters. However, although several factors relating to omissions, such as the rate of speech and delay, were refer-enced in these studies, the actual rate of speech and delay were not calculated. Thus, the correlation between the ex-tent of such factors and the occurrence of omissions was not evaluated.
Lecture Interpretation
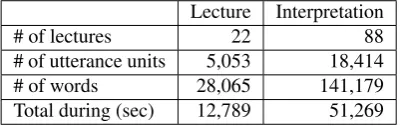
# of lectures 22 88
# of utterance units 5,053 18,414
# of words 28,065 141,179
[image:2.595.70.271.69.132.2]Total during (sec) 12,789 51,269 Table 1: Statistics of English lectures and E-J interpreta-tions
In this study, statistical analyses were conducted to inves-tigate correlations between missing translations in simulta-neous interpretation and these four factors.
3.
Overview of Analyses
As mentioned previously, factors such as high speech rates, complex syntactic structures, names, and numbers increase interpreter workload and can result in missing translations in simultaneous interpretation. According to Barik (1994), missing translations are primarily due to interpretation de-lay because the content currently being delivered by the source speaker may not register with the interpreter or may be ignored by the interpreter while they are speaking their translations. In addition, as speech content accumulates during the delay, the working memory of the interpreter may become overloaded; thus, they may fail to provide ac-curate translations (Mizuno, 2005).
In this study, the rate of speech, delay, types of words (part-of-speech), and a word’s depth in the syntactic structure were considered, and statistical analyses were conducted to investigate the relationship between the occurrence of miss-ing translations and the extent of these factors.
3.1.
Analyzed Data
In this study, we used data from the SIDB (Matsubara et al., 2002).
3.1.1. Scale and Features of Analyzed Data
The SIBD includes monologue data (lectures) and dialogue data, and their corresponding J-E and E-J interpretations. In our analyses, 22 English lectures interpreted by four in-terpreters (i.e., 88 E-J interpretations) were used. The data statistics are shown in Table 1.
The recorded speech data of both the source speakers and the interpreters were separated into utterance units of 200-millisecond or longer pauses. All utterance units were tran-scribed manually in compliance with the Corpus of Spon-taneous Japanese (CSJ) (Maekawa et al., 2000), and each utterance unit was assigned a start and end time. Sponta-neous language phenomena, such as fillers, repetitions, and mistakes, were tagged with discourse tags.
3.1.2. Word-level Translation Alignment
Word-level translation alignment is essential for analyses of missing translations in simultaneous interpretation. The data used in this research include translation alignment at an utterance unit level (Takagi et al., 2002). The analyzed data comprise 14,679 utterance unit level alignments. In addition, word translation correspondences were aligned
manually for each aligned utterance unit. Word-level trans-lation alignment was performed according to the following criteria.
• Content words of English speech must be aligned.
• Content words that have no corresponding words in the Japanese interpretation are aligned as “no corre-spondence”.
• Phrases and idioms are aligned as a single correspon-dence.
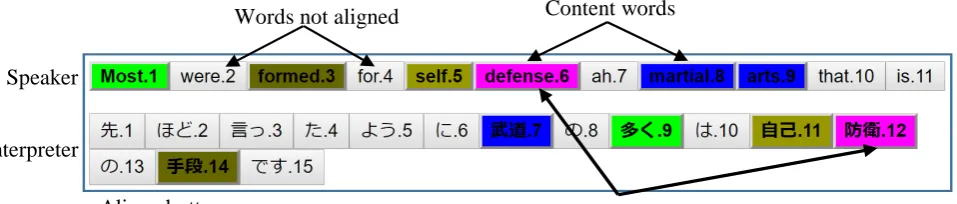
Figure 1 shows an example of word-level translation align-ment. Words highlighted with the same color in the speaker and interpreter utterances demonstrate translation corre-spondence. Words that are colored in the speaker utterance that do not have a corresponding color in the interpreter ut-terance are aligned as “no correspondence”. In addition, words not colored are not aligned (not content words).
3.2.
Frequency and Proportion of Missing
Translations
In this study, content words aligned as “no correspondence” are defined as missing translations in the simultaneous in-terpretation. As described previously, omissions in inter-pretations can be classified into different categories. In addition to the four categories defined by Barik (1994), omissions can be classified as conscious strategic omis-sions, conscious intentional omisomis-sions, conscious uninten-tional omissions, conscious receptive omissions and uncon-scious omissions (Napier, 2004). For example, interpreters can omit unnecessary words and summarize content to in-crease interpreter simultaneity in E-J simultaneous inter-pretation (Tohyama and Matsubara, 2006). Note that deter-mining the type of missing translation and whether a word is unnecessary are subjective operations (Barik, 1994). In addition, it is impossible to classify missing translations au-tomatically. However, to analyze missing translations as defined in previous studies, aligned words that satisfy the following conditions are excluded from the analyses:
• Determiners, existential there words, and prepositions (i.e., not content words).
• Pronouns. In E-J translations, English pronouns are usually omitted to obtain a more natural Japanese translation (Anzai, 2008).
• Words tagged as repetition and corrected mistakes. The Stanford Parser (The Stanford Natural Language Pro-cessing Group, 2002) was used to obtain part-of-speech in-formation.
In the following, non-excluded English words that are aligned are referred to as content words. Note that aligned phrases are considered a single content word.
Speaker
Aligned words
Words not aligned
Content words
Interpreter
[image:3.595.61.540.70.172.2]Aligned utterances
Figure 1: Word-level alignment
[image:3.595.311.534.236.311.2]# of content words 46,568 # of missing translations 15,431 Proportion of missing translations 33.1% Table 2: Content words and missing translations
Average rate of speech 3.04 Max rate of speech 16.67 Min rate of speech 0.69 Table 3: Rate of speech statistics (syllables/sec)
(1994). In Barik’s study, the proportion of omissions was calculated by dividing the number of omitted words by the total number of words in the given speech data. However, in this study, we only consider content words. Consequently, the denominator is relatively small; thus, the proportion of missing translations becomes relatively large.
4.
Analysis
Statistical analyses were performed to investigate the re-lationship between the occurrence of missing translations and the extent of speech rate, delay, part-of-speech, and a word’s depth in the syntactic structure.
4.1.
Speech Rate
4.1.1. Calculation of Speech Rate
The rate of an utterance unit was utilized in this study. Here, the rate of the utterance unit is calculated using the provided start and end times of the utterance. The speech rate unit is represented as “syllables/sec.” Table 3 shows the rate of speech statistics.
4.1.2. Relationship between Missing Translations and Speech Rate
The speech rates were divided into intervals, such as 1-2 syllables/sec, 2-3 syllables/sec and so on. The numbers of content words and missing translations in all utterance units for each interval were aggregated. The proportions of miss-ing translations to content words were calculated as the pro-portion of missing translations. Figure 3 shows the results of this analysis. Here, the horizontal axis is the speech rate and the vertical axis is the proportion of missing transla-tions. “1-2” on horizontal axis refers to speech rates greater
Missing Non-missing Total Low rate
(Top 25%) 3,685 7,957 11,642 High rate
(Bottom 25%) 4,102 7,540 11,642
Total 7,787 15,497 23,284
Table 4: Cross-tabulation of missing translations and rates of speech
or equal to 1 syllables/sec and less than 2 syllables/sec, the same to “2-3”, “3-4”, and so on. Note that only speech rate intervals with greater than 100 content words are shown in Figure 3. As can be seen, the proportion of missing transla-tions increases with an increasing speech rate. The propor-tion of missing translapropor-tions is approximately 20% when the speech rate is less than 2 syllables/sec, and when the speech rate is greater than 7 syllables/sec, approximately one-half of the content words are missing in the translation. To confirm that the proportion of missing translations of content words at higher speech rates is significantly greater than that at a lower speech rate, all content words were sorted in ascending order of the rate of the utterance unit in which the content word is included, and a chi-squared test was applied to the proportion of missing translations at the top 25% (slow) and bottom 25% (fast) speech rates. The chi-squared test is a statistical hypothesis test used to deter-mine whether data of different categories are independent. To conduct a chi-squared test, data are cross-tabulated. The cross-tabulation of the frequencies of missing translations and non-missing translations of the content words in the bottom and top 25% speech rates is shown in Table 4. As shown in Table 4, the proportion of missing translations for the lower speech rates is 31.7%, and that for the higher speech rates is 35.2%. By applying the chi-squared to Ta-ble 4, a significant difference was found between the pro-portion of missing translations at higher and lower speech rates (1% significance level). This implies that the propor-tion of missing translapropor-tions is significantly higher at high rates of speech than at low rates of speech.
4.2.
Delay
4.2.1. Measurement of Delay
Exclusions
Missing translations
Aligned utterances
Speaker
Interpreter
Figure 2: Sample of missing translation
10 20 30 40 50 60
1-2 2-3 3-4 4-5 5-6 6-7 7-8
P
ro
p
o
rti
o
n
o
f m
is
si
n
g
tr
an
sl
at
io
n
s (
%
)
Speech rate [syllable/sec]
Figure 3: Relationship between speech rate and proportion of missing translations
But I grew up in Europe
⚾ࡣ࣮ࣚࣟࢵࣃ࡛⫱ࡕࡲࡋࡓ
18.70 21.31
Aligned utterance Delay
[image:4.595.52.287.214.372.2] [image:4.595.314.530.296.369.2] [image:4.595.55.287.435.555.2](2.61 seconds)
[second] <Interpreter >
ф^ƉĞĂŬĞƌх
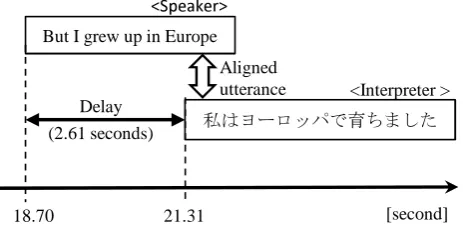
Figure 4: Delay measurement
lag between the start time of the source speaker’s utterance and the start time of the interpreter’s corresponding utter-ance (Ono et al., 2008). Figure 4 shows an example of the measurement of delay and Table 5 shows the delay statis-tics.
4.2.2. Relationship between Missing Translations and Delay
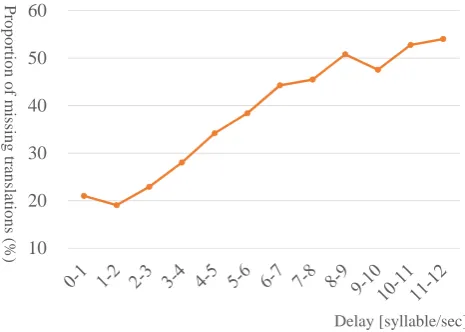
Delays were divided into intervals, such as 0-1 seconds, 1-2 seconds, and so on. The numbers of content words and missing translations in all utterance unit alignments whose delay falls in each delay interval were aggregated and the proportions of missing translations were calculated. Figure 5 shows the results of this analysis. “0-1” on horizontal axis refers to delays greater or equal to 0 second and less than 1 second, the same to “1-2”, “2-3”, and so on. Note that
Average delay 3.17 Max delay 22.90 Min delay 0.03 Table 5: Delay statistics (seconds)
Missing Non-missing Total Small delay
(Top 25%) 2,070 8,637 10,707 Large delay
(Bottom 25%) 4,403 6,304 10,707
Total 6,473 14,941 21,414
Table 6: Cross-tabulation of delay and missing translations
only delay intervals with greater than 100 content words are shown in Figure 5. As can be seen, when the delay is large, the proportion of missing translations becomes large. Approximately 20% of the content words are missed in the translation when the delay is less than 2 seconds. However, when the delay is greater than 10 seconds, 50% of the con-tent words are missed in the translation.
To confirm that the proportion of missing translations with larger delay is significantly greater than that with a smaller delay, all content words not excluded in the analyses were sorted in ascending order of the delay of which utterance unit alignment, and a chi-squared test was applied to de-termine if there is a significant difference between the pro-portion of missing translations in the top 25% (small) and bottom 25% (large) delays. The cross-tabulation is shown in Table 6.
As shown, the proportion of missing translations with small delay is 19.3% and that with larger delay is 41.1%. The re-sult of the chi-squared test indicates a significant difference between the proportions of missing translations at large and small delays (1% significance), which implies that, when the delay is large, the proportion of missing translations is significantly greater than when the delay is small.
4.3.
Part-of-Speech
4.3.1. Part-of-Speech Information
10 20 30 40 50 60
P
ro
p
o
rti
o
n
o
f m
is
si
n
g
tr
an
sl
at
io
n
s (
%
)
Delay [syllable/sec]
Figure 5: Relationship between delay of interpretation and proportion of missing translation
on
rivers
(root)
go
You
can
also
water
rafting
these
white
Head: rafting, noun
Example sentence:
[image:5.595.52.285.68.234.2]You can also go white water rafting on these rivers.
Figure 6: Part-of-speech of a phrase
Figure 6 shows the part-of-speech of a given phrase. Here, the syntactic structure of the sample sentence is shown, and “white water rafting” is aligned as a phrase. The head of this phrase is “rafting,” whose part-of-speech is a noun. Thus, the part-of-speech of the whole phrase is considered to be a noun.
[image:5.595.304.541.69.168.2]4.3.2. Correlation between Missing Translations and Part-of-Speech
Table 7 shows the results of the analysis of missing trans-lations and the part-of-speech. The results indicate that the proportion of adverbs in the missing translations is 26.8% greater than the average proportion of all missing transla-tions (33.1%). On the other hand, the proportion of nouns is 7.9% less than the average, which infers that nouns tend not to be omitted. Among nouns, the proportion of proper nouns in the missing translations is only 14%, approxi-mately 20% less than the average, which is the lowest for all parts-of-speech. In addition, the proportion of missing translations of numbers is 29.1%, which is 4% less than the average. However, names, which are proper nouns, and numbers are regarded as one of the problem triggers (Gile, 1995) and are likely to overload interpreters and be omitted in interpretations. The result of this analysis con-tradicts the results of previous studies; however, as names and numbers typically play important roles in speech, terpreters may preferentially pay more attention to such
in- Part-of-speech
Words Missing translations
Proportion of missing translation
Noun 5,230 20,742 25.2%
Verb 4,320 12,613 34.3%
Adjective 2,063 6,448 32.0%
Adverb 3,466 5,784 59.9%
Numeral 168 577 29.1%
Others 210 449 46.8%
Table 7: Relationship between part-of-speech and propor-tion of missing translapropor-tions
formation in order to translate them accurately. Another reason is that names that are unfamiliar to the interpreters and complex numbers, which likely increase the workload of interpreters, seldom appear in the speech in the analyzed data. Thus, names and numbers do not trigger problems for interpreters. However, adverbs, which play a modify-ing role in sentences, similar to adjectives, show a 27.9% greater proportion of missing translations than adjectives. To confirm that the proportions of missing translations are significantly different between each part-of-speech and the overall average, a chi-squared test was applied to the pro-portions of missing translations of each part-of-speech and the proportions of other content words. The results of the chi-squared test indicate that the proportions of missing translations of nouns, verbs, and adverbs differ significantly from that of the other content words (1% significance level). Note that the differences in the proportions of the missing translations between adjectives, numbers, and other content words are not significant. This implies that the proportion of missing translations of nouns, verbs, and adverbs differ significantly from that of the overall.
4.4.
Depth in Syntactic Structure
When the syntactic structure is complex, it becomes dif-ficult for interpreters to understand the information in the source speech and missing translations likely occur. Thus, it can be inferred that, as words are positioned more deeply in the syntactic structure, it is more likely that the given word will be omitted in the translation.
4.4.1. Measurement of Depth in Syntactic Structure Word depth in the syntactic structure was calculated us-ing a typed dependency representation derived usus-ing the Stanford Parser (The Stanford Natural Language Process-ing Group, 2002). Here, the root word of a sentence is at depth 0, and the number of steps from the root to a given word is considered the depth of that word. While there are several routes from the root to a given word, in this case, the shortest route is chosen. When a content word is aligned as a phrase, the depth of the head of the phrase is considered as the depth of the phrase. Figure 7 shows an example of word depth in a syntactic structure.
4.4.2. Relationship between Missing Translations and Depth in Syntactic Structure
[image:5.595.52.274.329.413.2](root)
go
You
can
also
white water
rafting
on these
rivers
1
0
2
Depth=1
D
ep
th
Example sentence:
[image:6.595.304.542.67.230.2]You can also go white water rafting on these rivers.
Figure 7: Word depth in syntactic structure
Missing Non-missing Total Shallow position
(Top 25%) 3,775 7,867 11,642
Deep position
(Bottom 25%) 4,261 7,381 11,642
Total 8,036 15,248 23,284
Table 8: Cross-tabulation of syntactic position and missing translation
infer that, as a word is positioned deeper in the syntactic structure, the more probable it is that the word will be omit-ted in the translation. However, words at depth 0, i.e., the roots of the sentences, have a greater proportion of missing translations than those at depths 1 and 2. This also contra-dicts intuitive expectations because the root word is gener-ally the main word of the sentence. In addition, the propor-tion of omitted words at a depth of 6 is greater than that of adjacent depths.
A chi-squared test was applied to confirm that the propor-tion of missing translapropor-tions of content words at deep posi-tions in the syntactic structure is significantly greater than that at shallower positions.
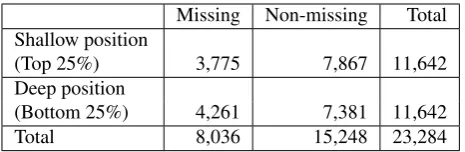
All content words were sorted in ascending order according to their depth in the syntactic structure, and a chi-squared test was applied to the frequency of missing translations in the top 25% (shallow) and bottom 25% (deep) positions in the syntactic structure. However, some words at depth 1 were included in the top 25%, and some words at depth 3 were included in the bottom 25%. Note that the words used in this test were selected randomly. The cross-tabulation is shown in Table 8.
The proportion of missing translations of the shallow 25% is 32.4% and that of the deep 25% is 36.6%. The chi-squared test results indicate a significant difference be-tween the rate of missing translations of the shallow 25% and that of the deep 25% (1% significance level). This im-plies that the proportion of missing translations is signifi-cantly greater when a word is deeper in the syntactic struc-ture.
5.
Conclusion
In this paper, to detect when it is difficult for an interpreter to provide an interpretation, statistical analyses of missing
20 30 40 50
0 1 2 3 4 5 6 7 8 9
P
ro
p
o
rti
o
n
o
f m
is
si
n
g
tr
an
sl
at
io
n
s (
%
)
[image:6.595.54.285.82.196.2]Depth in syntactic structure
Figure 8: Relationship between word depth in syntactic structure and proportion of missing translations
translations in E-J simultaneous interpretations were de-scribed. In this study, 88 lectures from E-J interpretation data from the SIDB were utilized in our analyses, and word-level translation correspondence was manually applied to the corpus. The relationships between missing translations and various factors, i.e., speech rate, delay, part-of-speech, and depth in syntactic structure, were analyzed. The analy-ses revealed the following relations:
• A significant difference was confirmed between fast and slow speech rates. When the speech rate is high, the proportion of missing translations is also high.
• A significant difference was confirmed between larger and smaller delays. When the delay of an interpre-tation is large, the proportion of missing translations becomes high.
• Significant differences were confirmed relative to nouns, verbs, and adverbs, and no significant differ-ences were identified relative to adjectives and num-bers. The proportion of missing translations relative to adverbs was 59%, which is 26.8% greater than the average. Note that adverbs are most likely to be omit-ted in translations. In addition, the proportion of miss-ing translations relative to nouns and numbers were 25.2% and 29.1%, respectively. Note that nouns and numbers represent parts-of-speech that are least likely to be omitted in translations.
• A significant difference was confirmed between shal-low and deep word positions in the syntactic structure. As words are positioned deeper in the syntactic struc-ture, it becomes more probable that the given word will be omitted in translations. However, the propor-tion of missing translapropor-tions of root words was greater than that of words at depths 1 and 2. In addition, the proportion of missing translations of words at depth 6 was greater than that of adjacent depths.
[image:6.595.54.287.240.316.2]structure. However, other factors related to missing transla-tions should be considered. In future, to identify difficulties in simultaneous interpretations, the density of the informa-tion content and the influence of combined factors will be studied.
6.
Acknowledgements
This research was partially supported by the Grant-in-Aid for Scientific Research (B) (No. 26280082) of JSPS.
7.
Bibliographical References
Anzai, T. (2008). Honyaku eibunpou - Yakushikata no rule. Babel Press (in Japanese).
Barik, H. (1994). A description of various types of omis-sions, additions, and errors of translation encountered in simultaneous interpretation.META, 16:199–210. Dillinger, M. (1994). Comprehension during interpreting:
What do interpreters know that bilinguals don’t? The Interpreters’ Newsletter, 3:41–58.
Gile, D. (1995).Basic concepts and models for interpreter
and translator training. Amsterdam: John Benjamin.
Gile, D. (1999). Testing the effort models’ tightrope hy-pothesis in simultaneous interpreting - a contribution.
Journal of Linguistics, 23:153–172.
Gile, D. (2009). Basic Concepts and Models for
Inter-preter and Translator Training (Revised edition).
Am-sterdam/Philadelphia: John Benjamins.
Maekawa, K., Koiso, H., Furui, S., and Isahara, H. (2000). Spontaneous speech corpus of Japanese. InProceedings of 2nd International Language Resources and
Evalua-tion Conference (LREC’00), pages 947–952.
Mizuno, A. (2005). Process model for simultaneous inter-preting and working memory. META, 50(2):739–794. Napier, J. (2004). Interpretation omissions: A new
per-spective. Interpreting, 6(2):117–142.
Ono, T., Tohyama, H., and Matsubara, S. (2008). Con-struction and analysis of word-level time-aligned simul-taneous interpretation corpus. In Proceedings of 6th International Conference on Language Resources and
Evaluation (LREC’08), pages 3383–3387.
Tohyama, H. and Matsubara, S. (2006). Collection of si-multaneous interpreting patterns by using bilingual spo-ken monologue corpus. InProceedings of 5th Interna-tional Conference on Language Resources and
Evalua-tion (LREC’06), pages 2564–2569.
8.
Language Resource References
Matsubara, S. and Takagi, A. and Kawaguchi, N. and In-agaki, Y. (2002). Bilingual spoken language corpus for simultaneous machine interpretation research. Proceed-ings of 3rd International Language Resources and Eval-uation Conference (LREC’02).
Takagi, A. and Matsubara, S. and Kawaguchi, N and In-agaki, Y. (2002). A corpus-based analysis of
simul-taneous interpretation. Proceedings of Joint
Interna-tional Conference of 5th Symposium on Natural Lan-guage Processing (SNLP-2002) & Oriental COCOSDA Worskshop.