International Journal of Research in Advent Technology, Special Issue, March 2019
E-ISSN: 2321-9637
3rd National Conference on Recent Trends & Innovations In Mechanical Engineering 15th & 16th March 2019
Available online at www.ijrat.org
A Novel approach for Multi-Objective Optimization of End
Milling Using Grey-ANFIS Method
P. Meramma dept. of ME
JNTUA College of Engineering Ananthapuramu, India.
Dr D.Ravikanth dept. of ME
KSRM College of Engineering Kadapa, India
Dr MLS. Deva Kumar dept. of ME
JNTUA College of Engineering Ananthapuramu, India.
Abstract—This paper presents the optimization of milling parameters like spindle rotational speed, feed, axial and radial depth of cuts along with the varying percentage composition of silicon carbide in metal matrix composite (MMC), which are highly influential parameters on cutting forces and surface roughness. A thirty two experiments design matrix is best suited for five parameters with five levels based on the central composite design (CCD). This design matrix is advantageous for both the minimizing number of experiments as well as optimizing the cutting responses such as surface roughness and in-feed, cross-feed and thrust forces in end milling. The main aim of this work is to put forth an integrated novel approach called as Grey-ANFIS (Adaptive Neuro Fuzzy Inference system) approach, which is useful for the investigation of the multi-objective response characteristics and also for determination of the optimal combination of influential input parameters. The predicted results stated that the proposed Grey-ANFIS is an effective technique and exhibit significant improvement in multi-objective optimization of cutting forces and surface roughness.
Keywords—optimization, end milling, cutting forces, surface roughness, Grey-ANFIS.
I. INTRODUCTION
Milling is one of the most commonly and globally used machining processes because of its ability to remove material faster with a good surface quality. In aerospace, automobile, biomedical and industrial applications milled surfaces are necessary in large to mate with other very precisely.
While machining, the cutting tool and workpiece expose the cutting forces, crucial for removal of unwanted materials in the form of chips. A correct estimation of such cutting forces is critical and could avoid quality problems related to the vibrations and tool deflection and also the productivity. The optimization of a milling process necessitates the accurate measurement of the cutting force by a special device called a machine tool dynamometer, which is capable of measuring the components of the cutting force in a given coordinate system. Determination of milling parameters such as spindle speed, axial and radial depth of cuts and feed rate, involved in machine setup suitable for optimum machining is one of the vital modules in process planning. Since the optimum machining operations are always economical and plays an important role in increasing productivity and competitiveness.
In the present work, an investigation on cutting forces and surface quality is considered in order to determine the
optimum machining conditions and study their effect on end milling process together with its predictive model by Grey-ANFIS approach. The literature survey pertaining to the work done by other researchers is given below.
Hazza, M., Hazza, F.Al, Adesta, E.Y.T and Riza, M. [1] presented an integrated approach called multi objective genetic algorithm optimization (MOGA) for the optimization of high cutting temperatures and surface roughness in high speed machining of hard metals. M.Subramanian, M.Sakthivel, K.Sooryaprakash, and R.Sudhakaran [2] investigated the effect of machining parameters on cutting forces in shoulder milling of AL7075-T6 by way of response surface methodology and genetic algorithm and found that the cutting speed was the dominant factor. Korkut and Donertas [3] observed that the increasing cutting speed increases the cutting forces while at lower and intermediate cutting speeds cutting tool built up edge (BUE) formation tendency increased.
both up and down milling. M.Y.Tsai, S.Y.Chang, J.P.Hung, C.C.Wang [5] compared the altintas and recursive least square (RLS) simulation models with experimental data and found that RLS simulation results are reliable. Their investigation showed that raise in the feed per tooth increases the cutting force and reduces tangential shear force coefficient and this model could gives the closet to the actual shear strength of the material.
Pramanik, Zhang, and Arsecularatne [6] developed a systematic force prediction model based on Merchant‟s analysis, slip line field theory of plasticity and the Griffith theory of fracture. Authors reported that the cutting force in the chip formation is more compared with the ploughing and particle fracture. Siva sakthivel, Vel Murugan, and Sudhakaran [7] fronted up a central composite rotatable second order RSM to develop a mathematical model to predict cutting forces in terms of helix angle, axial depth of cut, radial depth of cut, feed rate and spindle speed of Al6063 of high speed steel end mill cutter. The empirical analysis reveals that increment in feed and axial depth of cut minimize the in-feed and cross-feed forces.
Klilckap, Cakir, Aksoy,and Inan [8] used the uncoated and TiN coated tool to study the surface roughness and tool wear of 5% SiCp in Aluminum MMC in turning. They observed that raise in cutting speed increases tool wear and surface roughness; and also noticed that built up edge was not present during direct machining of cast materials. Arokiadass, Palaniradja, and Alagumoorthi [9] included % weight of silicon carbide in their study on tool wear in machining LM25 Al alloy reinforced with SiC in end milling operation. They analyzed that the spindle speed and the content of SiC are the influencing factor on tool wear. Aezhisai Vallavi Muthusamy Subramanian, Mohan Das Gandhi Nachimuthu, Velmurugan Cinnasamy [10] investigation on LM6 AL/SiCp results showed that increase
in spindle speed decreases the cutting forces and the axial depth of cut is more sensitive on cutting forces compared to weight percentage of SiCp, radial depth of cut and feed rate.
The above literature survey reveals that not much work has been stated on prediction and optimization of cutting considering weight percentage of silicon carbide as one of the parameters. Most of them focused on the effect of cutting parameters such as speed, feed and depth of cut only. It gives opportunity to embark on to study the effect of the weight percentage of silicon carbide on cutting force and surface roughness. Henceforth, the main objective of this work is to develop a new approach for multi-objective optimization of in-feed, cross-feed, thrust forces as well as surface roughness in order to study the effect of milling parameters including spindle rotational speed, feed, axial and radial depth of cut varying SiC weight % based on Grey-ANFIS integrated approach. Reference [10] experimental data is exactly suitable for implementing the proposed hybrid approach, hence without making modifications to that data the present approach is build up on the base of their experimental data.
II. EXPERIMENTAL DATA
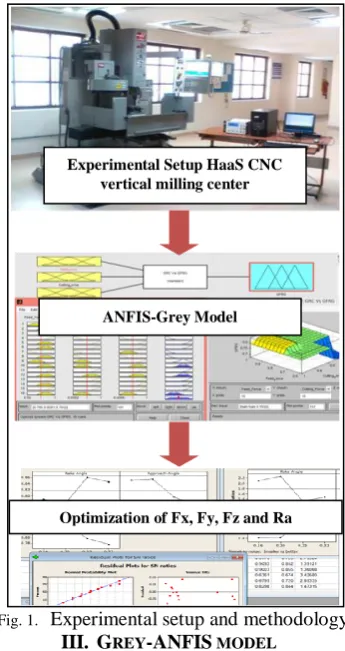
The complete experimental setup is shown in Figure1, the experimental data required for the accomplishment of
A. Input factors
The influential factors and their levels considered on optimization of machining responses such as in-feed force (Fx), cross-feed force (Fy), thrust force (Fz) and surface roughness (Ra), are summarized in below Table 1.
TABLE I. MILLING FACTORS AND FACTOR LEVELS
Controllable
factors Symbol Factor levels
Spindle speed
(rpm) N 1500 2000 2500 3000 3500
Feed rate
(mm/rev) F 0.02 0.03 0.04 0.05 0.06 Axial depth
of cut (mm) X 1 1.5 2 2.5 3
Radial depth
of cut (mm) Y 1 1.5 2 2.5 3
Silicon carbide (wt%)
W 5 10 15 20 25
B. Design of Experiments (DOE)
For five-factor five-level, Box and Hunter proposed the central composite rotatable design for fitting a second order response surface. This design consists of 32 experiments with the combination of sixteen factorial design points (lie at the vertices of the regular polyhedral), ten star points (to form sphere with α radius, consisting of equally spaced points from the center) and six replicated center points (also known as axial points which provide roughly equal precision of standard error). The MINITAB statistical software (version 16) package has been used to develop the response equations and evaluate the coefficient values. This software is also used to perform the data analyses.
C. Experimental setup
Fig. 1. Experimental setup and methodology.
III. GREY-ANFIS MODEL
The proposed one is a hybrid approach consists of two main steps. First, grey relation analysis (GRA) based experimental data preparation for multi-objective optimization; second, train and test ANFIS model based on grey relation grade (GRG). Figure 2 shows the schematic diagram of the proposed approach. Detail steps in proposed Grey-ANFIS approach are:
Normalization of the empirical responses data. Determination of grey relation coefficients (GRC)
related to the multiple objectives.
Calculation of GRG representing a multi-objective function (ɣ).
Rank the GRG for finding the optimal parametric set Input GRG data to train/test and generate initial FIS. Grey-ANFIS model development and training Response prediction using the model
Model evaluation
The machining conditions where the multi-objective function (ɣ) has the highest rank are said to be optimum.
Fig. 2. Schematic diagram of the proposed approach
A. Grey Relational analysis (GRA)
The grey relational analysis (GRA) is used to optimize multiple responses. This process is done in three steps (1) Normalization, Calculation of (2) Grey relation coefficient, and (3) Grey relation grade [11].
a)Normalization: Normalization is performed to prepare the basic data for the analysis where the original combination is transferred to a comparable combination. Linear normalization is usually in the range between zero and unity is also called as the grey relational generation
Data Pre-Processing is normally required, since the range and unit in one data sequence may differ from others. It is also necessary when the sequence scatter range is too large, or when the directions of the target in the sequences are different. The formulae are given in equations (1) and (2). „Higher – the – Better‟:
(1)
„Lower – the – better‟:
(2)
where Xi*(k) and Xi(k) are normalized data and observed data respectively for the ith experiment by using kth response.
b) Grey Relational Coefficient (GRC): GRC expresses the relationship between the ideal (best) values and actual normalized values for all the combinations. GRC can be calculated using the following equation (3):
(3)
where, Δi(k) is absolute value of the difference between
xi0 (k) and xi* (k) and Δi(k)=|xi*(k) − xi0 (k)|. Δmax and Δmin
are global maximum and global minimum values in different data series, respectively. The distinguishing coefficient (ζ) Experimental Setup HaaS CNC
vertical milling center
ANFIS-Grey Model
Optimization of Fx, Fy, Fz and Ra
Data Normalization
Grey relation coefficient (GRC)
GRG ranking to find optimal machining set
Load training/ testing GRG data & Generate initial FIS model
Grey-ANFIS model training and testing
Response prediction based on Grey-ANFIS model
Model evaluation at optimal set Multi-Objective related Grey Relation Grade
[image:3.595.79.252.53.379.2]c)Grey Relational Grade (GRG): In this step, the grey relational grade is computed by finding the average of the grey relational coefficient corresponding to each performance characteristics. This grade is being estimated with the following equation (4):
(4)
where yi the grey relational grade and n is the number of process response. The optimal value of the GRG can be predicted by using Eq. (5)
(5)
where, ym is total mean of the GRG value, q is number of input process parameters, and yi is mean GRG value at the optimal level for the ith parameter.
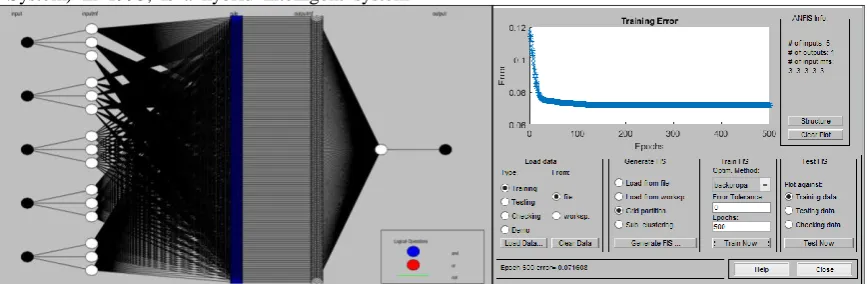
B. ANFIS approach
Jang [12] introduced the ANFIS (Adaptive Neuro Fuzzy Inference System) in 1993, is a hybrid intelligent system
Abdulshahed & Badi [13] explained the concept of ANFIS structure, five distinct layers: fuzzification, rule base, normalization, de-fuzzification and summation layers are used to describe the structure of an Grey-ANFIS model shown in Figure 3.
a)Development of the initial fuzzy model: For the obtained empirical data set an ANFIS-Grid partition method based initial fuzzy model has develped. In this method the data space is partitioned into rectangular sub-spaces based on a pre-defined number of membership functions (MFs) and their types in each dimension [14]. This method creates strong model due to the more number of rules which resulted with the increase of number of input variables. In order to get a limited number of rules, an integrated ANFIS-subtractive clustering method (SCM) can be used.
b)Max-min inference: The inference engine then performs fuzzy reasoning on fuzzy rules by taking max–min inference (Equation 6) for generating a fuzzy value μD0(y).
Fig. 3. (a) Structure of the Grey-ANFIS model and (b) trainig and testing of the model TABLE II. GREY RELATION ANALYSIS DATA
Exp. Set No.
Normalization Grey Relation Coefficient (GRC)
Grey Grade (GRG)
In-feed force (Fx)
Cross-feed force (Fy)
Thrust Force (Fz)
Surface roughness
(Ra)
ξ1(Fx) ξ2(Fy) ξ3(Fz) ξ4(Ra) ɣ (or) y
1 0.47 0.44 0.44 0.61 0.64 0.58 0.60 0.58 0.60
2 0.99 0.91 0.95 1.00 0.99 0.89 0.94 1.00 0.96
3 0.73 0.67 0.68 0.43 0.78 0.70 0.72 0.48 0.67
4 0.83 0.65 0.79 0.46 0.85 0.68 0.80 0.50 0.71
5 0.56 0.64 0.63 0.00 0.69 0.68 0.69 0.35 0.60
6 0.70 0.64 0.73 0.69 0.76 0.68 0.76 0.63 0.71
7 0.06 0.00 0.11 0.73 0.50 0.43 0.49 0.67 0.52
8 0.85 0.66 0.84 0.47 0.86 0.69 0.84 0.50 0.73
9 0.77 0.94 0.87 0.79 0.80 0.93 0.87 0.72 0.83
10 0.83 0.78 0.81 0.49 0.85 0.77 0.81 0.51 0.74
11 0.31 0.27 0.42 0.29 0.58 0.51 0.59 0.43 0.53
12 0.77 0.69 0.78 0.89 0.81 0.71 0.79 0.83 0.79
13 0.15 0.16 0.14 0.37 0.53 0.47 0.50 0.46 0.49
[image:4.595.84.518.306.448.2]15 0.42 0.53 0.67 0.61 0.62 0.62 0.72 0.58 0.63
16 0.00 0.00 0.00 0.29 0.49 0.43 0.46 0.43 0.45
17 0.31 0.41 0.49 0.26 0.58 0.56 0.62 0.42 0.55
18 0.91 0.73 0.93 0.58 0.91 0.74 0.92 0.56 0.78
19 0.89 0.88 0.86 0.17 0.89 0.86 0.86 0.39 0.75
20 0.51 0.39 0.54 0.01 0.66 0.55 0.65 0.35 0.55
21 0.78 0.66 0.72 0.99 0.81 0.69 0.75 0.98 0.81
22 0.26 0.23 0.24 0.75 0.56 0.49 0.53 0.69 0.57
23 0.63 0.66 0.65 0.61 0.72 0.69 0.71 0.58 0.67
24 0.36 0.49 0.51 0.64 0.60 0.60 0.64 0.60 0.61
25 1.00 1.00 1.00 0.80 1.00 1.00 1.00 0.73 0.93
26 0.34 0.24 0.26 0.54 0.59 0.50 0.53 0.54 0.54
27 0.69 0.59 0.71 0.43 0.76 0.65 0.74 0.48 0.66
28 0.68 0.62 0.69 0.43 0.75 0.67 0.73 0.48 0.66
29 0.68 0.60 0.69 0.43 0.75 0.65 0.73 0.48 0.66
30 0.68 0.61 0.69 0.42 0.75 0.66 0.73 0.48 0.65
31 0.68 0.59 0.68 0.43 0.75 0.65 0.73 0.48 0.65
32 0.68 0.59 0.70 0.42 0.75 0.65 0.74 0.48 0.65
μD0(y) = (μFx1(ξ1) ˄ μFy1(ξ2) ˄ μFz1(ξ3) ˄ μAG1(yo))
(μFx2(ξ1) ˄ μFy2(ξ2) ˄ μFz2(ξ3) ˄ μAG2(yo))…
˅( μFxi(ξ1) ˄ μFyi(ξ2) ˄ μFzi(ξ3) ˄ μAGi(yo))
(6)
where, ∧ is minimum operation, and ∨ is maximum operation respectively. The fuzzy subsets defined by the corresponding membership functions, i.e., μFxi(ξ1), μFyi(ξ2),
μFzi(ξ3) and μAGi(yo) . The inference engine then performs
fuzzy reasoning on fuzzy rules by taking max–min inference (Equation 6) for generating a fuzzy value μD0(y).
c) Defuzzifiction: defuzzifier converts the fuzzy value into crisp output using the centroid-defuzzification method (Equation 7); i.e. Grey-ANFIS reasoning grade (y) is calculated from the ANFIS multi-response output μD0 (yo)
using the following equation:
(7)
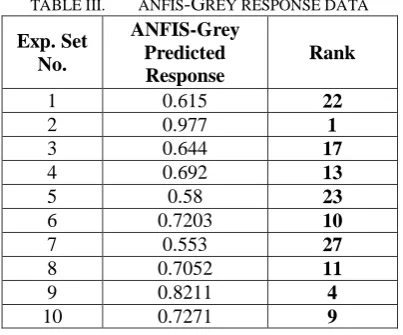
The non-fuzzy value yo gives Grey-ANFIS Relational Grade. Invariably, a larger grey relational grade is opted [15], which gives an improved performance characteristic. Table.3 shows the results of Grey-ANFIS relational grade for 32 set of experiments.
TABLE III. ANFIS-GREY RESPONSE DATA
Exp. Set No.
ANFIS-Grey Predicted Response
Rank
1 0.615 22
2 0.977 1
3 0.644 17
4 0.692 13
5 0.58 23
6 0.7203 10
7 0.553 27
8 0.7052 11
9 0.8211 4
10 0.7271 9
11 0.542 28
12 0.766 7
13 0.511 30
14 0.85 3
15 0.64 18
16 0.443 32
17 0.51 31
18 0.79 6
19 0.75 8
20 0.57 25
21 0.82 5
22 0.57 25
23 0.66 16
24 0.58 23
25 0.91 2
26 0.52 29
27 0.63 20
28 0.67 15
29 0.633 19
30 0.6212 21
31 0.683 14
32 0.695 12
IV. RESULTS AND DISCUSSION
In this work the experimental data is studied based on a GRA method by which it is possible to identify the significant effect of each machining parameter on the GRG at different levels. The mean Grey-ANFIS analysis data at each level for the different machining parameters is presented in Table 4, which is referred to as a response table. The influence of each machining parameter can be more clearly presented by means of the Grey-ANFIS response graph shown in figure 4. The Grey-ANFIS graph shows the change in the response when a given factor goes from level 1 to level 5.
TABLE IV. GREY RELATION ANALYSIS DATA
Level Speed Feed Axial DoC
Radial
[image:5.595.67.269.605.772.2]4 0.739 0.6288 0.6218 0.662 0.5934
5 0.7832 0.5535 0.5681 0.6075 0.54
A. ANOVA analysis
ANOVA analysis identifies which machining parameter is significantly affecting the response characteristics. This is accomplished by separating the total variability of the Grey-ANFIS grade verses machining parameters, which is measured by dividing each parameter sequential sum of squared deviations with total sum of squares.
TABLE V. ANOVA ANALYSIS
Source DF Seq SS
Adj SS
Adj MS F
% of influence Speed 1 0.09 0.09 0.09 44.64 20.47
Feed 1 0.05 0.05 0.05 25.21 11.56
Axial-Doc 1 0.07 0.07 0.07 34.61 15.87
Radial-Doc 1 0.00 0.00 0.00 2.17 0.99 Wt % 1 0.18 0.18 0.18 85.48 39.19
Error 26 0.05 0.05 0.00
silicon carbide weight percentage in composite has influenced most significantly on both cutting forces and surface roughness.
B. ANFIS-Grey model evaluation
Finally an evaluation test was conducted to verify the improvement in the cutting forces and surface roughness for the estimated Grey-Anfis, using the optimal level of the machining parameters. Table 6, shows the comparisons of predicted and actual machining responses for the optimal machining parameters set spindle speed of 3500 rpm, feed rate of 0.02 mm/rev, axial DoC of 1 mm, radial Doc of 1.5 mm and 5% weight ratio of SiCp.
TABLE VI. GREY-ANFIS MODEL EVALUATION
Responses Predicted Experimental % of Error
Fx 78.62 76.34 2.90
Fy 46.35 49.26 5.91
Fz 102.48 100.2 2.22
Ra 3.36 3.6 6.67
350 0 3000 2500 2000 1500
0
-1
-2
-3
-4
-5
-6
0.06 0.05 0.04 0.03
0 .02 3.
0 2.5 2.0 1.5
1.0 1.0 1.5 2.0 2.5 3.0 5 10 15 20 25
Spe e d
M
ea
n
o
f
S
N
r
a
ti
o
s
Fe e d Axial Doc Radial Doc Wt
Response Plot for SN ratios of Grey-ANFIS
Data Means
Signal-to-noise: Larger is better
Fig. 4. ANFIS-Grey response plots of SN ratio Based on the confirmation experiments, for the optimal
combination of parameters the cutting forces and surface roughness were reduced. Hence it can be affirmed that there is a significant improvement in responses after optimization.
V. CONCLUSIONS
In this paper the Grey-ANFIS approach is used for solving the multi-objective optimization problem in end milling and also for determining the optimal conditioned representing the levels of spindle speed, feed rate, axial depth of cut, radial depth of cut, with varying wt % SiCp.
ANOVA is also used to find out the significantly most effective parameter on responses. From the analysis the following conclusions are drawn:
1. GRA analysis results the experimental set 2 containing 3000 rpm speed, 0.03mm/rev feed, 1.5mm axial doc, 1.5 mm radial doc, 10% wt ratio of SiCp.
3. ANOVA confirms that SiC weight percentage ratio has greater significance on both cutting forces and surface roughness.
4. The proposed approach would serve as best alternative model for the multi-objective optimization problem. Especially for predicting cutting responses and determining the optimal machining conditions.
This novel approach paves way for new research directions in the ANN based multi-objective optimization area. Qualitative data requirement hinders in this model and provided in the further improvements can make this model more effective.
ACKNOWLEDGMENT
This research did not receive any specific grant from funding agencies in the public, commercial, or not-for-profit sectors.
REFERENCES
[1] M.Hazza, F.Al. Hazza, YET. Adesta, and M. Riza, “Cutting Temperature and Surface Roughness Optimization in CNC End Milling Using Multi Objective Genetic Algorithm”, International Conference on Advanced Computer Science Applications and Technologies, 2012, 7–10. https://doi.org/10.1109/ACSAT.2012.39
[2] M.Subramanian, M.Sakthivel, K.Sooryaprakash and R.Sudhakaran, “Optimization of Cutting Parameters for Cutting Force in Shoulder Milling of Al7075-T6 Using Response Surface Methodology and Genetic Algorithm”, International Conference On DESIGN AND MANUFACTURING, IConDM-2013, Procedia Engineering, 2013, 64, 690 – 700. doi: 10.1016/j.proeng.2013.09.144
[3] I. Korkut and M.A. Donertas, “The influence of feed rate and cuttings peed on the cutting forces, surface roughness and tool–chip contact length during face milling”, Materials and Design, 2007, 28, 308–312. doi:10.1016/j.matdes.2005.06.002
[4] N. Masmiati, A.A.D. Sarhan, M.A.N. Hassan, M. Hamdi, “Optimization of Cutting Conditions for Minimum Residual Stress, Cutting Force and Surface Roughness in End Milling of S50C Medium Carbon
Steel”, Measurement, 2016.
doi:http://dx.doi.org/10.1016/j.measurement.2016.02.04 9
[5] M.Y. Tsai, S.Y. Chang, J.P. Hung and C.C. Wan “Investigation of milling cutting forces and cutting coefficient for aluminum 6060-T6”, Computers and
Electrical Engineering, 2015.
http://dx.doi.org/10.1016/j.compeleceng.2015.09.016. [6] A. Pramanik, L.C. Zhang_, J.A. Arsecularatne,
“Prediction of cutting forces in machining of metal matrix composites” International Journal of Machine Tools & Manufacture 46 (2006) 1795–1803.
[7] PS.Sivasakthivel, V. Vel Murugan, and R.Sudhakaran, “Cutting forceprediction depending on process parameters by response surface methodology in milling”. Journal of Machining and Machinability of Materials, 2010, 11(2),137–153.
[8] E. Klilckap, O. Cakir, M. Aksoy, and A. Inan, “Study of tool wear andsurface roughness in machining of homogenized SiCp reinforced aluminium metal matrix composite”, Journal of Material Processing Technology, 2005, 164,862–867.
[9] R. Arokiadass, K. Palaniradja, and N. Alagumoorthi, “Prediction andoptimization of end milling process parameters of cast aluminum basedMMC”, Journal of Transaction Nonferrous Material Society of China, 2012, 22(7),1568–1574.
[10] Aezhisai Vallavi Muthusamy Subramanian, Mohan Das Gandhi Nachimuthu and Velmurugan Cinnasamy, “Original Assessment of cutting force and surface roughness in LM6/SiCpusingresponse surface methodology”, Journal of Applied Research and Technology, 2017, 15, 283–296.
[11] J. Deng, “Introduction to grey system”, J. Grey. System, 1989, 1 (1), 1–24.
[12] JSR. Jang, “ANFIS: Adaptive-network-based fuzzy inference system”, IEEE Transactions on Systems, Man and Cybernetics, 1993 23(3), 665-685.
[13] Ali M. A bdulshahed and Ibrahim Badi, “Prediction and Control of Surface Roughness for End Milling Process Using ANFIS”, Operational Research in Engineering Sciences: Theory and Applications, 2018, 1(1),1-12. https://doi.org/10.31181/orestal901201011a
[14] H. Haddad, and M. Al Kobaisi, “Optimization of the polymer concrete used for manufacturing bases for precision tool machines”. Composites Part B: Engineering, 2012, 43(8), 3061-3068. doi: http://dx.doi.org/10.1016/j.compositesb.2012.05.003 [15] G. Rajyalakshmi and P. Venkata Ramaiah, “Application