E-ISSN: 2321-9637
Available online at www.ijrat.org
86
Productivity Improvement in a Windows Manufacturing
Layout Using Flexsim Simulation Software
U. Sravan Kumar
1, Y. Shivraj Narayan
2 PG Scholar1, Associate Professor2 Department of Mechanical EngineeringVallurupalli Nageswara Rao Vignana Jyothi Institute of Engineering & Technology Bachupally, Nizampet (S.O), Hyderabad 500090
Email: [email protected]
Abstract- Improving the quality of products being manufactured and enhancing the productivity is of utmost importance in today’s global competition. This could be achieved by addressing the bottlenecks present in the manufacturing process as well as in the layout. This project aims at optimizing the layout of Upvc windows manufacturing unit of M/s. GenX windoors Private Limited Hyderabad. It is done by carrying out a detailed study to find out the bottlenecks in the existing layout and suggest corrective measures to them. Various tools like Statistical Quality Control, Flow Process charts, Flexsim software are used. The layout is optimized by first building and validating the simulation model of existing layout, followed by creating proposed layouts based on the various alternatives found for the bottlenecks and validating them. Alternatives or corrective measures are decided by making use of statistical tools like brainstorming and flowchart. Simulated results are then compared with the existing results so as to find the optimized layout. It is also intended to carry out the cost analysis so as to know the economic impact of implementation of the proposed changes in the windows manufacturing unit.
Index Terms: Manufacturing layout, Optimizing, SQC and Simulation Model.
1. INTRODUCTION
Industries in any part of the world strive to lead the market. Achievement of such a lead role in market needs to work on few factors like improvements in quality and quantity, reducing lead time and cost which are all depended on industries. However there are plenty of real-time problems associated with the manufacturing of products that may cause hindrance to achieving higher productivity. One major area of concern in this regard is the improper design of layout and its commissioning. It is observed that application of simulation in manufacturing systems has been pretty successful in identifying the problems associated with it and providing alternative solutions for rectification and further improvement. Simulation is defined as an imitation of real-world system in terms of its appearance and working characteristics. It is a visual technical tool to build a virtual system and analyze the parameters before any decisions are taken to implement. It increases the productivity at less risk and less investment. Therefore it is mainly used in production industries, transportation and other sectors where it is achieving good results. Many
simulation software’s are available in the market for dealing with these problems.
The main objective of this work is to optimize the existing layout of M/s. GenX Windoors Pvt. Ltd. Hyderabad for improving its productivity by using Flexsim simulation software.
This paper focuses on the building of simulation model of manufacturing facility layout of M/s. GenX Windoors Pvt. Ltd, Hyderabad. M/s. GenX is actively engaged in the manufacturing of UPVC windows and doors. This project work involved following steps:
• Collected required data from M/s. GenX
• Built simulation model of existing layout based on the data
• Validate the simulation model of the existing layout
• Identified the problems associated with the layout
• Incorporated proper logics for exact and smooth functioning of the simulation model as that of the real system
International Journal of Research in Advent Technology, Vol.3, No.9, September 2015
E-ISSN: 2321-9637
Available online at www.ijrat.org
87 • Cost analysis had been conducted for best
alternate layout
Various SQC tools like flow process chart and OTIS chart. AutoCAD, Minitab and Flexsim Simulation software were used in this project.
2. LITERATURE SURVEY
Sepideh Khalafi et al., [1] compared the bottleneck’s present in different layouts which are modeled by using enterprise dynamic simulation software. Critical parts were identified in aerators and valves manufacturing layout and the best among the layouts was suggested to reduce lead time. Michal Leoporis et al., [2] examines the four bottleneck detection methods Active period method, Turning point method, Arrow based method and Criticality indicator method. The statistical data is obtained from witness simulation software and compared with the detection methods to adopt as per the requirements.
Ondrej Kurkin et al., [3] show the optimization of layout in an automobile industry for spatial arrangements for incoming load. Different variants had been suggested using multi-criteria method and simulated, validated the model.
Li Hong Chen et al., [4] describes the modeling of layout in flexsim simulation software. An existing layout of airport terminal was created in CAD software has 3D model and it is imported into flexsim software. Splitter is used in flexsim to find the blocking and waste areas in loading and unloading zones.
Julien Benabes et al., [5] explains that to reduce cost and time in manufacturing industries layout building is given the outmost importance. The interactive method was implemented by four steps as description, formulation, solving the problem and final decision. The genetic algorithm is prepared by mathematical expressions for space accessing, reducing overlap and disturbances. The model was simulated for several runs and made final decisions. William B. Nordan [6] describes the usage of Flexsim software by stages as compiler, developer, application and model development. It has Compiler which is included with library files and developed by using C++ language. It is applicable in many industries and modeled with necessary connections. Qi Hao et al., [7] proposed a hybrid simulation approach which combines discrete event and agent based modeling technologies to optimize the material handling system. JIT principles were used with the
combination of Anylogic simulation software to simulate complex material handling systems.
Xiaofeng Hu et al., [8] compared the structured conceptual model and generic model. Structured conceptual models are quick in response as they can be modified as required rather than the generic model because of the limitations. It consists of three stages as product description, manufacturing resources and control centre which can be facilitated in all kind of cases. The necessary data was collected, simulated and validated the model.
Lene Berge Holm et al., [9] explains the allocation of patients on beds using generic model in which length of stay was modeled as beta distribution. The statistical data was collected accordingly and simulated in flexsim and Ra simulation software for several runs to make decisions for allocation of patients.
Qayyum et al., [10] proposed a layout to improve the SME’s manufacturing units. Simulation software was used to obtain qualitative and quantitative benefits. The data is collected from the industry for certain period and by using the existing layout, model is build and validated for several runs to make necessary decisions with help of experts.
3. EXISTING LAYOUT
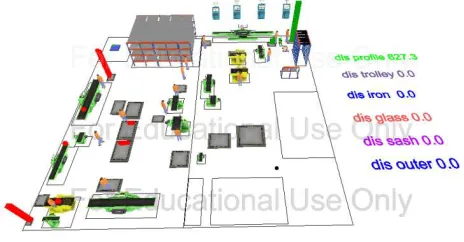
The existing layout at M/s. GenX was studied in detail and information pertaining to it was collected. The layout consists of two processes those are: sash production and outer production which are the components of Upvc windows. Based on this data, a drawing of the existing layout was designed in AutoCAD software as per the real dimensions. Proper care was taken while taking the measurements of all machines, material handling equipment, loading and unloading areas in the layout. Fig.1 shows the arrangements of the 10 machines, 10 tables for manual operation and 3 racks which are available in the layout.
4. PROBLEMS IDENTIFIED IN THE
LAYOUT
The following were the problems identified in the existing layout:
(ii) Improper utilization of space in the layout. Work areas at end milling machine, V-notch machine and V-notch cleaning machine, manual working table 17 and glass cutting table was wasted where another works could be carried out.
(iii) Presence of an obsolete machine i.e milling machine which was not used regularly.
The problems identified in the existing layout are critical in nature thereby decreasing the productivity. In order to provide solutions to these problems and improve the productivity, it was planned to simulate the existing layout, validate it and then provide alternative solutions (layouts). Flexsim simulation software was selected for the simulation.
5. PROBLEM FORMULATION USING
FLEXSIM SOFTWARE
Flexsim simulation software is an object
software environment used to develop, model, simulate, visualize, and monitor dynamic flow process activities and systems. Flexsim is a complete suite of development tools to develop and compile simulation applications. Flexsim has been used to model manufacturing process, warehousing, material handling processes, semiconductor ma
and marine container terminal processes [
5.1 Steps followed in building a model
• AutoCAD software was used to build the existing layout in which a 2D layout was drafted and saved as “.dxg” format.
• The drafted layout is imported into the flexsim simulation software using visual tool and the library objects are dragged into the corresponding layout accordingly.
• Minitab software was used to find out the time distributions for each machine in the from which the data was collected from GenX industry for a period of three months.
• The fixed resources are connected by holding “A” key for the correct movement of flowitems which is used for input and output ports and transporters are connected by
which is center port connection for handling the flowitems.
• Logics were developed for some machines which facilitates the movement as in the original layout. • The input for the machines starts from the raw
rack to 3 machines at different ti
• Run time was set to 32400 seconds i.e.., 9 hours for 2 processes.
E-ISSN: 2321-9637
Available online at www.ijrat.org
(ii) Improper utilization of space in the layout. Work notch machine and notch cleaning machine, manual working table 17 was wasted where another
) Presence of an obsolete machine i.e.., end not used regularly.
dentified in the existing layout are critical in nature thereby decreasing the productivity. In order to provide solutions to these problems and improve the productivity, it was planned to simulate the existing layout, validate it and then provide ive solutions (layouts). Flexsim simulation software was selected for the simulation.
PROBLEM FORMULATION USING
Flexsim simulation software is an object-oriented software environment used to develop, model, r dynamic flow process activities and systems. Flexsim is a complete suite of development tools to develop and compile simulation applications. Flexsim has been used to model manufacturing process, warehousing, material handling processes, semiconductor manufacturing and marine container terminal processes [9].
5.1 Steps followed in building a model
AutoCAD software was used to build the existing layout in which a 2D layout was drafted
The drafted layout is imported into the flexsim simulation software using visual tool and the library objects are dragged into the corresponding layout accordingly.
Minitab software was used to find out the time distributions for each machine in the layout, from which the data was collected from GenX industry for a period of three months.
The fixed resources are connected by holding “A” key for the correct movement of flowitems which is used for input and output ports and holding “s” key which is center port connection for handling the
Logics were developed for some machines which facilitates the movement as in the original layout. The input for the machines starts from the raw rack to 3 machines at different times.
Run time was set to 32400 seconds i.e.., 9 hours
• Distance traveled by the flowitems (parts) is measured by using the logic which is placed at dispatch and global table was created to display the distance traveled by flowitems.
• The layout consists of two processes, 1
is sash and 2nd process is outer. First the sash production is done, after the completion of 1 process, 2nd process starts commencing.
• The final reports are charted in excel sheets which are present in flexsim
in statistic tab.
[image:3.595.317.549.284.405.2]The existing layout is shown in fig. 1
Fig 1 Existing layout of M/s. GenX
6. PROPOSAL OF ALTERNATE LAYOUT
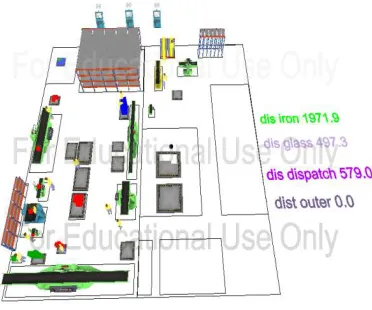
The problems identified in the existing layout were rectified in proposal layouts. Two layouts were proposed out of which one was best suited to reduce the problems of existing layout.
problems few changes were made in the layout which are carefully done with the help of experts. following are the activities performed in proposal I
• The distance travelled by operator and hand trolley was reduced
machine to fixing zone and even a rack was arranged for raw iron.
• Obsolete machines were removed from layout hence dispatch section area has increased. • Introduction of automated machines like CNC &
welding, Glazing machine and machine.
• Glass cutting section was moved from dispatch section to glazing zone and the pi
was redesigned so as the distance and danger of picking a glass from glass rack
The proposal layout I was developed and validated according to the suggestions
88 Distance traveled by the flowitems (parts) is measured by using the logic which is placed at dispatch and global table was created to display the distance traveled by flowitems.
yout consists of two processes, 1st process process is outer. First the sash production is done, after the completion of 1st
process starts commencing.
The final reports are charted in excel sheets which are present in flexsim simulation software
isting layout is shown in fig. 1.
Existing layout of M/s. GenX
PROPOSAL OF ALTERNATE LAYOUT
The problems identified in the existing layout were rectified in proposal layouts. Two layouts were proposed out of which one was best suited to reduce the problems of existing layout. To rectify those problems few changes were made in the layout which carefully done with the help of experts. The following are the activities performed in proposal I.
travelled by operator and hand trolley was reduced by moving iron cutting machine to fixing zone and even a rack was
nes were removed from layout hence dispatch section area has increased. Introduction of automated machines like CNC & welding, Glazing machine and Assembly
Glass cutting section was moved from dispatch section to glazing zone and the pickup location was redesigned so as the distance and danger of
from glass rack is reduced.
International Journal of Research in Advent Technology, Vol.3, No.9, September 2015
[image:4.595.100.286.175.330.2]model was made 50 runs. The prop shown in Fig. 2.
Fig. 2 Proposal layout I
7. COST ANALYSIS
The purpose of cost-benefit analysis is to provide a consistent procedure for evaluating decisions in terms of their consequences. This might appear as an obvious and sensible way to proceed, but
means the only one.Cost analysis clear an enormous field [11].
The Cost analysis for proposal I was taken for justice because of the validations that had been done in flexsim simulation software is best suited. The process for cost analysis was done accordingly with the technical tools which are available in the cost analysis. The detailed study of cost incurred in implementing proposal I for moving machines and newly introduced machines.
The cost incurred in modifying the proposal
was a sum of Rs. 25,31,000/- by implementing this layout a sum of Rs. 1,52,64,000/- could be
This analysis would result in improving productivity and gain profits. By implementing such a productive layout more and more orders can be affo
quality products which can be appraised by the customers.
The table 1 shows the validation results in manual as well as in Flexsim simulation software
simulated for 50 runs as shown in appendix A.
International Journal of Research in Advent Technology, Vol.3, No.9, September 2015
E-ISSN: 2321-9637
Available online at www.ijrat.org
proposal layout I is
roposal layout I
benefit analysis is to provide a consistent procedure for evaluating decisions in terms of their consequences. This might appear as an obvious and sensible way to proceed, but it is by no Cost analysis clearly embraces
The Cost analysis for proposal I was taken for justice because of the validations that had been done in flexsim simulation software is best suited. The analysis was done accordingly with the technical tools which are available in the cost analysis. The detailed study of cost incurred in implementing proposal I for moving machines and
The cost incurred in modifying the proposal layout I by implementing this could be achieved. This analysis would result in improving productivity and gain profits. By implementing such a productive layout more and more orders can be afford with good quality products which can be appraised by the
The table 1 shows the validation results in manual as well as in Flexsim simulation software which was
appendix A.
8. CONCLUSION
This work is aimed at improving the productivity of M/s. GenX Windoors Pvt. Ltd. Hyderabad by optimizing the existing layout through Flexsim simulation software. Following conclusions can be drawn from the carried out work:
• Upon identifying the problems in existing layout two alternate layouts was proposed to overcome the issues identified in the existing layout. • After validation of all the models it was found
that proposal I was best suited for M/s. windoors.
• Cost analysis for proposal I was made and the cost incurred for modifying the layout was 25,31,000/-.
• Upon implementing proposal I an amount of 1,52,64,000/- would be incurred
8.1 outcome of the work
The output for each layout when compared to existing layout has been increased. This shows that there is increase in productivity.
• In existing layout the output per day is 31-35 windows.
• In proposal layout I the output per day is 47-49 windows.
• In proposal layout II the output per day is 38-41 windows.
The proposal layout I is the best for the productivity improvement after validation in the flexsim software.
9. ACKNOWLEDGEMENT
Authors would like to thank Mr. Rajesh Reddy Peduru, Director, M/s. Genx Windoors Pvt. Ltd Hyderabad for granting permission to carry out the project in the industry and providing technical data and guidance in the project.
REFERENCES
[1] Sepideh Khalafi, Sadigh Raissi, Industrial Valves Production Line Bottleneck Analysis: A Computer Based Simulati
International Journal of Scientific & Technology Research, Vol. 3, Issue 6, June 2014
[2] Michal Leporis and Zdenka Kralova, A Simulation Approach to Production Line Bottleneck Analysis, International Conference Cybernetics and Informatics
2010.
International Journal of Research in Advent Technology, Vol.3, No.9, September 2015
89 improving the productivity of M/s. GenX Windoors Pvt. Ltd. Hyderabad by optimizing the existing layout through Flexsim simulation software. Following conclusions can be drawn from the carried out work:
Upon identifying the problems in existing layout lternate layouts was proposed to overcome the issues identified in the existing layout. After validation of all the models it was found
oposal I was best suited for M/s. GenX
Cost analysis for proposal I was made and the modifying the layout was Rs.
Upon implementing proposal I an amount of Rs. would be incurred.
8.1 outcome of the work
The output for each layout when compared to existing layout has been increased. This shows that
increase in productivity.
In existing layout the output per day is windows.
In proposal layout I the output per day windows.
In proposal layout II the output per day windows.
The proposal layout I is the best for the productivity improvement after validation in the flexsim software.
ACKNOWLEDGEMENT
thank Mr. Rajesh Reddy Genx Windoors Pvt. Ltd, granting permission to carry out the project in the industry and providing technical data and guidance in the project.
] Sepideh Khalafi, Sadigh Raissi, Industrial Valves Production Line Bottleneck Analysis: A
Based Simulation Approach, International Journal of Scientific & Technology
3, Issue 6, June 2014.
E-ISSN: 2321-9637
Available online at www.ijrat.org
90 [3] Ondrej Kurkin and Michal Simon, Optimization
of Layout Using Discrete Event Simulation, IBIMA Business Review, Vol. 2011 (2011), Article Id 180343, 10 pages.
[4] Li-Hong Chen, Da-Wei Hu, Ting Xu, Highway Freight Terminal Facilities Allocation Based on Flexsim, Procedia - Social and Behavioral Sciences, 96, ( 2013 ), pp. 368 – 381.
[5] Julien Benabes, Emilie Poirson and Fouad Bennis, Integrated and Interactive Method for Solving Layout Optimization Problems, Expert Systems with Applications, 40, (2013), pp. 5796–5803.
[6] William B. Nordgren, Flexsim Simulation Environment, Proceedings of the 2003 Winter Simulation Conference.
[7] Qi Hao, Weiming Shen, Implementing a Hybrid Simulation Model for a Kanban-Based Material Handling System, Robotics and Computer-Integrated Manufacturing, 24, (2008), pp. 635– 646.
[8] Xiaofeng Hu, Ruxiao An, Modeling and Simulation of Manufacturing Systems in Unstable Environment, Proceedings of the World Congress on Engineering 2011, Vol. I, WCE 2011, July 6-8, 2011.
[9] Lene Berge Holm, Hilde Luras, Fredrik A. Dahl, “Improving Hospital Bed Utilization through Simulation and Optimization with Application to a 40% Increase in Patient Volume in a Norwegian General Hospital”, International Journal of Medical Informatics, 82, (2013), pp. 80-89.
[10] A. Qayum, K. Dalgarmo, Improving manufacturing systems through use of simulation, school of mechanical and systems engineering, New Castle University.
[11] Li-Hong Chen, Da-Wei Hu, Ting Xu, “Highway Freight Terminal Facilities Allocation Based on Flexsim”, Procedia - Social and Behavioral Sciences, 96, (2013), pp. 368 – 381.
A. APPENDIX
Table 1 Validation results in Manual and Flexsim simulation software
COMPONENT EXISTING LAYOUT PROPOSAL I PROPOSAL II
MANUAL FLEXSIM MANUAL FLEXSIM MANUAL FLEXSIM
Dis. (m)
Time (min)
Dis. (m)
Time (min)
Dis. (m)
Time (min)
Dis. (m)
Time (min)
Dis. (m)
Time (min)
Dis. (m)
Time (min)
SASH 106.9 86.5 108.1 88.4 52.6 36 51.2 37.6 72.6 63.5 73.9 64.2