Extending Document Summarization to Information Graphics
∗Sandra Carberry,∗∗Stephanie Elzer,∗ ∗ ∗Nancy Green,∗Kathleen McCoy and∗Daniel Chester
∗Dept. of Computer Science, University of Delaware, Newark, DE 19716
(carberry, mccoy, [email protected])
∗∗Dept. of Computer Science, Millersville Univ., Millersville, PA 17551
∗ ∗ ∗Dept. of Math. Sciences, Univ. of North Carolina at Greensboro, Greensboro, NC 27402
Abstract
Information graphics (non-pictorial graphics such as bar charts or line graphs) are an important component of multimedia documents. Often such graphics convey information that is not contained elsewhere in the document. Thus document summa-rization must be extended to include summasumma-rization of information graphics. This paper addresses our work on graphic summarization. It argues that the message that the graphic designer intended to vey must play a major role in determining the con-tent of the summary, and it outlines our approach to identifying this intended message and using it to construct the summary.
1 Introduction
Summarization work has focused primarily on the written words in a document. However, graphics are an important part of many documents, and they often convey information that is not included else-where in the document. Thus as text summarization branches out, it is essential that it consider the sum-marization of graphical information in documents.
Graph summarization has received some atten-tion. (Yu et al., 2002) has used pattern recogni-tion techniques to summarize interesting features of automatically generated graphs of time-series data from a gas turbine engine. (Futrelle and Nikolakis, 1995) developed a constraint grammar formalism for parsing vector-based visual displays and produc-ing structured representations of the elements com-prising the display. The goal of Futrelle’s project is to produce a graphic that summarizes one or more graphics from a document (Futrelle, 1999). The summary graphic might be a simplification of a graphic or a merger of several graphics from the document, along with an appropriate summary cap-tion. Thus the end result of summarization will it-self be a graphic.
Our project is concerned with information graph-ics (non-pictorial graphgraph-ics such as bar charts or line graphs). Our current focus is on providing an
ini-tial summary of an information graphic, within a larger interactive natural language system that can respond to followup questions about the graphic. There are several useful applications for a system that can summarize information graphics. For dig-ital libraries, the initial summary of the graphic will be used in conjunction with the document text/summary to provide a more complete represen-tation of the content of the document to be used for searching and indexing. In the case of environ-ments with low-bandwidth transmission and minia-ture viewing facilities, such as cellular telephones for accessing the web, the initial summary and fol-lowup capability will provide an alternative modal-ity for access to the document.
inter-est include 1) that bankruptcies had been decreasing at a steady rate since 1998, 2) that bankruptcies had been decreasing slowly since 1998, 3) the percent-age decrease each year, 4) the percentpercent-age increase in bankruptcies in 2001, 5) the absolute increase in bankruptcies in 2001, and 6) the total number of bankruptcies in 2001. Thus the initial summary of this graphic might be
This graphic shows that although Delaware bankruptcy personal filings decreased slowly and steadily from 1998 to 2000, they rose sharply in 2001.
Note that the proposed summary includes the hy-pothesized intended message of the graphic, along with the first two of the additional interesting tures of the graphic. The selection of additional fea-tures to augment the summary is discussed further in Section 3.3. The system would then respond to user requests for additional information by present-ing some or all of the other interestpresent-ing features that had been identified, as discussed in Section 3.4.
This paper provides an overview of our project. Section 2 discusses the essential role of intention recognition in graphics summarization. It argues not only that the intended message of the graphic designer must be inferred and included in a sum-mary of a graphic, but also that the intended mes-sage significantly influences the additional propo-sitions that should be included in the summary. Section 3 presents our approach to graph summa-rization. It discusses how we use a computer vi-sion module to construct an XML representation that captures the components of the graphic and their relationship to one another, and how we use a Bayesian belief network to hypothesize the inten-tions of the graph designer. The paper then dis-cusses our plans for constructing a summary that includes the graphic designer’s intended message along with highly ranked additional propositions, and how the lesser ranked propositions will be used in an interactive natural language system that re-sponds to the user’s requests for further summaries of additional features of the graphic.
2 The Role of Intention in Graphics
Summarization
Text summarization has generally relied on statis-tical techniques and identification and extraction of key sentences from documents. However, it is widely acknowledged that to truly understand a text and produce the best summary, one must under-stand the document and recognize the intentions of the author. Recent work in text summarization has
personal filings
Delaware bankruptcy
3000
2500
1000 1500 2000
[image:2.595.320.527.73.287.2]1998 1999 2000 2001
Figure 1: Graphic from a City Newspaper
60 70 80 90 01
$15
10
5
Black women White women
Median Income
In thousands of 2001 dollars
1948
Figure 2: Graphic from Newsweek Magazine
begun to address this issue. For example, (Marcu, 2000) presents algorithms for automatically identi-fying the rhetorical structure of a text and argues that the hypothesized rhetorical structure can be successfully used in text summarization.
[image:2.595.315.533.327.524.2]arti-cle. For example, Figure 2 illustrates a graphic from Newsweek showing that the income of black women has risen dramatically over the last decade and has reached the level of white women. Although this in-formation is not conveyed elsewhere in the article, it contributes to the overall communicative intention of this portion of the article — namely, that there has been a “monumental shifting of the sands” with regard to the achievements of black women.
Our project is concerned with the understand-ing and summarization of information graphics: bar charts, line graphs, pie charts, etc. We contend that analyzing the data points underlying an informa-tion graphic is insufficient. One must instead iden-tify the message that the graphic designer intended to convey via the design choices that were made in constructing the graphic. (Although one might suggest relying on captions to provide the intended message of a graphic, Corio and Lapalme found in a large corpus study (Corio and Lapalme, 1999) that captions are often missing or are very general and uninformative; our collected corpus of informa-tion graphics supports their observainforma-tions.) Design choices include selection of chart type (bar chart, pie chart, line graph, etc.), organization of informa-tion in the chart (for example, aggregainforma-tion of bars in a bar chart), and attention-getting devices that high-light certain aspects of a chart (such as coloring one bar of a bar chart different from the others). Not only should the graphic designer’s intended mes-sage comprise the primary component of any sum-mary, but this intended message has a strong influ-ence on the saliinflu-ence of additional propositions that might be included in the summary.
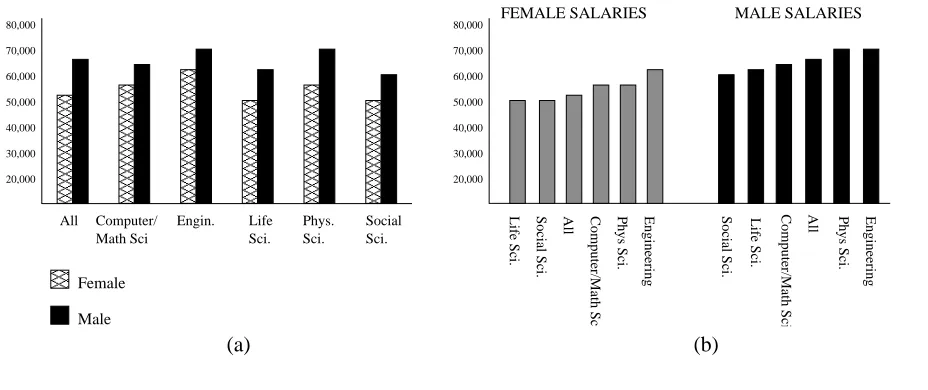
To see the importance of recognizing the graphic designer’s intended message, consider the two graphics in Figure 3. The one on the left, Fig-ure 3a, appeared in an NSF publication. Both graph-ics were constructed from the same data set. The intended message of the graphic in Figure 3a is that the salary of females is consistently less than that of males for each of the science and engineering dis-ciplines.1 Notice that the graphic designer selected an organization for the graphic in Figure 3a that fa-cilitated the comparison between male and female salaries in each field. A different display of the same data would facilitate different analyses. For example, the graph in Figure 3b depicts the same data as the graph in Figure 3a, yet the organiza-tion tends to draw attenorganiza-tion to comparisons within male and female groups rather than between them,
1
This graphic was constructed by a colleague who served on the NSF panel that prepared the report. Thus we know the intentions underlying the graphic.
and perhaps an integration/comparison of the mes-sages conveyed by the two subgraphs. Thus the in-tended message of the graphic in Figure 3b appears to be that the ranking of the disciplines by salary are about the same for both men and women. The dis-tinctions between presentation formats illustrate the extent to which the format can itself convey infor-mation relevant to the graphic designer’s intended message.
Now let us consider how the intended message influences additional information that might be in-cluded in a summary. Suppose that 1) the salary differential between females and males was signif-icantly larger in the life sciences than in other dis-ciplines and 2) the average salary for both females and males was much larger in engineering than in any of the other disciplines. Feature 1) would be particularly interesting and relevant to the intended message of Figure 3a, and thus should be included as part of the graphic’s summary. On the other hand, this aspect would be less relevant to the intended message of Figure 3b and thus not as important to include. Similarly, Feature 2) would be particularly relevant to the intended message of Figure 3b and thus should be given high priority for inclusion in its summary. Although an interactive system that could analyze a graphic to any desired level of de-tail might extract from the graphic the information in both 1) and 2) above, we contend that a summary of the graphic should prioritize content according to its relevance to the designer’s intended message.
3 Graphic Summarization
Our architecture for graphic summarization consists of modules for identifying the components of the graphic, hypothesizing the graphic designer’s in-tended message, planning the content of the sum-mary, organizing a coherent sumsum-mary, and interac-tive followup. The following sections discuss four of these modules.
3.1 Analyzing and Classifying a Graphic
The visual extraction module takes a screen image of an information graphic. It is responsible for rec-ognizing the individual components comprising the graphic, identifying the relationship of the different components to one another and to the graphic as a whole, and classifying the graphic as to type. This includes using heuristics (such as relative position of a string of characters) to identify the axis labels — for example, that the y-axis label is Delaware
2The source of the leftmost graph is the National Science
80,000 70,000 60,000 50,000 50,000 60,000 70,000 80,000 40,000 30,000 20,000 20,000 30,000 40,000
FEMALE SALARIES MALE SALARIES
Computer/ All Math Sci Engin. Phys. Sci. Sci. Social Sci.
Life Sci. Social Sci. All Computer/Math Sci. Phys Sci. Engineering Social Sci. Life Sci. Computer/Math Sci. All Phys Sci. Engineering
Life
Female
Male
[image:4.595.66.530.69.264.2](a) (b)
Figure 3: Two alternative graphs from the same data2
bankruptcy personal filings in Figure 1. Our cur-rent implementation deals only with gray scale im-ages (in pgm format) of bar charts, pie charts, and line graphs, though eventually it will be extended to handle color and other kinds of information graph-ics. The output of the visual extraction component is an XML file that describes the chart and all of its components.
3.2 Identifying the Intended Message
The second module of our architecture is respon-sible for inferring the graphic designer’s intended message. In their work on multimedia generation, the AutoBrief group proposed that speech act the-ory can be extended to the generation of graphical presentations (Kerpedjiev and Roth, 2000; Green et al., 2004). They contended that the graphic design was intended to convey its message by facilitating requisite perceptual and cognitive tasks. By percep-tual tasks we mean tasks that can be performed by simply viewing the graphic, such as finding the top of a bar in a bar chart; by cognitive tasks we mean tasks that are done via mental computations, such as computing the difference between two numbers.
The goal of our intention recognizer is the inverse of the design process: namely, to use the displayed graphic as evidence to hypothesize the communica-tive intentions of its author. This is done by an-alyzing the graphic to identify evidence about the designer’s intended message and then using plan recognition (Carberry, 1990) to hypothesize the au-thor’s communicative intent.
3.2.1 Evidence about Intention
Following AutoBrief (Kerpedjiev and Roth, 2000), we hypothesize that the graphic designer chooses
a design that makes important tasks (the ones that the viewer is intended to perform in recognizing the graphic’s message) as salient or as easy as possi-ble. Thus salience and ease of performance should be taken into account in reasoning about the graphic designer’s intentions.
The graphic design makes some tasks easier than others. We use a set of rules, based on research by cognitive psychologists, to estimate the relative ef-fort of performing different perceptual and cogni-tive tasks. These rules, described in (Elzer et al., 2004), have been validated by eye-tracking experi-ments. Since the viewer is intended to recognize the message that the graphic designer wants to convey, we contend that the designer will choose a graphic design that makes the requisite tasks easy to per-form. This was illustrated in the two graphics in Figure 3. The relative effort of performing a task is thus used as another source of evidence in our plan inference framework.
3.2.2 The Plan Inference Process
Our plan inference framework takes the form of a Bayesian belief network. Bayesian belief net-works have been applied to a variety of problems, including reasoning about utterances (Charniak and Goldman, 1993) and observed actions (Albrecht et al., 1997). The belief network uses plan operators, along with evidence that is gleaned from the infor-mation graphic itself (as discussed in the preceding section), to reason about the likelihood that vari-ous hypothesized candidate plans represent the in-tentions of the graphic designer.
Plan Operators for Information Graphics Our system uses plan operators that capture knowledge about how the graphic designer’s goal of conveying a message can be achieved via the viewer perform-ing certain perceptual and cognitive tasks, as well as knowledge about how information-access tasks, such as finding the value of an entity in a graphic, can be decomposed into simpler subgoals. Our plan operators consist of:
• Goal: the goal that the operator achieves
• Data-requirements: requirements that the data must satisfy in order for the operator to be ap-plicable in a graphic planning paradigm
• Display-constraints: features that constrain how the graphic is eventually constructed if this operator is part of the final plan
• Body: lower-level subgoals that must be ac-complished in order to achieve the overall goal of the operator.
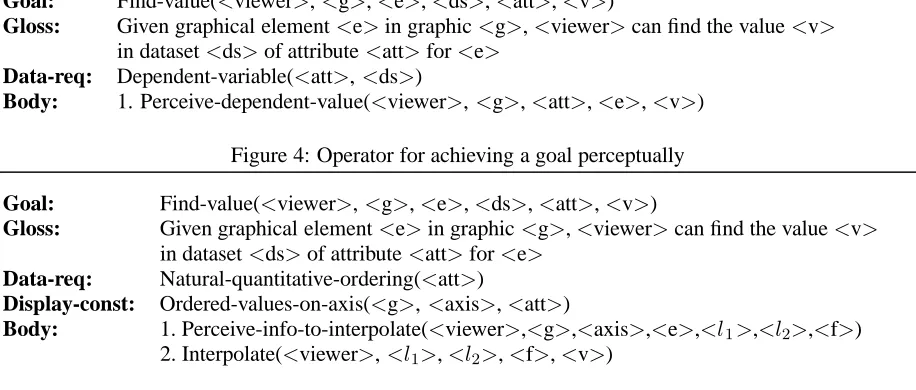
Figures 4 and 5 present two plan operators for the goal of finding the value<v>of an attribute<att>
for a graphical element<e>(for example, the value
associated with the top of a bar in a bar chart). The body of the operator in Figure 4 specifies that the goal can be achieved by a primitive perceptual task
in which the viewer just perceives the value; this could be done, for example, if the element in the graphic is annotated with its value. On the other hand, the body of the operator in Figure 5 captures a different way of finding the value, one that presum-ably requires more effort. It specifies the perceptual task of finding the values<l1>and<l2>
surround-ing the desired value on the axis along with the frac-tion<f>of the distance that the desired value lies
between <l1> and <l2>, followed by the
cogni-tive task of interpolating between the retrieved val-ues<l1>and<l2>.
Plan inference uses the plan operators to reasons backwards from the XML representation of the ob-served graphic (constructed by the visual extraction module briefly described in Section 3.1). The dis-play constraints are used to eliminate operators from consideration — if the graphic does not capture the operator’s constraints on the display, then the opera-tor could not have been part of a plan that produced the graphic. The data requirements are used to in-stantiate parameters in the operator — the data must have had certain characteristics for the operator to have been included in the graphic designer’s plan, and these often limit how the operator’s arguments can be instantiated.
fo-Goal: Find-value(<viewer>,<g>,<e>,<ds>,<att>,<v>)
Gloss: Given graphical element<e>in graphic<g>,<viewer>can find the value<v>
in dataset<ds>of attribute<att>for<e>
Data-req: Dependent-variable(<att>,<ds>)
[image:6.595.73.531.77.272.2]Body: 1. Perceive-dependent-value(<viewer>,<g>,<att>,<e>,<v>)
Figure 4: Operator for achieving a goal perceptually
Goal: Find-value(<viewer>,<g>,<e>,<ds>,<att>,<v>)
Gloss: Given graphical element<e>in graphic<g>,<viewer>can find the value<v>
in dataset<ds>of attribute<att>for<e>
Data-req: Natural-quantitative-ordering(<att>)
Display-const: Ordered-values-on-axis(<g>,<axis>,<att>)
Body: 1. Perceive-info-to-interpolate(<viewer>,<g>,<axis>,<e>,<l1>,<l2>,<f>)
2. Interpolate(<viewer>,<l1>,<l2>,<f>,<v>)
Figure 5: Operator that employs both perceptual and cognitive subgoals
cused entity in the caption given that the graphic de-signer’s plan includes the viewer performing Task-A, or 3) the probability that the viewer perform-ing Task-B will be part of the designer’s intended plan given that Task-A is part of his plan. (Note that there may be several alternative ways of perform-ing a particular task, as illustrated by the two plan operators displayed in Figures 4 and 5.) We have collected a rapidly expanding corpus of information graphics, and have analyzed a small part of this cor-pus to construct an initial set of probabilities. The results suggest that our approach is very promising. We will increase the number of analyzed graphics to improve the probability estimates.
3.3 Planning the Content of the Summary
The recognized intention of the graphic designer, such as to convey an overall increasing trend or to compare salaries of females and males in different disciplines as in Figure 3a, will provide one set of highly salient propositions that should be included in the graphic’s summary. Once the intentions have been recognized, other visual features of the graphic will influence the identification of additional salient propositions.
We conducted a set of experiments in which sub-jects were asked to write a brief summary of a set of line graphs, each of which arguably could be said to have the same high-level intention. Although each summary included the high-level intention, the summaries often differed significantly for different graphs. By comparing these with summaries of the same graph by different subjects, we have hypoth-esized that certain features, such as the variance of the data, can influence the generated summary, and that the importance of including a specific feature in
a summary is related to the high-level intention of the graphic. For example, variation in the data will be relevant for an intention of conveying a trend, but it will be less important than the overall slope of the data points. This impact of the intended mes-sage on the priority of including a specific feature in a graphic was illustrated in Section 2, where we showed how a significantly larger differential be-tween female and male salaries for one particular discipline would be more relevant to the summary of the graphic in Figure 3a than for the graphic in Fig-ure 3b. In addition, our experiments indicate that the strength of a feature in the graphic also influences its inclusion in a summary. For example, the more ragged a sequence of line segments, the more salient variance becomes for inclusion in a summary.
Once the content planning module has identified and ranked interesting features that might augment the intended message of the graphic, the most im-portant propositions will be organized into a coher-ent summary that can be stored for access in a digital library or presented to a user. In the future, we will also investigate integrating the summary of an infor-mation graphic with the summary of its surrounding text.
3.4 Interactive Followup
in-cluded in the initial message as indicative of ad-ditional information about the graphic that might be useful. Several kinds of followup will be pro-vided. For example, if the user requests focused followup, the system will categorize the remaining propositions (for example, extreme values, trend de-tail, etc.) and ask the user to select one of the cate-gories of further information. The system will then construct a followup message summarizing the most important (often all) of the remaining propositions in the selected category. This interactive followup will continue until either all the propositions have been conveyed or the user terminates the followup cycle.
4 Summary
This paper extends document summarization to the summarization of information graphics. It argues that an effective summary must be based on the message that the graphic designer intended to con-vey in constructing the graphic, and that this in-tended message strongly influences the relevance of other propositions that might be included in the summary. The paper describes our approach to graphic summarization, including our plan infer-ence system for inferring the intended message un-derlying a graphic. This work has many applica-tions. These include enabling information graphics to be accessed via content in a digital library, allow-ing access to information graphics via devices with small bandwidth (such as cellular phones), and most importantly making information graphics accessible to individuals with sight impairments via an interac-tive natural language system that can provide sum-maries at various levels of detail.
References
David Albrecht, Ingrid Zukerman, Ann Nicholson, and A. Bud. 1997. Towards a bayesian model for keyhole plan recognition in large domains. In Proceedings of the Sixth International Confer-ence on User Modeling, pages 365–376.
R. Barzilay, K. McKeown, and M. Elhadad. 1999. Information fusion in the context of multi-document summarization. In Proc. of the 37th Annual Meeting of the ACL, pages 550–557. Sandra Carberry. 1990. Plan Recognition in
Natu-ral Language Dialogue. ACL-MIT Press Series on Natural Language Processing. MIT Press. Eugene Charniak and Robert Goldman. 1993. A
bayesian model of plan recognition. Artificial In-telligence Journal, 64:53–79.
Marc Corio and Guy Lapalme. 1999. Generation of texts for information graphics. In Proceedings of
the 7th European Workshop on Natural Language Generation EWNLG’99, pages 49–58.
Stephanie Elzer, Nancy Green, Sandra Carberry, and James Hoffman. 2004. Incorporating per-ceptual task effort into the recognition of inten-tion in informainten-tion graphics. In Diagrammatic Representation and Inference: Proceedings of the Third International Conference on the Theory and Application of Diagrams, LNAI 2980, pages 255–270.
Robert Futrelle and Nikos Nikolakis. 1995. Ef-ficient analysis of complex diagrams using constraint-based parsing. In Proceedings of the Third International Conference on Document Analysis and Recognition.
Robert Futrelle. 1999. Summarization of diagrams in documents. In I. Mani and M. Maybury, edi-tors, Advances in Automated Text Summarization. MIT Press.
Nancy Green, Giuseppe Carenini, Stephan Kerped-jiev, Joe Mattis, Johanna Moore, and Steven Roth. 2004. Autobrief: An experimental system for the automatic generation of briefings in inte-grated text and graphics. International Journal of Human-Computer Studies. to appear.
Barbara Grosz and Candace Sidner. 1986. Atten-tion, Intentions, and the Structure of Discourse. Computational Linguistics, 12(3):175–204. Stephan Kerpedjiev and Steven Roth. 2000.
Map-ping communicative goals into conceptual tasks to generate graphics in discourse. In Proceed-ings of the International Conference on Intelli-gent User Interfaces, pages 60–67.
Daniel Marcu. 2000. The rhetorical parsing of un-restricted texts: A surface-based approach. Com-putational Linguistics, 26(3):395–448.
Vibhu Mittal. 1997. Visual prompts and graphical design: A framework for exploring the design space of 2-d charts and graphs. In Proceedings of the Fourteenth National Conference on Artifi-cial Intelligence, pages 57–63.
Gregory Silber and Kathleen McCoy. 2002. Effi-ciently computed lexical chains as an intermedi-ate representation for automatic text summariza-tion. Computational Linguistics, 28(4):487–496. Jin Yu, Jim Hunter, Ehud Reiter, and