81
Sales Forecasting using Data Mining
Heena Mansoori
1, Pooja Pawar
2Computer Engineering 1, 2,
Rajiv Gandhi Institute of Technology,Versova,Mumbai1, 2
Email: [email protected] 1 , [email protected] 2
Abstract- In today’s dynamically evolving and changing retail industry, traditional business models and
customer segments can no longer be taken for granted. Hence it is very important to leverage the numerous sources of data now readily available to the savvy business decision maker. This data can be used for business gain if the data is converted to information and then into knowledge. Timely identification of newly emerging trends in market is needed in business process. Sales patterns from inventory depicts market trends and can be used in forecasting which has great potential for decision making, strategic planning and market competition. In this paper we will analyze and implement data mining tools and techniques for sales forecasting then do an analysis of the sample or raw data to obtain a meaningful interpretation. Some of the data mining algorithms used in this paper are K-Means clustering algorithm, and then Most Frequent Pattern (MFP) to find frequencies of the items according to its sales and its property values.
Index Terms- Clustering, Most Frequent Pattern, Stock data, Decision Making, Data Mining
1. INTRODUCTION
After perusing different surveys on market’s status, most executives realize that technology is paramount
to driving growth and enhancing customer
engagement. With unpredictable consumer behavior,
spending, and demographic profiles changing
enormously, organizations are finding it difficult to adopt a traditional approach. Therefore, retailers are perpetually embracing Data mining and analytics as key facilitators of success. Data Mining and analytics enable retailers to better understand customer profiles and extrapolate preferences by potentially predicting future customer purchases, assaying traffic patterns in stores, mining loyalty data, their geographical patterns, and monitoring consumer’s behaviors. Retailers can dramatically enhance their connection to consumers and rely on Data Mining to identify new markets, new strategies, and new operational models to generate growth and profit. As it evolves in both sophistication and application, data mining and analytics will be leveraged by all departments of the retail organization.
2. EASE OF USE
2.1 Basket Analysis.
Combinations of products that frequently occur in transactions are found. For example, people who buy jacket in winter, also tend to buy socks (because a high proportion of them are planning to buy clothes for winter)
2.2 Sales Forecasting
Shows which product a customer buys during a particular season, and tries to predict when they will buy again. This type of analysis is used to determine when a product can remain obsolete.
2.3 Database Marketing
By assessing customer purchasing patterns and looking at the demographics of customers, one can build profiles, and create products resulting in more profit.
2.4 Merchandise Planning
Conducive for offline or online companies. For offline, a company looking to expand business by adding stores can evaluate the quantity and type of product for a particular season by looking at the graph generated for that item. For an online business, merchandise planning can help you determine stocking options and inventory warehousing
2.5 Market Segmentation
Available online at www.ijrat.org
82
3. LITERARTURE REVIEW
The retail industry is more dynamic than ever hence retailers must evolve to succeed in the next decade.Data mining researchers constantly try to find most feasible and efficient methods for extraction of useful patterns from stock data.For stock data mining most researchers use the history of transactions as it likely that may persist in future. These can help to predict the customer behaviour and future trend. A model for inventory decision support system was implemented in which factors like quantity, cost, safety factor, lead time and backorder discounts were used as decision variables, the algorithm is applied to find the optimal solution for the case where the lead time demands follows a general distribution. Another proposed a pattern based stock data mining approach for intra-stock mining which focus on finding frequently appearing patterns for the stock time series data and inter stock mining which discover the strong relationship among the several stocks.
Recently, it has been recognized that the partitioned clustering technique is well suited for clustering a large dataset the best well known clustering algorithm is the K-means algorithm and its variants. This algorithm is simple, reliable, and straightforward and is based firmly on foundation of analysis of variances. In addition to the K-means algorithm, other algorithms, like Particle Swarm Optimization (PSO) is another computational intelligence method which was applied for image clustering and other low dimensional datasets. For this project, we have used clustering algorithm to form clusters of data and MFP to find association patterns amongst them. The classification of similar objects into several groups, or partitioning of data into subsets called clusters. Data in each subset share some common proximity value accordingly to some defined distance measure.
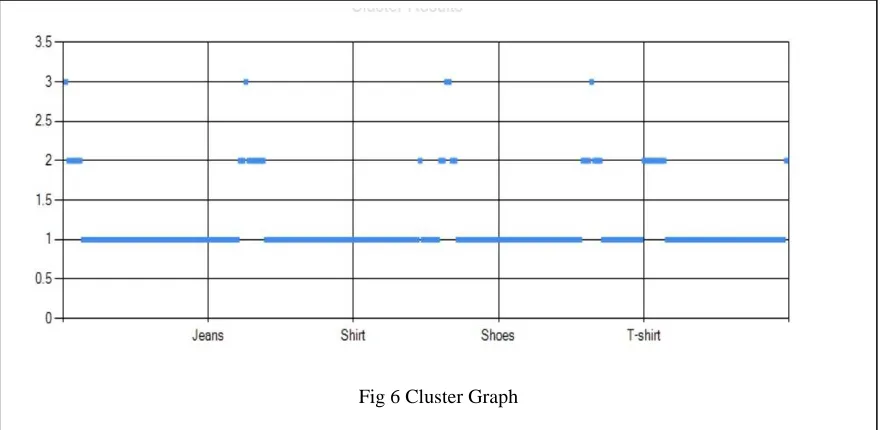
In this work we have proposed an algorithm for mining patterns of huge stock data to show factors affecting the sale of products. By using k-means clustering algorithm we form clusters of data based on its sold quantities for each category of items i.e. Dead-Stock (DS), Slow-Moving (SM) and Fast- Moving (FM).Most Frequent Pattern (MFP) algorithm to find frequencies of property values of the corresponding items. MFP provides frequent patterns of items in each category of products. This work is similar to Apriori algorithm used to find strong association patterns which are visible. From the experimental results extracted from sample data, it is illustrated that the proposed algorithm of k-mean and association of MFP can generate more useful and beneficent patterns from large stock data.
4. PROPOSED SYSTEM
In this paper we have proposed an algorithm for mining patterns of huge stock data to show the factors affecting the sales of product. In the first phase, we divide the stock data into nine different clusters categorically using k-means algorithm. On the basis of its sold quantity, each category of items is formed which are named as Dead-Stock (DS), Slow-Moving (SM) and Fast- Moving (FM) and the season in which they were sold i.e. Winter, Summer and Rainy .Moving with second phase we have proposed Most Frequent Pattern (MFP) algorithm which is used to extract frequent patterns of item attributes from each category of products. Cluster analysis techniques are widely used in market research when working with data from various surveys and test panels. Market researchers use cluster analysis to partition the population of consumers to form market segmentation, Intra and inter stock patterns and to understand better association patterns between them.
83
4.1 K-Means
K-means is a typical clustering algorithm and has been used for classification of data for decades. In this approach the data objects are classified on the basis of their attributes into k number of clusters. Euclidean distance is used to calculate proximity between clusters.
This algorithm aims at minimizing an objective function, in this case a squared error function. The objective function is
Where
Is a chosen distance is measure between a data point X i(j) and the cluster center c j , is an indicator of the distance of the n data points from their respective cluster centers. The steps of the K-means algorithm are as described below
• Place K points into the space represented by the objects that are being clustered; these points represent initial group centroids.
• Assign each object to the group that has the closest centroid
• When all objects have been assigned, recalculate the positions of the K centroids.
Repeat Steps 2 and 3 until the centroids no longer move. This produces a separation of the objects into groups from which the metric to be minimized can be calculated
Available online at www.ijrat.org
84
4.2. MOST FREQUENT PATTERN
Association rule mining is a well-defined and renowned technique used for extracting correlations, frequent patterns, associations among sets of item in Relational databases, transactional databases or other information repositories. Association rules are widely
used in areas such as risk management,
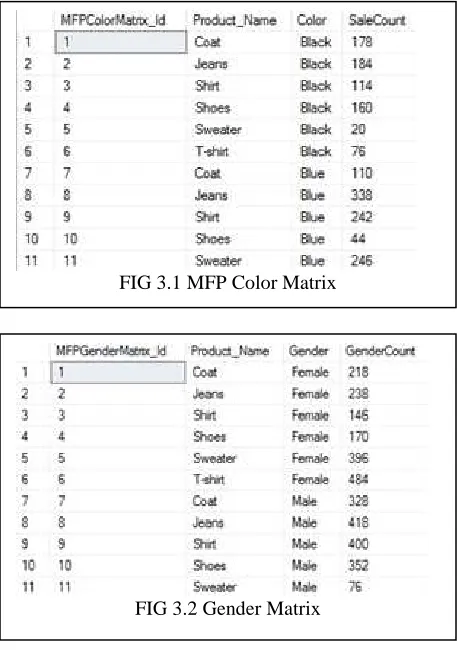
telecommunications, market basket analysis, inventory control, and in medical field. Apriori algorithm is the core of various algorithms used in data mining. It analyzes a dataset for determining which combinations of products occur together frequently .MFP efficiently generates frequent patterns and strong association between data used. For this purpose a matrix containing counted values of corresponding properties of each product has been used.
In the tables shown above we have generated MFP results by using count of attributes along with its
properties from Clustered Data Results and
accordingly formed 3 matrixes on the basis of Color, Gender and Season.
5. RESULTS
This is the final forecasted results showing following values
• MFP id: This tab gives a unique item id for each
product item present in the Dataset. For
experimental purpose initially 15 product items used for three seasons i.e. Rainy, Winter and Summer • Product Name: This tab lists down all the available
product items on the basis of which these products are classified Color wise, Gender wise and Season wise
• Color: This tab gives the values of all the available
colors of product items. • Color_count: This tab gives the total number of
color counts for that product sold.
• Gender: This tab helps the admin to identify the product purchased by whom either by a male or a female customer. This is an important parameter to be known for decision making and launching product in market.
• Gender_count: This tab gives the number of
customers according to gender to identify the product sold.
• Season: This tab corresponds to the season in which that product was sold. This too helps the admin to identify the time to launch that product and forecast easily.
• Season_Count: This tab gives the total number of products sold in that season.
Hence by analyzing these results, retailers can
[image:4.595.294.531.101.251.2]understand what is currently trending in market, which product is preferred more by customers and during which season. By careful observation, retailers can predict what will be the customer behavior in future and can devise sales plan accordingly resulting in profits.
FIG 3.1 MFP Color Matrix
FIG 3.2 Gender Matrix
[image:4.595.66.295.319.644.2]85
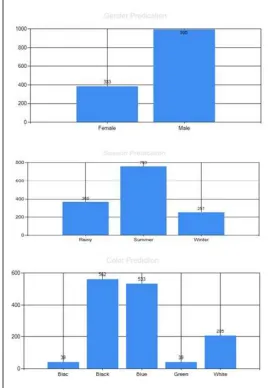
The graph shown in Fig 5 shows Color wise,Gender wise and Season-wise prediction for product coat.
6. CONCLUSION
In this paper, the problem of pattern recognition from stock data is addressed. Hybrid clustering association mining approach is proposed to classify stock data and find a more compact associated pattern of sales. From the results it is clearly evident that the proposed approach is very efficient and highly reliable for mining patterns of huge stock data and predicting the factors affecting the sales of product.
We articulated most frequent pattern of products by using their properties from the inventory system. We assimilated the trends of selling products by meticulously analyzing the forecasted results formed by using Product matrix. The limitation of study is, that it requires a data format with specific attributes. In future we will extend our work to implement at the preprocessing stage where the system loads a single dataset file and applies classification algorithms; here we can add multiple dataset files for simultaneous operations like cluster analysis, MFP and forecasting result with final result graphs. We can add this functionality which will make this application capable to extract more precise information in large amount.
[image:5.595.303.573.354.742.2]
Fig 4.Product Matrix
Available online at www.ijrat.org
86
REFERENCES
[1] http://www.mckinsey.com/industries/retail/ou r-insights/how-retailers-can-keep-up-with-consumers..
[2] http://www.inflibnet.ac.in/ojs/index.php/MI/a rticle/viewFile/894/807.
[3] https://pdfs.semanticscholar.org/66cd/cad99a 8bc9b733c8f9a5d42b098844c13d42.pdfDrSa nkar Rajagopal International Journal of Database Management Systems ( IJDMS ) Vol.3, No.4, November 2011 “CUSTOMER
DATA CLUSTERING USING DATA
MINING TECHNIQUE “
[4] M.Cheng Lo, “ Decision support system for the integrated invent0ry model with general distribution demand. Information technology journal 6(7) PP.1069-1074, 2007.
[5] Jo Ting, “Mining of stock data: inter- and inter-stock pattern associative classification” proceedings of 2006 international conference on data mining Las Vegas,USA, June 2006.
[6] L.K.Soon, Sang Ho Lee, “An Empirical
Study of Similarity Search in Stock Data”
Australian Computer Society, Second
International Workshop on Integrating AI and Data Mining, AIDM-2007. pp 31-38. [7] Harvinder Singh “Implementation benefit to
business intelligence using Data MiniNG Techniques “ International Journal of Computing & Business Intelligence using Data Mining techniques.
[image:6.595.82.522.99.314.2][8] S.Vidya et al, / (IJCSIT) International Journal of Computer Science and Information Technologies, Vol. 6 (4) , 2015, 32663268 -Web Mining- Concepts and Application S.Vidya, K.Banumathy