International Journal of Research in Advent Technology, Vol.6, No.5, May 2018
E-ISSN: 2321-9637
Available online at www.ijrat.org
893
Optimization of MIG welding process parameters for hardness
and strength of welding joint using Grey relational analysis
D.Bahar1, Md. Nawaz Sharif2, K. Shravan Kumar3 and D. Reddy4
1, 2, 3 & 4
Department of Mechanical Engineering, Rajiv Gandhi University of knowledge technologies Basar, Nirmal (TS)-504107
Email: [email protected]
Abstract- Aim of this communication is to investigate the process parameters of Metal inert gas (MIG) welding to optimize the
hardness and ultimate tensile strength (UTS) of a weld bead formed between dissimilar materials: mild steel (MS 1020) and stainless steel (SS 316) using Taguchi technique and Grey relational analysis. By inducing 4 levels of process parameters: arc voltage, welding speed, gas flow rate and wire feed rate 16 experiments are conducted and consequently L 16 orthogonal array is constructed. Subsequently MINITAB software is employed to analyze and optimize the experiments. Through analysis of variance (ANOVA) contribution and effect of individual parameter is also investigated.
Index Terms: MIG welding, Taguchi, Grey Relational analysis, ANOVA, S/N ratio, UTS, MS 1020, SS 316
1. INTRODUCTION
Metal Inert Gas (MIG) welding is one of the arc welding process, also known as Metal Active Gas (MAG) and Gas Metal Arc Welding (GMAW) broadly used for welding a variety of ferrous and non ferrous materials. In MIG welding source of heat for melting the plates is produced by maintaining the arc between the plates those are to be welded and consumable electrode which is to be continuously fed through the spool and the rollers. The weld pool is protected by externally supplied shielding gas. The variety of shielding gases used in mig welding are
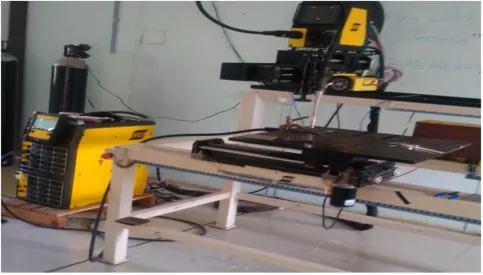
[image:1.595.56.540.464.739.2]carbon-di-oxide, argon and mixture of argon and helium are used. There is no requirement of additional filler metal in MIG electrode itself acts as the filler metal. MIG welding process takes place in three steps heating, melting and solidification of plates including melting and solidification of electrode, which forms the bond between the plates. A photographic view of an automatic MIG welding machine is shown in Fig. 1 on which experiments are performed.
Figure 1: Automatic MIG welding machine
1.1 Working principle
In MIG welding the electrode in the form of coil
International Journal of Research in Advent Technology, Vol.6, No.5, May 2018
E-ISSN: 2321-9637
Available online at www.ijrat.org
894
passed around electrode from the same torch. Usually argon, helium, or a suitable mixture of these is used as a inert gas to protect the weld pool from atmosphere. When gas is supplied, it gets ionized and an arc is initiated in between electrode and work piece results in to production of heat. Electrode melts due to the heat and molten filler metal falls on the heated joint. Continuous welding with coiled wire results in high metal depositions rate and high welding speed. In general, filler wire is connected to the positive terminal of DC source forming one of the electrodes and workpiece is connected to the negative terminal. The power source could be constant voltage DC power source with electrode positive which yields a stable arc and smooth metal transfer with less spatter for the entire current range. The gas shield around it does not ionized, which prevents weld against atmospheric contamination and surface oxidation.
1.2 Effecting Parameters in MIG welding
Weld quality and deposition rates are affected by the following welding parameters:
• Electrode size, Welding current, Arc voltage • Arc travel speed, welding position
• Gas Flow rate, Shielding Gas composition • Electrode extension
Electrode diameter influences the weld bead configuration, the depth of penetration, bead width and welding speed. As a general rule, for the same welding current and wire feed speed setting the arc becomes more penetrating as the electrode diameter decreases. Commonly used electrode sizes are (mm): 0.8, 1.0, 1.2,1.6 and 2.4. The level of welding current used in MIG has the highest effect on the deposition rate, the weld bead size, shape and penetration. In MIG welding, metals are usually welded with direct current electrode positive (DCEP), opposite to TIG welding because it facilitates the maximum heat input to the electrode results in to high deposition rate. Keeping all the other welding parameters constant, increase in current will increase the depth and the width of the weld penetration as well as the size of the weld bead. The arc voltage is one of the most crucial parameter in MIG welding. When all other variables: electrode composition and sizes, the type of shielding gas and the welding technique are same, arc length is directly related to the arc voltage. Excessively high and low voltage causes an unstable arc. On one hand excessive voltage causes the formation of excessive spatter and porosity. On the other hand low voltage causes porosity and overlapping at the edges of the weld bead. Value of arc voltage to be used, depends on base metal thickness, type of joint, electrode composition and size, shielding gas composition, welding position, type of weld etc. The main function of shielding gas is to protect the arc and molten weld pool from atmosphere gases (oxygen and nitrogen). If weld pool not protected properly then formation of oxides and nitrites will take place which are responsible for weld deficiencies such
as porosity, slag inclusion and weld embrittlement. Therefore shielding gas and its flow rate have a significant effect on Arc characteristics, penetration, Mode of metal transfer and weld bead profile, cleaning action of weld bead, speed of welding, weld metal mechanical properties. Generally Argon, helium and argon-helium mixtures are used in wider applications for welding of non-ferrous metals and alloys. CO2 and Argon are used in Carbon steel. The welding speed is the rate at which arc travels along the work- piece. For a constant given current, slower welding speed proportionally provides larger bead and higher heat input to the base metal owing to longer heating time. The welding speed is a crucial parameter in MIG welding should be decided by the operator in accordance with the joint fit-up, thickness of the metal being welded and welding position.
1.3 Optimization
Taguchi Technique
Taguchi technique is a statistical tool designed by Taguchi and Konishi. Taguchi technique identifies proper control factors to obtain the optimum results of the process. Orthogonal Arrays (OA) are employed to perform a set of experiments to analyze the data.
Analysis of S/N ratio:
In Taguchi technique, the term ‘signal’ represents the desirable value for the output characteristic and the term ‘noise’ represents the undesirable value for the output characteristic. S/N ratios for different conditions are:
1. Nominal is the best characteristic
S / N = 10 log10(
𝑌̅ 𝑆𝑦2)…(1)
2. Smaller is the best characteristic
S / N = - 10 log10(
∑ 𝑦2 𝑛 )…(2) 3. Larger the better characteristics
S / N = -10 log10(
1 𝑛∑
1 𝑦2)…(3)
Where; n is the number experiments performed and y is the output response obtained by the experiment.
Analysis of Variance:
The purpose of ANOVA is to investigate which parameter significantly affects the performance characteristics. And also calculates the percentage of influence of each parameter on different responses.
Grey Relational Analysis:
International Journal of Research in Advent Technology, Vol.6, No.5, May 2018
E-ISSN: 2321-9637
Available online at www.ijrat.org
895
Grey relational analysis and data preprocessing:
In Grey Relational analysis, the first step is data pre-processing to avoid the problem of different scales, units and targets. The following steps are followed in GRA
Experimental data are normalized in the range between zero and one.
On the basis of normalized experimental data grey relational coefficients are calculated.
The Grey relational grades are computed by averaging the weighted grey relational coefficients corresponding to each performance characteristic. Then optimal levels of process parameters are
selected. Normalization:
In the analysis of grey relation for ‘higher is better’ response normalization done by equation (4) and when the response is ‘lower is better’, normalization done by equation (5).
Xi*(k) =
.
𝑋𝑖(𝑘)−𝑋𝑖min(𝑘) 𝑋𝑖𝑚𝑎𝑥(𝑘)−𝑋𝑖min(𝑘)
…(4)
Xi *
(k) =
.
𝑋𝑖𝑚𝑎𝑥(𝑘)−𝑋𝑖(𝑘) 𝑋𝑖𝑚𝑎𝑥(𝑘)−𝑋𝑖min(𝑘)
…(5)
Where;
Xi* (k) and Xi (k) are the normalized data and observed data, respectively, for ith experiment using Kth response. The smallest and largest values Xi(k) in the K
th
response are Ximin(k) and Xi max(k), respectively.
Determination of grey relation coefficient:
After pre-processing the data, the grey relation coefficient (GRC) ζi(k) for the K
th
response characteristics in the ith experiment can be expressed as following:
ζi(k) =∆ min +ζ∆max
∆𝑖 (k) +ζ∆max…(6) where;
X0i (k) = denotes reference sequence , X*j(k) =
denotes the comparability sequence
ς Є [0,1], is the distinguishing factor; 0.5 is widely accepted.
Δi = |X0*(k)-Xj*(k)| = differnece in absolute value
between X0*(k) and Xj*(k)
Δmin=min(jЄi)min(k)|X0*(k)-Xj*(k)| = smallest value
ofΔi.
Δmax=max(jЄi)max(k)|X0*(k)-Xj*(k)| = largest value
ofΔi.
Calculation of grey relational grade:
After calculating GRC, the grey relational grade (GRG) is obtained as:
γi=(
∑w×ζi(k) 𝑚 )…(7)
Here γi is the Grey Relational Grade, n is the number of
responses, m is the number of run and w is the weight factor. Amount of influence of a response can be controlled in deciding the optimum machining parameters varying the
value of w keeping in mind ∑1n w should be equal to 1.
Singh and Dhami [1] analysed the defects in metal inert gas
welding Of A312tp316l stainless steel pipe using Taguchi technique by considering current, voltage and welding speed and observed that voltage contributes major proportion for the quality of weld bead.
Mishra , Panda and Mohanta [2] Optimized the process
parameters in MIG welding for high depth of penetration on the basis of process parameters: welding current, welding voltage and welding speed.
Sheik and Achwal [3] studied the effect of MIG welding
process parameters on weldability of Galvenize steel. welding current ,welding voltage, welding speed were considered as input parameters and out put responses were penetration,bead width and heat generation.
Arya and Chaturvedi [4] studied the influence of welding
parameters like wire diameter, welding current, arc voltage, welding speed, and gas flow rate. The objective function have been chosen in relation to parameters of MIG welding bead geometry Tensile strength, Bead width, Bead height, Penetration and Heat affected zone (HAZ) for quality target
Rizvi and Tewari [5] performed experiments forparametric
optimization of welding parameters such as arc voltage, wire feed speed and shielding gas flow rate for IS 2062 structural steel using Taguchi method and Grey relational analysis for tensile strength, Micro hardness, toughness, and Micro structure.
Pal and Handuja [6] observed the effect of different
welding parameters: welding voltage, filler wire rate and v-angle etc. on the strength of the weld joint and elongation produced during the tensile test. They found that that the most significant parameter which affects UTS value of welding joint is V- butt angle and the least significant is wire feed rate
Chavda et al. [7] Observed the influence of welding
parameters like welding current, welding voltage, Gas flow rate, wire feed rate, etc. on weld strength, weld pool geometry of Medium Carbon Steel material during welding.
Patel and Chaudhary [8] made review on optimization of
mechanical properties and found that various parameters affect the hardness and ultimate tensile strength of AISI 1020.
Kumar and Brar [9] investigated to find the best process
parameters: welding current, voltage, welding speed and number of passes for hardness and residual stresses.
Gangadhar et al. [10] performed MIG welding on mild
steel pieces to optimize the hardness and tensile strength of the joint. It was found that that Increase in current and weld speed increases the ultimate tensile strength and hardness of welded joint.
2. MATERIALS AND METHODS
International Journal of Research in Advent Technology, Vol.6, No.5, May 2018
E-ISSN: 2321-9637
Available online at www.ijrat.org
896
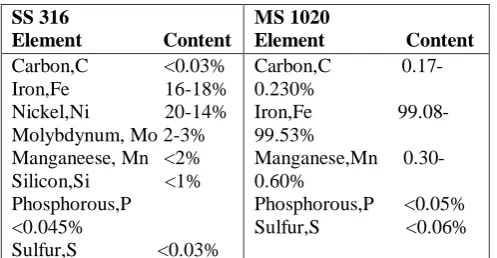
proper dimensions are prepared. Chemical composition of SS 316 and MS 1020 is given in Table 1
Table 1: Chemical composition of used materials
SS 316
Element Content
MS 1020
Element Content
Carbon,C <0.03% Iron,Fe 16-18% Nickel,Ni 20-14% Molybdynum, Mo 2-3% Manganeese, Mn <2% Silicon,Si <1% Phosphorous,P <0.045%
Sulfur,S <0.03%
Carbon,C 0.17-0.230%
Iron,Fe 99.08-99.53%
Manganese,Mn 0.30-0.60%
Phosphorous,P <0.05% Sulfur,S <0.06%
Step II: In welding operation some parameters kept constant
and some of the parameters are varied (in 4 leveles) as given in Table 2
Fixed parameters:
a) Welding current (varied accordingly voltage 120-270 amp)
b) Electrode diameter (1.2mm) c) Arc length (1.2-1.5 cm)
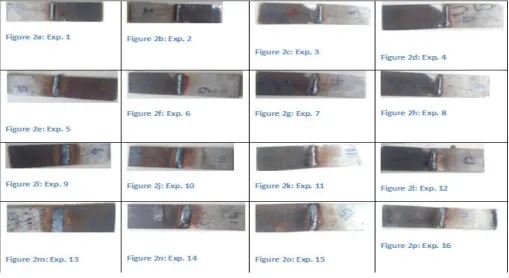
Step III: Hardness and Tensile tests are conducted on the
welded pieces (shown in Fig. 2) to know the ultimate tensile strength (UTS) and hardness of welded joints. Results of UTS and hardness (RHC) are tabulated in Table 3.
[image:4.595.309.564.117.215.2]
Table 2: varied parameters with their levels
Varied parameters Level Level Level Level
1 2 3 4
Welding speed, S
(mm/min) 100 200 300 400
Arc voltage, V (V) 20 25 30 35
Gas flow rate, GFR
(mm3/min) 12 15 18 21
Wire feed rate, WFR
[image:4.595.40.289.163.292.2](m/min) 3 4 5 6
Table 3: L 16 Orthogonal array along with results
Exp. V GFR WFR S U.T.S (MPa) RHC
1 20 12 3 100 164.96 55
2 20 15 4 200 66.02 50
3 20 18 5 300 97.7 67
4 20 21 6 400 135.29 51
5 25 12 4 300 224.4 50
6 25 15 3 400 201.5 55
7 25 18 6 100 163.31 54
8 25 21 5 200 163.31 53
9 30 12 5 400 232.66 46
10 30 15 6 300 202.85 40
11 30 18 3 200 135.85 56
12 30 21 4 100 163.36 57
13 35 12 6 200 233.21 38
14 35 15 5 100 203.13 47
15 35 18 4 400 165.25 57
International Journal of Research in Advent Technology, Vol.6, No.5, May 2018
E-ISSN: 2321-9637
Available online at www.ijrat.org
[image:5.595.38.548.118.396.2]897
Figure 2: Based upon L 16 orthogonal array 16 welding experiments are performed
3. RESULTS AND DISCUSSION
[image:5.595.37.287.541.726.2]From Table 3, values are employed in MINITAB software to analyze the main effect of S/N ratios and optimal conditions. Fig. 3 shows the main effect plot for S/N ratios and Table 4 presents the analysis of variance of hardness.
Figure 3: Main effect plot for S/N ratios of hardness
Table 4: ANOVA for Hardness
In this study lager value of hardness is desirable and higher S/N ratios indicate optimal condition. Therefore optimal process parameters for hardness are evaluated and presented in Table 5. From Table 4, it is also clear that contribution of gas flow rate is higher (39.09%) and of welding speed is lower (8.16%). Error contribution is only 0.32% which vindicates a robust design of experiment.
Table 5: Optimal setting of Process parameters for hardness
Parameter Levels values
Welding voltage(v) 1 20
International Journal of Research in Advent Technology, Vol.6, No.5, May 2018
E-ISSN: 2321-9637
Available online at www.ijrat.org
898
Wire feed rate(m/min) 1 3
Welding speed(mm/min) 1 100
[image:6.595.311.506.200.417.2]From Table 5 it can be inferred that except gas flow rate all other parameters should be low for optimum hardness. Like for hardness, similar analysis is performed for ultimate tensile strength (UTS). Fig. 4 shows the main effect plot for S/N ratios and Table 6 presents the analysis of variance of hardness.
[image:6.595.311.509.200.416.2]Figure 4: Main effect plot for S/N ratios of UTS
Table 6: ANOVA for UTS
[image:6.595.36.288.217.378.2]In this study lager value of UTS is desirable and higher S/N ratios indicate optimal condition. Therefore optimal process parameters for toughness are evaluated and presented in Table 7. From Table 6, it is also clear that contribution of gas flow rate is higher (55.98%) and of welding speed is lower (3.63%). Error contribution is about 3.70% which vindicates a robust design of experiment.
Table 7: Optimal setting of Process parameters for UTS
Parameter Levels values
Welding voltage(v) 1 20
Gas flow rate(lit/min) 1 12
Wire feed rate(m/min) 4 6
Welding speed(mm/min) 4 400
From Table 5 it can be inferred that welding voltage & gas flow rate should be low for optimum UTS while wire feed rate and welding speed should be higher.
3.1 Multi response optimization
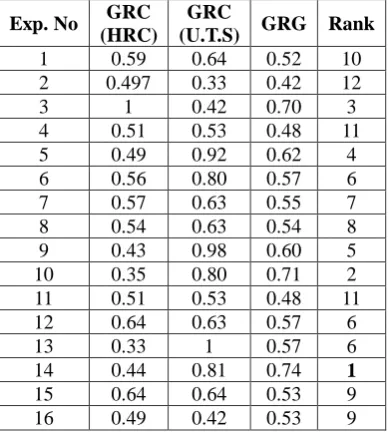
In order to optimize hardness as well as UTS, multi response optimization i.e Grey relational analysis is employed for which grey relational coefficients (GRC), grey relational grades (GRG) and ranks are calculated and presented in Table 8.
Table 8: Grey relational coefficients, grades and ranks
Exp. No GRC
(HRC)
GRC
(U.T.S) GRG Rank
1 0.59 0.64 0.52 10
2 0.497 0.33 0.42 12
3 1 0.42 0.70 3
4 0.51 0.53 0.48 11
5 0.49 0.92 0.62 4
6 0.56 0.80 0.57 6
7 0.57 0.63 0.55 7
8 0.54 0.63 0.54 8
9 0.43 0.98 0.60 5
10 0.35 0.80 0.71 2
11 0.51 0.53 0.48 11
12 0.64 0.63 0.57 6
13 0.33 1 0.57 6
14 0.44 0.81 0.74 1
15 0.64 0.64 0.53 9
16 0.49 0.42 0.53 9
Grey relational grades from Table 8 are analyzed in
MINTAB for multi response optimization. Fig. 5 shows the main effect plot for S/N ratios and Table 9 presents the analysis of variance.
[image:6.595.32.288.423.533.2] [image:6.595.317.567.477.643.2]International Journal of Research in Advent Technology, Vol.6, No.5, May 2018
E-ISSN: 2321-9637
Available online at www.ijrat.org
899
Table 9: ANOVA for multi response
Since higher values of S/N ratios indicates optimality therefore corresponding optimal process parameters for multi response are presented in Table 10. From Table 9, it is also clear that contribution of welding speed is higher (37.40%) and of welding voltage is lower (8.75%).
Table 10: Optimal setting of Process parameters for UTS
Parameter Levels values
Welding voltage(V) 4 35
Gas flow rate(lit/min) 2 15
Wire feed rate(m/min) 3 5
Welding speed(mm/min) 3 300
From Table 10 it can be inferred that welding voltage should be higher for optimum UTS as well as hardness.
4. CONCLUSIONS
Following conclusions can be drawn from this study: 1. In optimization of hardness of the welding joint,
contribution of gas flow rate is higher and apart from gas flow rate other parameters should be low. 2. Like for hardness, in optimization of UTS
contribution of gas flow rate is higher. it is also observed that welding voltage and gas flow rate should be lower but wire feed rate and welding speed should be higher to optimize UTS.
3. In multi response optimization i.e optimization of hardness as well as UTS contribution of welding speed is higher and welding voltage should be high.
REFERENCES
[1] Rajendra, S; Dhami, SS. (2014): Analysis of Defects in Metal Inert Gas Welding Of A312tp316l Stainless Steel Pipe Using Taguchi Optimization Method And Testing .The International Journal Of Engineering And Science, 3 (6), pp. 11-22.
[2] Mishra, B; Panda, R R; Mohanta, D K. (2014): Metal Inert Gas (Mig) Welding Parameters Optimization. International Journal of Multidisciplinary and Current Research, 2 (May/June Issue), pp. 637-639.
[3] Sheik, I; Vishal A. (2014): An Experimental Study on the Effect of MIG Welding Parameters on the Weldability of GalvenizeSteel. International Journal on Emerging Technologies, 5(1), pp. 146-152.
[4] Dinesh, M A; Vedansh C; Jyoti V. (2013): Parametric Optimization of MIG Process Parameters Using Taguchi and Grey relational analysys. International journal of research in engineering & Applied sciences, 3 (6), pp. 1-17. [5] Saadat A R; Tewari, S P. (2017): Multi Objective Optimization by Application of Taguchi Based Grey Relational Analysis for GMA Welding of IS2062 Structural Steel. Mechanics and Mechanical Engineering, 21 (3), pp. 717–729.
[6] Amith, P; Sachin, H (2014): The analysis of MIG welding parameters for multi response optimization using Taguchi’s Orthogonal array and Grey relational approach. International Journal of Advance Research in Engineering, Science & Technology, pp. 1-5.
[7] Satyaduttsinh, P; Jayesh V D; Tushar M P. (2014): A Review on Optimization of MIG Welding Parameters using Taguchi’s DOE Method.International Journal of Engineering and Management Research, 4 (1), pp. 16-21. [8] Chandresh, N P; Chaudhary, S J. (2012): A Review on
Optimization of Mechanical Properties for AISI 1020 on MIG welding. International Journal of Advanced Engineering Research and Studies, 2 (1), pp. 97-99.
[9] Rakesh K; Gurinder S B. (2017): Optimization of Process Parameters for MIG Welding by Taguchi Method. International Journal of Scientific Research Engineering & Technology, 6 (7), pp. 756-768.