Learning to Predict Readability using Diverse Linguistic Features
Rohit J. Kate1 Xiaoqiang Luo2 Siddharth Patwardhan2 Martin Franz2 Radu Florian2 Raymond J. Mooney1 Salim Roukos2 Chris Welty2
1Department of Computer Science
The University of Texas at Austin
{rjkate,mooney}@cs.utexas.edu
2IBM Watson Research Center
{xiaoluo,spatward,franzm,raduf,roukos,welty}@us.ibm.com
Abstract
In this paper we consider the problem of building a system to predict readability of natural-language documents. Our sys-tem is trained using diverse features based on syntax and language models which are generally indicative of readability. The experimental results on a dataset of docu-ments from a mix of genres show that the predictions of the learned system are more accurate than the predictions of naive hu-man judges when compared against the predictions of linguistically-trained expert human judges. The experiments also com-pare the performances of different learn-ing algorithms and different types of fea-ture sets when used for predicting read-ability.
1 Introduction
An important aspect of a document is whether it is easily processed and understood by a human reader as intended by its writer, this is termed as the document’s readability. Readability in-volves many aspects including grammaticality, conciseness, clarity, and lack of ambiguity. Teach-ers, journalists, editors, and other professionals routinely make judgements on the readability of documents. We explore the task of learning to automatically judge the readability of natural-language documents.
In a variety of applications it would be useful to be able to automate readability judgements. For example, the results of a web-search can be or-dered taking into account the readability of the
retrieved documents thus improving user satisfac-tion. Readability judgements can also be used for automatically grading essays, selecting in-structional reading materials, etc. If documents are generated by machines, such as summariza-tion or machine translasummariza-tion systems, then they are prone to be less readable. In such cases, a read-ability measure can be used to automatically fil-ter out documents which have poor readability. Even when the intended consumers of text are machines, for example, information extraction or knowledge extraction systems, a readability mea-sure can be used to filter out documents of poor readability so that the machine readers will not ex-tract incorrect information because of ambiguity or lack of clarity in the documents.
2 Related Work
There is a significant amount of published work on a related problem: predicting the reading diffi-culty of documents, typically, as the school grade-level of the reader from grade1to12. Some early methods measure simple characteristics of docu-ments like average sentence length, average num-ber of syllables per word, etc. and combine them using a linear formula to predict the grade level of a document, for example FOG (Gunning, 1952), SMOG (McLaughlin, 1969) and Flesh-Kincaid (Kincaid et al., 1975) metrics. These methods do not take into account the content of the doc-uments. Some later methods use pre-determined lists of words to determine the grade level of a document, for example the Lexile measure (Sten-ner et al., 1988), the Fry Short Passage measure (Fry, 1990) and the Revised Dale-Chall formula (Chall and Dale, 1995). The word lists these methods use may be thought of as very simple language models. More recently, language mod-els have been used for predicting the grade level of documents. Si and Callan (2001) and Collins-Thompson and Callan (2004) train unigram lan-guage models to predict grade levels of docu-ments. In addition to language models, Heilman et al. (2007) and Schwarm and Ostendorf (2005) also use some syntactic features to estimate the grade level of texts.
Pitler and Nenkova (2008) consider a differ-ent task of predicting text quality for an educated adult audience. Their system predicts readabil-ity of texts from Wall Street Journal using lex-ical, syntactic and discourse features. Kanungo and Orr (2009) consider the task of predicting readability of web summary snippets produced by search engines. Using simple surface level fea-tures like the number of characters and syllables per word, capitalization, punctuation, ellipses etc. they train a regression model to predict readability values.
Our work differs from this previous research in several ways. Firstly, the task we have consid-ered is different, we predict the readability of gen-eral documents, not their grade level. The doc-uments in our data are also not from any single domain, genre or reader group, which makes our
task more general. The data includes human writ-ten as well as machine generated documents. The task and the data has been set this way because it is aimed at filtering out documents of poor quality for later processing, like for extracting machine-processable knowledge from them. Extracting knowledge from openly found text, such as from the internet, is becoming popular but the quality of text found “in the wild”, like found through searching the internet, vary considerably in qual-ity and genre. If the text is of poor readabilqual-ity then it is likely to lead to extraction errors and more problems downstream. If the readers are going to be humans instead of machines, then also it is best to filter out poorly written documents. Hence identifying readability of general text documents coming from various sources and genres is an im-portant task. We are not aware of any other work which has considered such a task.
Secondly, we note that all of the above ap-proaches that use language models train a lan-guage model for each difficulty level using the training data for that level. However, since the amount of training data annotated with levels is limited, they can not train higher-order lan-guage models, and most just use unigram models. In contrast, we employ more powerful language models trained on large quantities of generic text (which is not from the training data for readabil-ity) and use various features obtained from these language models to predict readability. Thirdly, we use a more sophisticated combination of lin-guistic features derived from various syntactic parsers and language models than any previous work. We also present ablation results for differ-ent sets of features. Fourthly, given that the doc-uments in our data are not from a particular genre but from a mix of genres, we also train genre-specific language models and show that including these as features improves readability predictions. Finally, we also show comparison between var-ious machine learning algorithms for predicting readability, none of the previous work compared learning algorithms.
3 Readability Data
from the following diverse sources or genres: newswire/newspaper text, weblogs, newsgroup posts, manual transcripts, machine translation out-put, closed-caption transcripts and Wikipedia arti-cles. Documents for newswire, machine transla-tion and closed captransla-tioned genres were collected automatically by first forming a candidate pool from a single collection stream and then randomly selecting documents. Documents for weblogs, newsgroups and manual transcripts were also col-lected in the same way but were then reviewed by humans to make sure they were not simply spam articles or something objectionable. The Wikipedia articles were collected manually, by searching through a data archive or the live web, using keyword and other search techniques. Note that the information about genres of the docu-ments is not available during testing and hence was not used when training our readability model. A total of540documents were collected in this way which were uniformly distributed across the seven genres. Each document was then judged for its readability by eight expert human judges. These expert judges are native English speakers who are language professionals and who have specialized training in linguistic analysis and an-notation, including the machine translation post-editing task. Each document was also judged for its readability by six to ten naive human judges. These non-expert (naive) judges are native En-glish speakers who are not language professionals (e.g. editors, writers, English teachers, linguistic annotators, etc.) and have no specialized language analysis or linguistic annotation training. Both ex-pert and naive judges provided readability judg-ments using a customized web interface and gave a rating on a5-point scale to indicate how readable the passage is (where1is lowest and5is highest readability) where readability is defined as a sub-jective judgment of how easily a reader can extract the information the writer or speaker intended to convey.
4 Readability Model
We want to answer the question whether a machine can accurately estimate readability as judged by a human. Therefore, we built a machine-learning system that predicts the
read-ability of documents by training on expert hu-man judgements of readability. The evaluation was then designed to compare how well machine and naive human judges predict expert human judgements. In order to make the machine’s pre-dicted score comparable to a human judge’s score (details about our evaluation metrics are in Sec-tion 6.1), we also restricted the machine scores to integers. Hence, the task is to predict an integer score from1to5that measures the readability of the document.
This task could be modeled as a multi-class classification problem treating each integer score as a separate class, as done in some of the previ-ous work (Si and Callan, 2001; Collins-Thompson and Callan, 2004). However, since the classes are numerical and not unrelated (for example, the score 2 is in between scores 1 and 3), we de-cided to model the task as a regression problem and then round the predicted score to obtain the closest integer value. Preliminary results verified that regression performed better than classifica-tion. Heilman et al. (2008) also found that it is better to treat the readability scores as ordinal than as nominal. We take the average of the ex-pert judge scores for each document as its gold-standard score. Regression was also used by Ka-nungo and Orr (2009), although their evaluation did not constrain machine scores to be integers.
We tested several regression algorithms avail-able in the Weka1machine learning package, and in Section 6.2 we report results for several which performed best. The next section describes the numerically-valued features that we used as input for regression.
5 Features for Predicting Readability
Good input features are critical to the success of any regression algorithm. We used three main cat-egories of features to predict readability: syntac-tic features, language-model features, and lexical features, as described below.
5.1 Features Based on Syntax
Many times, a document is found to be unreadable due to unusual linguistic constructs or
matical language that tend to manifest themselves in the syntactic properties of the text. There-fore, syntactic features have been previously used (Bernth, 1997) to gauge the “clarity” of written text, with the goal of helping writers improve their writing skills. Here too, we use several features based on syntactic analyses. Syntactic analyses are obtained from the Sundance shallow parser (Riloff and Phillips, 2004) and from the English Slot Grammar (ESG) (McCord, 1989).
Sundance features: The Sundance system is a
rule-based system that performs a shallow syntac-tic analysis of text. We expect that this analysis over readable text would be “well-formed”, adher-ing to grammatical rules of the English language. Deviations from these rules can be indications of unreadable text. We attempt to capture such de-viations from grammatical rules through the fol-lowing Sundance features computed for each text document: proportion of sentences with no verb phrases, average number of clauses per sentence, average sentence length in tokens, average num-ber of noun phrases per sentence, average numnum-ber of verb phrases per sentence, average number of prepositional phrases per sentence, average num-ber of phrases (all types) per sentence and average number of phrases (all types) per clause.
ESG features: ESG uses slot grammar rules to
perform a deeper linguistic analysis of sentences than the Sundance system. ESG may consider several different interpretations of a sentence, be-fore deciding to choose one over the other inter-pretations. Sometimes ESG’s grammar rules fail to produce a single complete interpretation of a sentence, in which case it generates partial parses. This typically happens in cases when sentences are ungrammatical, and possibly, less readable. Thus, we use the proportion of such incomplete parses within a document as a readability feature. In case of extremely short documents, this propor-tion of incomplete parses can be misleading. To account for such short documents, we introduce a variation of the above incomplete parse feature, by weighting it with a log factor as was done in (Riloff, 1996; Thelen and Riloff, 2002).
We also experimented with some other syn-tactic features such as average sentence parse scores from Stanford parser and an in-house
maxi-mum entropy statistical parer, average constituent scores etc., however, they slightly degraded the performance in combination with the rest of the features and hence we did not include them in the final set. One possible explanation could be that averaging diminishes the effect of low scores caused by ungrammaticality.
5.2 Features Based on Language Models
A probabilistic language model provides a predic-tion of how likely a given sentence was generated by the same underlying process that generated a corpus of training documents. In addition to a general n-gram language model trained on a large body of text, we also exploit language models trained to recognize specific “genres” of text. If a document is translated by a machine, or casually produced by humans for a weblog or newsgroup, it exhibits a character that is distinct from docu-ments that go through a dedicated editing process (e.g., newswire and Wikipedia articles). Below we describe features based on generic as well as genre-specific language models.
Normalized document probability: One
obvi-ous proxy for readability is the score assigned to a document by a generic language model (LM). Since the language model is trained on well-written English text, it penalizes documents de-viating from the statistics collected from the LM training documents. Due to variable document lengths, we normalize the document-level LM score by the number of words and compute the normalized document probability N P(D) for a documentDas follows:
N P(D) =¡P(D|M)¢|D|1 , (1)
where M is a general-purpose language model trained on clean English text, and|D|is the num-ber of words in the documentD.
we also build models that try to predict the genre of a document. Since the genre information for many English documents is readily available, we trained a series of genre-specific 5-gram LMs us-ing the modified Kneser-Ney smoothus-ing (Kneser and Ney, 1995; Stanley and Goodman, 1996). Ta-ble 1 contains a list of a base LM and genre-specific LMs.
Given a document D consisting of tokenized word sequence {wi : i = 1,2,· · ·,|D|}, its
per-plexity L(D|Mj) with respect to a LM Mj is computed as:
L(D|Mj) = e ¡
− 1 |D|
P|D|
i=1logP(wi|hi;Mj) ¢
, (2)
where|D|is the number of words inDandhi are
the history words forwi, andP(wi|hi;Mj)is the
probabilityMj assigns towi, when it follows the
history wordshi.
Posterior perplexities from genre-specific lan-guage models: While perplexities computed from
genre-specific LMs reflect the absolute probabil-ity that a document was generated by a specific model, a model’s relative probability compared to other models may be a more useful feature. To this end, we also compute the posterior perplexity de-fined as follows. LetDbe a document,{Mi}G
i=1 be G genre-specific LMs, and L(D|Mi) be the perplexity of the documentDwith respect toMi, then the posterior perplexity, R(Mi|D), is de-fined as:
R(Mi|D) = PGL(D|Mi)
j=1L(D|Mj)
. (3)
We use the term “posterior” because if a uni-form prior is adopted for{Mi}G
i=1,R(Mi|D)can be interpreted as the posterior probability of the genre LMMigiven the documentD.
5.3 Lexical Features
The final set of features involve various lexical statistics as described below.
Out-of-vocabulary (OOV) rates: We conjecture
that documents containing typographical errors (e.g., for closed-caption and web log documents) may receive low readability ratings. Therefore, we compute the OOV rates of a document with re-spect to the various LMs shown in Table 1. Since
modern LMs often have a very large vocabulary, to get meaningful OOV rates, we truncate the vo-cabularies to the top (i.e., most frequent) 3000 words. For the purpose of OOV computation, a documentDis treated as a sequence of tokenized words {wi : i = 1,2,· · · ,|D|}. Its OOV rate
with respect to a (truncated) vocabularyV is then:
OOV(D|V) = PD
i=1I(wi ∈ V/ )
|D| , (4)
whereI(wi ∈ V/ ) is an indicator function taking
value1ifwiis not inV, and 0 otherwise.
Ratio of function words: A characteristic of
doc-uments generated by foreign speakers and ma-chine translation is a failure to produce certain function words, such as “the,” or “of.” So we pre-define a small set of function words (mainly En-glish articles and frequent prepositions) and com-pute the ratio of function words over the total number words in a document:
RF(D) = PD
i=1I(wi ∈ F)
|D| , (5)
whereI(wi∈ F)is 1 ifwiis in the set of function
wordsF, and 0 otherwise.
Ratio of pronouns: Many foreign languages that
are source languages of machine-translated docu-ments are pronoun-drop languages, such as Ara-bic, Chinese, and romance languages. We conjec-ture that the pronoun ratio may be a good indica-tor whether a document is translated by machine or produced by humans, and for each document, we first run a POS tagger, and then compute the ratio of pronouns over the number of words in the document:
RP(D) = PD
i=1I(P OS(wi)∈ P)
|D| , (6)
whereI(P OS(wi)∈ F)is 1 if the POS tag ofwi
is in the set of pronouns,P , and 0 otherwise.
Fraction of known words: This feature measures
the fraction of words in a document that occur either in an English dictionary or a gazetteer of names of people and locations.
6 Experiments
Genre Training Size(M tokens) Data Sources
base 5136.8 mostly LDC’s GigaWord set
NW 143.2 newswire subset of base
NG 218.6 newsgroup subset of base
WL 18.5 weblog subset of base
BC 1.6 broadcast conversation subset of base BN 1.1 broadcast news subset of base wikipedia 2264.6 Wikipedia text
CC 0.1 closed caption
ZhEn 79.6 output of Chinese to English Machine Translation ArEn 126.8 output of Arabic to English Machine Translation
Table 1:Genre-specific LMs: the second column contains the number of tokens in LM training data (in million tokens).
experimental results. The results of the official evaluation task are also reported.
6.1 Evaluation Metric
The evaluation process for the DARPA MRP read-ability test was designed by the evaluation team led by SAIC. In order to compare a machine’s predicted readability score to those assigned by the expert judges, the Pearson correlation coef-ficient was computed. The mean of the expert-judge scores was taken as the gold-standard score for a document.
To determine whether the machine predicts scores closer to the expert judges’ scores than what an average naive judge would predict, a sampling distribution representing the underlying novice performance was computed. This was ob-tained by choosing a random naive judge for every document, calculating the Pearson correlation co-efficient with the expert gold-standard scores and then repeating this procedure a sufficient number of times (5000). The upper critical value was set at97.5%confidence, meaning that if the machine performs better than the upper critical value then we reject the null hypothesis that machine scores and naive scores come from the same distribution and conclude that the machine performs signifi-cantly better than naive judges in matching the ex-pert judges.
6.2 Results and Discussion
We evaluated our readability system on the dataset of390documents which was released earlier dur-ing the traindur-ing phase of the evaluation task. We
Algorithm Correlation Bagged Decision Trees 0.8173
Decision Trees 0.7260 Linear Regression 0.7984 SVM Regression 0.7915 Gaussian Process Regression 0.7562
Naive Judges
Upper Critical Value 0.7015 Distribution Mean 0.6517
Baselines
Uniform Random 0.0157 Proportional Random -0.0834
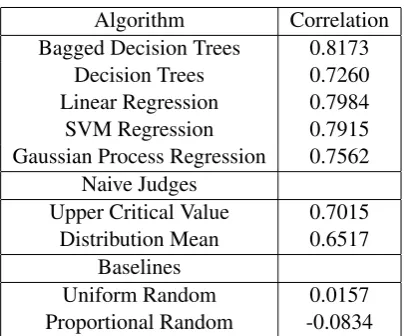
Table 2: Comparing different algorithms on the readability task using13-fold cross-validation on the390documents us-ing all the features. Exceedus-ing the upper critical value of the naive judges’ distribution indicates statistically significantly better predictions than the naive judges.
used stratified 13-fold cross-validation in which the documents from various genres in each fold was distributed in roughly the same proportion as in the overall dataset. We first conducted experi-ments to test different regression algorithms using all the available features. Next, we ablated various feature sets to determine how much each feature set was contributing to making accurate readabil-ity judgements. These experiments are described in the following subsections.
6.2.1 Regression Algorithms
Feature Set Correlation
Lexical 0.5760
Syntactic 0.7010 Lexical + Syntactic 0.7274 Language Model based 0.7864
All 0.8173
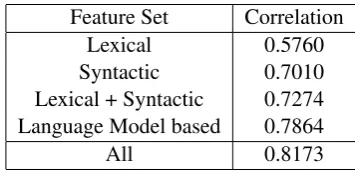
Table 3:Comparison of different linguistic feature sets.
in Weka were used for all parameters, changing these values did not show any improvement. We used decision tree (reduced error pruning (Quin-lan, 1987)) regression, decision tree regression with bagging (Breiman, 1996), support vector re-gression (Smola and Scholkopf, 1998) using poly-nomial kernel of degree two,2 linear regression and Gaussian process regression (Rasmussen and Williams, 2006). The distribution mean and the upper critical values of the correlation coefficient distribution for the naive judges are also shown in the table.
Since they are above the upper critical value, all algorithms predicted expert readability scores sig-nificantly more accurately than the naive judges. Bagged decision trees performed slightly better than other methods. As shown in the following section, ablating features affects predictive accu-racy much more than changing the regression al-gorithm. Therefore, on this task, the choice of re-gression algorithm was not very critical once good readability features are used. We also tested two simple baseline strategies: predicting a score uni-formly at random, and predicting a score propor-tional to its frequency in the training data. As shown in the last two rows of Table 2, these base-lines perform very poorly, verifying that predict-ing readability on this dataset as evaluated by our evaluation metric is not trivial.
6.2.2 Ablations with Feature Sets
We evaluated the contributions of different fea-ture sets through ablation experiments. Bagged decision-tree was used as the regression algorithm in all of these experiments. First we compared syntactic, lexical and language-model based fea-tures as described in Section 5, and Table 3 shows
2Polynomial kernels with other degrees and RBF kernel
performed worse.
the results. The language-model feature set per-forms the best, but performance improves when it is combined with the remaining features. The lex-ical feature set by itself performs the worst, even below the naive distribution mean (shown in Ta-ble 2); however, when combined with syntactic features it performs well.
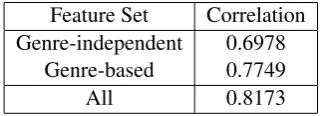
In our second ablation experiment, we com-pared the performance of genre-independent and genre-based features. Since the genre-based fea-tures exploit knowledge of the genres of text used in the MRP readability corpus, their utility is somewhat tailored to this specific corpus. There-fore, it is useful to evaluate the performance of the system when genre information is not exploited. Of the lexical features described in subsection 5.3, the ratio of function words, ratio of pronoun words and all of the out-of-vocabulary rates except for the base language model are genre-based features. Out of the language model features described in the Subsection 5.2, all of the perplexities except for the base language model and all of the poste-rior perplexities3are genre-based features. All of the remaining features are genre-independent. Ta-ble 4 shows the results comparing these two fea-ture sets. The genre-based feafea-tures do well by themselves but the rest of the features help fur-ther improve the performance. While the genre-independent features by themselves do not exceed the upper critical value of the naive judges’ dis-tribution, they are very close to it and still out-perform its mean value. These results show that for a dataset like ours, which is composed of a mix of genres that themselves are indicative of read-ability, features that help identify the genre of a text improve performance significantly.4 For ap-plications mentioned in the introduction and re-lated work sections, such as filtering less readable documents from web-search, many of the input documents could come from some of the common genres considered in our dataset.
In our final ablation experiment, we evaluated
3Base model for posterior perplexities is computed using
other genre-based LMs (equation 3) hence it can not be con-sidered genre-independent.
4We note that none of the genre-based features were
Feature Set Correlation Genre-independent 0.6978
Genre-based 0.7749
All 0.8173
Table 4: Comparison of independent and genre-based feature sets.
Feature Set By itself Ablated from All Sundance features 0.5417 0.7993
ESG features 0.5841 0.8118 Perplexities 0.7092 0.8081 Posterior perplexities 0.7832 0.7439 Out-of-vocabulary rates 0.3574 0.8125
All 0.8173
-Table 5:Ablations with some individual feature sets.
the contribution of various individual feature sets. Table 5 shows that posterior perplexities perform the strongest on their own, but without them, the remaining features also do well. When used by themselves, some feature sets perform below the naive judges’ distribution mean, however, remov-ing them from the rest of the feature sets de-grades the performance. This shows that no indi-vidual feature set is critical for good performance but each further improves the performance when added to the rest of the feature sets.
6.3 Official Evaluation Results
An official evaluation was conducted by the eval-uation team SAIC on behalf of DARPA in which three teams participated including ours. The eval-uation task required predicting the readability of 150test documents using the 390training docu-ments. Besides the correlation metric, two addi-tional metrics were used. One of them computed for a document the difference between the aver-age absolute difference of the naive judge scores from the mean expert score and the absolute dif-ference of the machine’s score from the mean ex-pert score. This was then averaged over all the documents. The other one was “target hits” which measured if the predicted score for a document fell within the width of the lowest and the highest expert scores for that document, and if so,
com-System Correl. Avg. Diff. Target Hits Our (A) 0.8127 0.4844 0.4619 System B 0.6904 0.3916 0.4530 System C 0.8501 0.5177 0.4641 Upper CV 0.7423 0.0960 0.3713
Table 6: Results of the systems that participated in the DARPA’s readability evaluation task. The three metrics used were correlation, average absolute difference and target hits measured against the expert readability scores. The upper critical values are for the score distributions of naive judges.
puted a score inversely proportional to that width. The final target hits score was then computed by averaging it across all the documents. The upper critical values for these metrics were computed in a way analogous to that for the correlation met-ric which was described before. Higher score is better for all the three metrics. Table 6 shows the results of the evaluation. Our system performed favorably and always scored better than the up-per critical value on each of the metrics. Its up- per-formance was in between the perper-formance of the other two systems. The performances of the sys-tems show that the correlation metric was the most difficult of the three metrics.
7 Conclusions
Using regression over a diverse combination of syntactic, lexical and language-model based fea-tures, we built a system for predicting the read-ability of natural-language documents. The sys-tem accurately predicts readability as judged by linguistically-trained expert human judges and exceeds the accuracy of naive human judges. Language-model based features were found to be most useful for this task, but syntactic and lexical features were also helpful. We also found that for a corpus consisting of documents from a diverse mix of genres, using features that are indicative of the genre significantly improve the accuracy of readability predictions. Such a system could be used to filter out less readable documents for ma-chine or human processing.
Acknowledgment
References
Bernth, Arendse. 1997. Easyenglish: A tool for improv-ing document quality. In Proceedimprov-ings of the fifth
con-ference on Applied Natural Language Processing, pages 159–165, Washington DC, April.
Breiman, Leo. 1996. Bagging predictors. Machine
Learn-ing, 24(2):123–140.
Chall, J.S. and E. Dale. 1995. Readability Revisited: The
New Dale-Chall Readability Formula. Brookline Books, Cambridge, MA.
Collins-Thompson, Kevyn and James P. Callan. 2004. A language modeling approach to predicting reading diffi-culty. In Proc. of HLT-NAACL 2004, pages 193–200.
Fry, E. 1990. A readability formula for short passages.
Jour-nal of Reading, 33(8):594–597.
Gunning, R. 1952. The Technique of Clear Writing.
McGraw-Hill, Cambridge, MA.
Heilman, Michael, Kevyn Collins-Thompson, Jamie Callan,
and Maxine Eskenazi. 2007. Combining lexical and
grammatical features to improve readability measures for first and second language texts. In Proc. of NAACL-HLT
2007, pages 460–467, Rochester, New York, April.
Heilman, Michael, Kevyn Collins-Thompson, and Maxine Eskenazi. 2008. An analysis of statistical models and fea-tures for reading difficulty prediction. In Proceedings of
the Third Workshop on Innovative Use of NLP for Build-ing Educational Applications, pages 71–79, Columbus, Ohio, June. Association for Computational Linguistics.
Kanungo, Tapas and David Orr. 2009. Predicting the read-ability of short web summaries. In Proc. of WSDM 2009, pages 202–211, Barcelona, Spain, February.
Kincaid, J. P., R. P. Fishburne, R. L. Rogers, and B.S. Chissom. 1975. Derivation of new readability formulas for navy enlisted personnel. Technical Report Research Branch Report 8-75, Millington, TN: Naval Air Station.
Kneser, Reinhard and Hermann Ney. 1995. Improved
backing-off for m-gram language modeling. In Proc. of
ICASSP-95, pages 181–184.
McCallum, Andrew and Kamal Nigam. 1998. A comparison of event models for naive Bayes text classification. In
Pa-pers from the AAAI-98 Workshop on Text Categorization, pages 41–48, Madison, WI, July.
McCord, Michael C. 1989. Slot grammar: A system for simpler construction of practical natural language gram-mars. In Proceedings of the International Symposium on
Natural Language and Logic, pages 118–145, May.
McLaughlin, G. H. 1969. Smog: Grading: A new readabil-ity formula. Journal of Reading, 12:639–646.
Pitler, Emily and Ani Nenkova. 2008. Revisiting
readability: A unified framework for predicting text
quality. In Proc. of EMNLP 2008, pages 186–195,
Waikiki,Honolulu,Hawaii, October.
Quinlan, J. R. 1987. Simplifying decision trees.
Interna-tional Journal of Man-Machine Studies, 27:221–234.
Rasmussen, Carl and Christopher Williams. 2006. Gaussian
Processes for Machine Leanring. MIT Press, Cambridge, MA.
Riloff, E. and W. Phillips. 2004. An introduction to the Sun-dance and Autoslog systems. Technical Report UUCS-04-015, University of Utah School of Computing.
Riloff, Ellen. 1996. Automatically generating extraction patterns from untagged text. In Proc. of 13th Natl. Conf.
on Artificial Intelligence (AAAI-96), pages 1044–1049, Portland, OR.
Schwarm, Sarah E. and Mari Ostendorf. 2005. Reading level assessment using support vector machines and statistical language models. In Proc. of ACL 2005, pages 523–530, Ann Arbor, Michigan.
Si, Luo and James P. Callan. 2001. A statistical model for scientific readability. In Proc. of CIKM 2001, pages 574– 576.
Smola, Alex J. and Bernhard Scholkopf. 1998. A tutorial on support vector regression. Technical Report NC2-TR-1998-030, NeuroCOLT2.
Stanley, Chen and Joshua Goodman. 1996. An empirical study of smoothing techniques for language modeling. In
Proc. of the 34th Annual Meeting of the Association for Computational Linguistics (ACL-96), pages 310–318.
Stenner, A. J., I. Horabin, D. R. Smith, and M. Smith. 1988.
The Lexile Framework. Durham, NC: MetaMetrics.
Thelen, M. and E. Riloff. 2002. A bootstrapping method for learning semantic lexicons using extraction pattern con-texts. In Proc. of EMNLP 2002, Philadelphia, PA, July.
Yang, Yiming and Xin Liu. 1999. A re-examination of text cateogrization methods. In Proc. of 22nd Intl. ACM