EXAMPLES OF CATEGORIZATION OF SEISMIC LOADS
FOR CIVIL ENGINEERING AND MECHANICAL ENGINEERING
Pierre B. Labbé1,
1
EDF Nuclear Engineering Division, 1, place Pleyel, 93282, Saint-Denis, France ([email protected])
ABSTRACT
Both civil and mechanical engineers come across loads of the force-controlled type (qualified as “primary”) or of the displacement-controlled type (qualified as “secondary”). For decades, different authors have been debating whether a seismic load should be classified as primary or secondary. The purpose of this paper is to bring some clarity to the subject by considering oscillators that are characterized by their ductile capacity, µu, and the corresponding “effective stiffness factor”, τu. It is concluded that a seismic input cannot be a priori regarded as primary or secondary. Both τu, and the slope, p, of the input spectrum in the vicinity of the (dominant) natural frequency of the structure or component should be considered concurrently when making a decision about stress categorization. It appears that τu, is depending on µu, and differs from concrete structures to piping components and piping systems. Conclusions are drawn accordingly on seismic load categorization.
INTRODUCTION
At the SMIRT 21 conference, an approach for categorization of seismically-induced stresses or seismic loads was presented, relevant to both civil and mechanical engineering (Labbé 2011). For this purpose the terminology “categorization” refers to the categorization of loads as being of the type either “force-controlled” or “displacement-controlled” (respectively “primary” and “secondary” in mechanical engineering terminology).
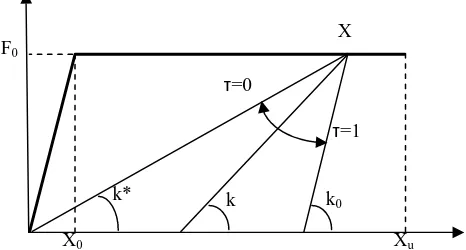
Figure 1. Constitutive relationship, range of τ values
The approach is based on the analysis of the seismic response of a single degree of freedom system with a conventional constitutive relationship such as presented in Figure 1. When excited by a seismic input motion, the dynamic response (relative displacement) is x(t) and its maximum absolute value is denoted X.
-In case X does not exceed X0 the oscillator is in elastic regime, with an f0 frequency, and a ξ0 reduced damping value.
F0
X0 Xu
k* k k0
X
τ=0
-In case X is larger than X0, without exceeding Xu, the oscillator is in plastic regime. The ductile demand is µ=X/X0 (1≤µ≤µu), µu=Xu/X0 being the ductile capacity. It is assumed that an effective frequency f≤f0, and an effective viscous damping ξ≥ξ0 , can be determined.
-In case X is larger than Xu, the oscillator is deemed collapsed.
Figure 2. Significance of p
It was concluded that the seismic load categorization is principally driven by two parameters: -The effective stiffness of the structure in the plastic domain, quantified by a parameter τ (which ranges from 0 to 1) such as presented in Figure 1. τ is so that the effective stiffness, k, reads:
k = (1-τ) k* + τ k0 ; with 0 ≤ τ ≤ 1. (1)
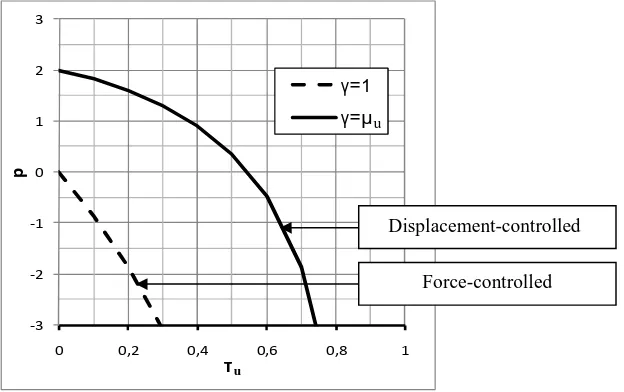
- The slope, p, of the log-log input spectrum in the vicinity of the dominant natural frequency of the structure, such as presented in Figure 2.
-3 -2 -1 0 1 2 3
0 0,2 0,4 0,6 0,8 1
p
ττττu
γ=1 γ=µ
Figure 3. γ versus τu and p, for µu=8
Displacement-controlled
u
For a given ductile capacity, µu, the categorization is quantified by a factor γ, such that γ=1 in case of a force-controlled load and γ=µu in case of a displacement-controlled load. The analysis output was presented in the form of an abacus (Figure 3). Figure 3 is plotted for µu=8. Similar figures plotted for µu=5, 10 and 15 by Labbé (2011) give evidence that the output is not very sensitive to the µu value.
The pending issue in 2011 was to decide the τu value to be adopted in practice so as to derive the stress categorization from the abacus. This issue is addressed in the present paper for reinforced concrete frames and for piping systems on the basis of data available in literature.
FLEXIBLE VERSUS STIFF STRUCTURES AND COMPONENTS
As discussed for instance in the IAEA Safety Report 28 (2003), when addressing the response of a structure or a component to a dynamic input, concepts of stiffness or flexibility become quite relative. Actually, the first (or dominant) eigenfrequency should be compared to the central frequency of the input motion. In cases where the eigenfrequency is lower than the input central frequency, the structure or component should be regarded as flexible, and regarded as stiff in the opposite case. Concurrently it has already been pointed out that a seismic load tends to act as a secondary load on flexible structures or components, while it tends to act as a primary load on stiff systems (IAEA 2003). In particular the seismic input motion should be regarded as a primary load for structures with a dominant natural frequency larger than the cut-off frequency of the input response spectrum. (A consequence is that seismic loads should be regarded as primary for components inside a structure built on a seismic isolation system.)
This well known result seems better quantified by the approach presented by Labbé (2001): A flexible structure or component is so that the slope of the response spectrum in the vicinity of its eigenfrequency is positive (p>0), while it is negative (p<0) in the opposite case. In addition to this qualitative categorization, the proposed approach enables to quantify differences between for instance p=1 and p=2.
Regarding flexible structures, their response is governed by the ascendant part of the input spectrum. For very low frequencies, the slope of the spectrum cannot be less than p=2, otherwise the input displacement would not be physically limited (this is a drawback of some regulatory spectra in the low frequency range). Consequently, the seismic input is a secondary load for such flexible structures. Theoretically, every flexible structure can potentially go towards this part of the spectrum, to the extent that a large ductile capacity is available. This underlines the necessity of ductile capacity as a major feature for security under seismic load: for flexible structures the available margin directly equals the ductility.
Regarding stiff structures, their response is governed by the slope of the decreasing part of the input spectrum; between the peak and the ZPA (the “peak” forms more of a plateau when considering most regulatory spectra). In cases where this slope is abrupt (e.g. p=-3), a τ value of the order of 0.3 or larger should be available in order to prevent the severity of the seismic load to be even larger than that of a primary load, while a τ value of the order of 0.8 or larger allows to regard it as secondary.
CONCRETE STRUCTURES
Interpretation of above results should be considered with care when dealing with concrete structures: in such cases, the path from the elastic response to the plateau is more complicated than that presented in Figure 1 due to the cracking effect having a significant impact on structural effective stiffness. This phenomenon appears early before yielding of R-bars, which in first approximation can be regarded as the starting point of the plateau. Consequently, the natural frequency of the virgin structure (before cracking) should not be regarded as its f0 value. More reasonably, this f0 value corresponds to the first R-bar yielding. This point of view is shared by Shibata & Sozen (1976), who regard the cracked stiffness as the appropriate k0 value.
In the nineties, a series of shear walls were tested using the pseudo-dynamic technique under seismic input motion, in the frame of the research program SAFE conducted by the European Joint Research Centre at Ispra (Mazars 1998, Pégon 1999). Brun & al. (2003) calibrated a shear wall model against these experimental results, and considered its response under two types of input motions. The first type, presented by the authors as representative of a near-field input, has a high frequency content; the second one, presented as representative of a far-field input, has a low frequency content (the central frequency is around 8 Hz for the first input, around 2.5 Hz for the second, the wall natural frequency corresponding to the cracked stiffness being around 5 Hz). The authors carried out a series of analyses, multiplying accelerograms by scaling factors so as to derive the seismically-induced damage versus the PGA (the damage being measured by the top displacement). In this case study, both input motions result in the same damage, proportional to the PGA as long as the PGA does not exceed 0.05 g, with the corresponding top displacement being then of 0.05 cm. Interestingly, the damage at a high frequency input remains proportional to the PGA, even in the post-elastic regime: a 0.3 g PGA results in a 0.3 cm top displacement. On the contrary, for the low frequency input, a dramatic and abrupt increase of damage appears in the post-elastic regime: a 0.07 g PGA results in a 0.5 cm top displacement. In the light of the analysis presented in the present paper, and although the authors do not quote the nuclear engineering terminology, it is clear that the study carried out by Brun & al. (2003) substantiates the fact that a high frequency seismic input motion acts as a displacement-controlled load while a low frequency input acts as a force-controlled load.
Numerous authors dealt with the characterization of effective eigenfrequency (or eigenperiod) and effective damping of concrete structures. Some recent papers on the subject were presented by Iwan and Guyader (2001), Miranda & Ruiz-Garcia (2002), Dwairi & Kowalski (2004), Levy & al. (2006). As soon as 1980, Iwan presented an evaluation of effective eigenperiod and effective damping as functions of µ, in the form of the following formulae, which are also available in Iwan & Guyader (2001):
T/T0 = 1+0.121(µ-1)0.939, where T=1/f and T0=1/f0, (2)
ξ=ξ0+0.0587(µ-1)0.371. (3)
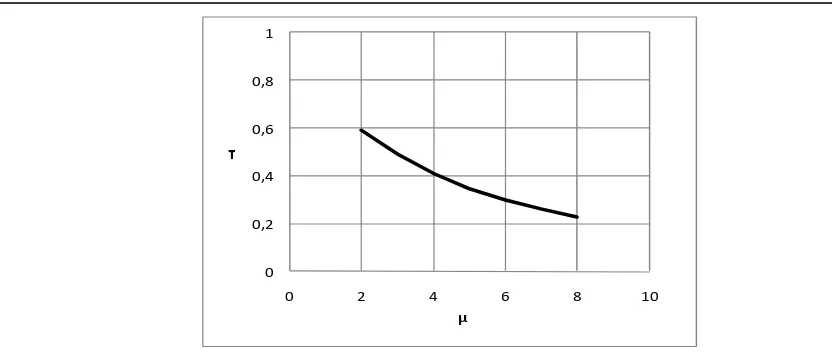
The above Equation 2 enables to derive k/k0 versus µ. Then the Equation 1 is used to derive τ from k/k0, taking also into account that k*/k0 = 1/µ. The output is presented in Figure 4 where τ is plotted versus µ (without exceeding µ=8, which is the largest µ value considered by Iwan). Development of calculations is as follows:
k/k0 = (f/f0)² = 1/(T/T0)² (4)
0 0,2 0,4 0,6 0,8 1
0 2 4 6 8 10
ττττ
µ
Figure 4. τ versus µ on the basis of Iwan’s formula for reinforced concrete frames
The above Equation 3 provides the effective damping versus µ. The sensitivity to effective damping of the stress categorization such as presented in Figure 2 is discussed by Labbé (2013), leading to the conclusion that this sensitivity is not significant.
An interesting conclusion drawn from Figure 4 is that, although a large µu value is preferable, for instance µu=8 is better than µu=4, the benefit of this large µu value is reduced to a certain extent by the fact that the τu value associated to µu=8 is lower than associated to µu=4. This is due to the fact that the higher the ductile demand, the higher also the stiffness reduction of the structure.
On a practical viewpoint and as a matter of example, let us consider a concrete frame structure with a ductile capacity µu=8. Then the corresponding τu value is approximately τu=0,23. Referring to Figure 2 (intentionally plotted for µu=8), it should be concluded that, for this type of structure, the seismic load is generally less damaging than what estimated if regarded as a primary load. It is only in case of a very stiff spectrum slope, lower than -3, that it might become more damaging. For a slope equal or larger than 1.5 the seismic load should be regarded as secondary (or in other words regarded as a displacement controlled load). For intermediate slopes, the primary part of the seismic load should be estimated. A methodology for calculating this primary part is presented by Labbé (2013).
PIPING SYSTEMS
Extensive experimental research programs were carried out in the USA in the nineties under the leadership of the Electric Power Research Institute (EPRI 1994) and in Japan during the first decade of this century under the leadership of the Nuclear Power Engineering Corporation (NUPEC), now the Japanese Nuclear Energy Safety Organisation (JNES) (Suzuki & al. 2002). Both programs incorporated tests of components and of piping systems and concluded that the nuclear industry’s design practice for piping systems incorporates large margins. Regarding available documentation and outputs of interest for the present research, the main interest of the EPRI program is in its component tests while the main interest of the NUPEC/JNES program is in its large scale piping systems tests.
EPRI Component Tests
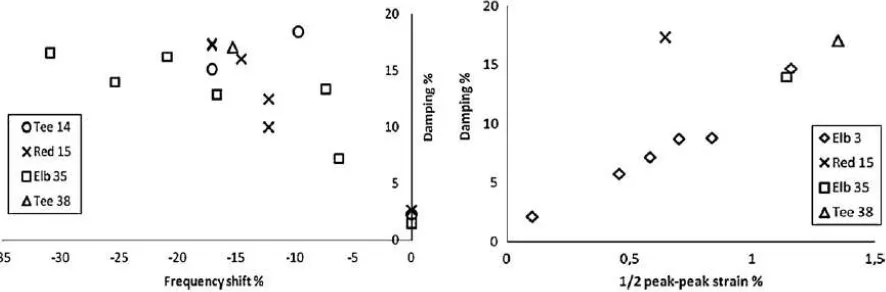
interestingly, experimental outputs of some specimen were processed so as to identify their effective frequency and effective damping (EPRI 1994). These documented outputs are summarized in Figure 5.
Figure 5. Experimental data on piping components (EPRI 1994)
We processed these EPRI experimental data as follows:
-Right part of Figure 5: Considering that the plastic yield is classically corresponding to a 0.2% strain, recorded strain values were converted into µ values. An empirical linear relationship was established between µ and ξ.
-Left part of Figure 5: First the frequency shifts were converted into k/k0 values by k/k0 = (f/f0)², and an empirical relationship was established between k/k0 and ξ by interpolating the experimental data presented in the figure. Then the empirical formula was expressed in terms of k/k0 versus µ.
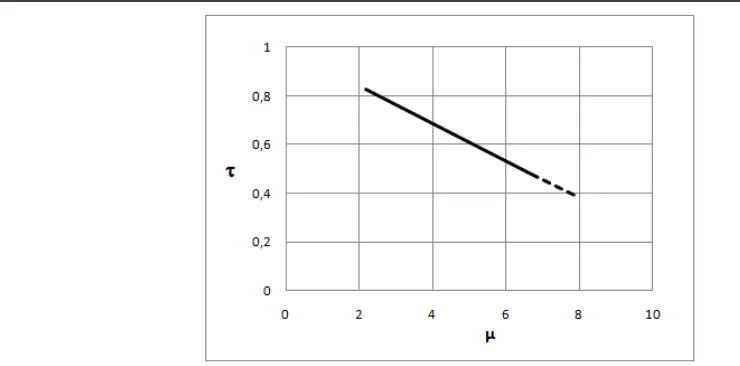
Eventually τ was calculated with the same Equation 5, already used for the concrete frame. The output is presented in Figure 6. (The solid line is corresponding to the range of µ values covered by the EPRI experimental data; the dotted line is an extrapolation until µ=8 so as to cover the same range of µ values as above). The trend is the same as for the concrete frame: τ is a decreasing function of µ. However for a given µ value, τ is larger than what was observed for the above discussed concrete structure. It comes from the fact that a concrete structure is more sensitive than a steel structure to damaging effect of cyclic loads, and that consequently its effective stiffness is more depredated.
The experimental data presented in Figure 5 provide also interesting pieces of information on the effective damping corresponding to a given ductile demand. This point was discussed by Labbé (2013), leading, as already mentioned, to the conclusion that the stress categorization is not significantly sensitive to the effective damping value.
On a practical viewpoint, let us consider again a piping component with a ductile capacity µu=8. Then the corresponding τu value is approximately τu =0.4. Referring to Figure 2, it should be concluded that the seismic load is less damaging than what estimated if regarded as a primary load (except for incredibly stiff slopes). It should be regarded as secondary (or in other words regarded as a displacement controlled load) as soon as the spectrum slope is larger than 1.
Figure 6. τ versus µ for piping components on the basis of EPRI experimental data.
NUPEC/JNES Piping System Tests
Outputs of the NUPEC/JNES research program were processed and presented by DeGrassi & al. (2008). The large scale piping system under consideration consisted of a 200 mm (8 inch) nominal diameter schedule 40 carbon steel pipe. The piping system included straight pipe, nine elbows, a tee, and a 1000 kg added mass representing a valve. It was internally pressurized to a design stress intensity of Sm. According to the Japanese Code, primary stress is limited to 3Sm. Two series of tests were performed, using the large high performance shaking table at the Tadotsu Engineering Laboratory: The first was a Design Method confirmation (DM) test and the second was an Ultimate Strength (US) test.
In the DM test, the piping system had a first natural frequency of 6.3 Hz with a damping of 2.1%. A series of seismic input motions were applied so that the corresponding primary stresses were respectively calculated at 4.5 Sm, 6 Sm, 10.5 Sm, and 13.5 Sm. Processing outputs of this last run resulted in a 5.9 Hz effective frequency and a 3.4% effective damping.
For the US test, the piping system was modified by the addition of another 1000 kg mass and the removal of a lateral support. The natural frequency dropped to 3.8 Hz and the damping to 0.9%. The seismic input motion was calibrated so that the corresponding primary stress was calculated at 24 Sm. Under these conditions the observed effective frequency was estimated at 3.6 Hz and the damping at 4.5%. (The test was repeated until failure, which occurred during the fifth run in a fatigue-ratcheting mode).
Unfortunately strain outputs are not documented by DeGrassi & al. (2008), meaning that the ductile demand is unknown and proper interpretation of these Japanese results according to the approach presented in this paper is impossible. However, it is interesting to note that in spite of the very large µ values obtained during these tests, the frequency shift is very limited. This is likely due to the fact that the plastic yielding is limited to elbows, the vast majority of the system remaining in elastic regime. A consequence of the very small frequency shift is that the τ value of this system is close to 1.
CONCLUSION
A seismic load or a seismically-induced stress can be of any type from force-controlled (or primary) to displacement-controlled (or secondary). It can even be more severe than a conventional primary load or less severe than a conventional secondary load. Features of the seismic input motion and features of the structure or component under consideration should be concurrently taken into account when making a decision on categorization of seismic loads or seismically-induced stresses. According to Labbé (2011) the seismic load categorization is mainly controlled by:
- The slope, p, of the input spectrum in the lower frequency vicinity of the dominant natural frequency of the structure or component under consideration, and
- The structural stiffness degradation measured by the effective stiffness factor, τ, and more precisely its ultimate value τu.
In this paper we have discussed the τu value that should be adopted for three types of structures, systems and components (Reinforced concrete frames, Piping components and Piping systems). It appears that τu is strongly dependant on the ductile capacity µu. of the object under consideration and also, for a given ductile capacity differs from a type of object to another.
For instance, if we assume a ductile capacity µu.=8, the associated τu. value is around 0.2 for reinforced concrete frames and around 0.4 for piping components. It results that the seismic load can be regarded as secondary as soon as the spectrum slope is larger than 1.5 for reinforced concrete frames and larger than 1 for piping components. Conversely it should be regarded as primary as soon as the spectrum slope is respectively lower than -2 and -4 (the latest by extrapolation in Figure 3).
Unfortunately experimental outputs of piping system tests, such as known by the author, are not sufficiently documented to derive τu. values. However there are clues that this value is very high, around 0.9, leading to the conclusion that for such piping systems, the seismic load should be regarded as secondary for practically any type of response spectrum.
Mechanical engineers are very familiar with the concept of primary and secondary stresses. However, as oppose to civil engineers, they are reluctant to consider the primary part of a seismically-induced stress, likely because they have doubt about how to calculate it. As it provides a rational way for such a calculation, we hope that the procedure presented in this paper will facilitate establishing a practice consistent with the physical phenomena that control the seismic response of piping systems.
More research needs to be carried out on the subject of seismic load/stress categorization. An approach including some hardening capacity of the considered family of oscillator would be useful and would enable better comparisons to results already available in the literature for concrete structures and better interpretation of some experiments carried out on stainless steel mechanical components. Regarding piping systems, in addition to considerations about their response to strong input motions in plastic regime addressed in this paper, experimental research on the subject highlighted the fact that the actual failure mode is fatigue-ratcheting and that a criterion dedicated to this failure mode is still to be established.
REFERENCES
Brun, M., Reynouard, J.M., Jézéquel, L., 2003. A simple shear wall model taking into account stiffness degradation. Engineering Structures, vol. 25 pp. 1-9.
Brun M., Labbé P., Bertrand D., Courtois A., 2011. Pseudo-dynamic tests on low-rise shear walls and simplified model based on the structural frequency drift. Engineering Structures, vol. 33 pp. 796-812.
Dwairi H., Kowalski M., 2004. Investigation of Jacobsen’s equivalent viscous damping approach as applied to displacement-based seismic design. 13th World Conf. on Earthquake Eng., Vancouver, B.C., Canada.
EPRI, 1994. Piping and fitting dynamic reliability program. EPRI TR-102792, Palo-Alto, CA.
Fajfar P., 1992. Equivalent ductility factor taking into account low-cycle fatigue. Earthquake Engineering and Structural Dynamics, 21: 837-848.
Gülkan P., Sozen M., 1974. Inelastic response of reinforced concrete structures to earthquake motions. ACI Journal 71:604-610.
International Atomic Energy Agency, 2003. Seismic evaluation of existing nuclear power plants. Safety Reports series N° 28, IAEA, Vienna.
Iwan W.D., 1980. Estimating Inelastic Response Spectra from Elastic Spectra. Earthquake Engineering and Structural Dynamics, 8: 375-388.
Iwan W.D. Guyader A.C., 2001. A study of the accuracy of the capacity spectrum method in engineering analysis. Third US-Japan Workshop on Performance-Based Earthquake Engineering Methodology for Reinforced Concrete Building Structures. Seattle, WA,
Labbé, P.B., 2011. Reconciliation of civil and mechanical engineering approaches of seismically induced stresses. SMiRT 21 Conference, New Delhi, India.
Labbé, P.B., 2013. Categorization of seismically induced stresses for civil and mechanical engineering. Nuclear Engineering and Design. 255 (2013) 240-247.
Mazars J., 1998. French advanced research on structural walls: An overview on recent seismic programs. In: Bisch Ph. & al., editors. 11th European Conference on Earthquacke Engineering. Balkema, Rotterdam, p. 21–41.
Miranda E., Ruiz-Garcia J., 2002. Evaluation of approximate methods to estimate maximum inelastic displacement demands. Earthquake Engineering and Structural Dynamics, 31:539-560.
Newmark N.M., Hall W.J., 1978. Development of Criteria for Seismic Review of Selected Nuclear Power Plants, NUREG/CR-0098, US-Nuclear Regulatory Commission, Washington DC.
Pégon P., 1999. Programme SAFE: présentation générale des essais. JRC technical note.
Shibata A. Sozen M., 1976. Substitute Structure Method for Seismic Design in R/C. Journal of the Structural Division, ASCE, 102(ST1): 1-18.