Design an Antenna for Weather Forecasting by
Using RTL-SDR and GNU Radio
1K.Dinakaran, 2S.Balavignesh Kumar, 3S.Balraj, 4P.Gokul, 5 A.Jenison
Department of ECE, Jay Shriram Group of Institutions, Tirupur, Tamilnadu, India.
ABSTRACT: Checking climate examples and translating satellite pictures is a standout amongst the most generally used uses of remote detecting. Satellites have been utilized in the course of recent decades to acquire a wide assortment of data about the world's surface. In disdain of that, enormous costs, poor determination of the pictures, and low accessibility of valuable data from them have dependably been among the top issues confronted by satellite aficionados. Fine gathering of these pictures and extraction of significant data is less demanding said than done. This paper plans to diminish the cost of imaging generously, and extraordinarily enhance accessibility of such pictures. By making utilization of locally accessible crude materials, an receiving wire was built and tried with great outcomes that could get fine APT signs from NOAA 15, 8, 19[1]. Using sync beats as reference, the sound signs were decoded into a picture in GNU Radio. Separating, cross relationship and clamour decrease was a portion of the means executed to frame the picture. This framework accordingly gives a complete answer for accepting satellite pictures with a Software Defined Radio, a fitting receiving wire and different application conditions for translating the sound signs into a clear picture. It requires less handling power along these lines making climate estimating very helpful for the normal man. It is consequently an ease and a homebrew explanation of a procedure that is generally viewed as very complex by space devotees.
KEYWORDS: Satellite Imaging, NOAA, Automatic Picture Temperature, Quadrifilar Helical Antenna.
I. INTRODUCTION
Satellite Image Acquisition is a standout amongst the most investigated areas in satellite correspondences since the begin of the space age. Satellite pictures give us an abundance of data as to developments, precipitation, surface temperatures what's more, air poisons among numerous others [2]. By and by, getting climate figures is restricted to getting to administrative sites that show satellite pictures including a significant huge lump of arrive. Access to limited climate pictures and their elucidation to decode the data covered up in them is in this manner the need of the hour. There is a far reaching confusion that for getting satellite pictures, firstly an approved permit is required and furthermore, gigantic explanatory dishes with specific RF collectors are essential. This is be that as it may, not the case [3]. With a basic Quadrifilar Helical Antenna [4], and a shoddy Software Defined Radio dongle, satellite pictures of very great determination can be gotten.
II. TECHNICALBACKGROUND
Climate satellites can be either polar circling (Polar Operational Environmental Satellites) or geostationary (Geostationary Operational Environmental Satellites) [5]. Customarily, geostationary satellites have been utilized
for imaging and remote detecting applications.
Abdelatif Hassini and Ahmed Hafid Belbachir have proposed framework for the gathering of High Resolution Picture Transmission (HRPT) from EUMETSAT and also Automatic Picture Transmission (APT)from NOAA.
Their usage utilized a collector and a product modified in C++ to track the satellites and disentangle HRPT signals. Notwithstanding, the paper concentrated more on the preparing and adjustment of GEO satellite pictures utilizing composed programming. The framework that we propose concentrates more on the genuine interpreting procedure of Adept signs and its equipment necessities.
III. PROPOSED SOLUTION
The framework means to give a minimal effort complete answer for getting Automatic Picture Transmission from NOAA satellites. The square level acknowledgment of the framework is as showed in figure 1. The SDR dongle, QFH radio wire and the PC used to prepare and decipher the information from SDR dongle frame the three primary squares of the framework. QFH is the RF front end of the framework; the flag from the receiving wire is bolstered to the SDR dongle which plays out the FM demodulation of the APT flag. Additionally handling required to get the satellite picture is finished by the PC. To have the capacity to interpret these transmissions, we initially need to comprehend the strategies
utilized for transmission. The APT flag is an information stream that contains a bordering succession of values speaking to gray scale pixels of each line. This information stream is delivered by plentifulness regulating a 2400
Hz subtransporter with the 8 most critical bits of the 10 bit advanced AVHRR information. Two of the six conceivable AVHRR otherworldly directs are multiplexed in an APT flag. This adequacy tweaked subcarrier is further recurrence balanced for transmission onto a 137 MHz RF transporter.
Figure 1 Framework Square Outline The depiction of this satellite imaging framework can be quickly clarified as:
1. Track NOAA-17, NOAA-18 and NOAA-19 utilizing Arbitron programming and discover the pass timings of any of the dynamic NOAA satellites.
2. Build a Quadrifilar Helicoidally
Antenna (QFH) to get pictures from the satellites.
3. Get and demodulate the sound flag transmitted by satellite with a Software Defined Radio (SDR) dongle and store it as wave sound documents for further preparing and translating into picture.
4. Translate the sound flag into a picture utilizing GNU Radio
5. Utilizing gray scale to temperature mapping bends [2], Delineate gray scale picture got in step 4 into comparable temperature values.
6. Dole out a shading map from blue to red relating to cool and hot temperature restrains individually.
IV. EXECUTION
The paper proposes a two-arrange execution of the earth station, which can be classified into equipment and programming models. Gathering of the flag is the essential capacity of equipment model took after by demodulation and interpreting to frame a picture which is performed by the product model.
A. Equipment Model Implementation
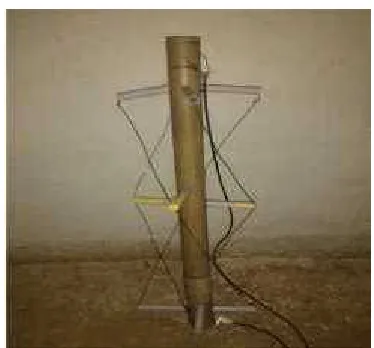
The QFH radio wire is a 1/2-turn, half wavelength gadget utilizing a self-staging of all shapes and sizes circle design as appeared in figure 2. Impedance coordinating is accomplished by an endless balun[8] game plan in which one of the four components is a length of co- pivotal link to create a trademark impedance of around 40 [9]. The receiving wire is developed from standard 20 mm PVC electrical course tubing for the support arms and a length of 32 mm PVC tube for the bolster pole. Each circle parts into two filars, which are upheld by PVC arms. Just a single filar is utilized as a co-hub conductor and those filars which don't require use as a co- pivotal link have the focus conductors patched to the interlace at both ends.[10] RG-6U copivotal link has been utilized for development, it gives low misfortunes at working recurrence and furthermore has a nonstop aluminum shield notwithstanding the interlace, this gives the link additional unbending nature which is helpful for forming the filars once the arms are fitted. The APT flag from the satellites are correct hand round spellbound (RHCP), therefore the filars must be twisted in an anticlockwise course when seeing the receiving wire from the top down its vertical pivot. The means taken while developing the receiving wire are: 1. The correct measurements of the inside and bolster channels are found by alluding to QFH plans [11]
2. The middle pipe is penetrated to embed littler even bolster channels which too were cut off in the inside for advantageous wiring and welding.
3. Beginning with one of the filars, the copper wire was strung through the top by means of backings guaranteeing a 90 degree turn. This was rehashed for the remaining wires to frame a total helix.
4. These wires were welded by the association outlines demonstrated as follows.
5. A BNC female connector with the cajole link utilized for interfacing with recipient gear.
After the radio wire was built it was mounted on the patio of the school working as appeared in figure3.
The outside unit of the framework comprises of the QFH receiving wire. It is associated to the SDR dongle in the indoor unit through a coaxial link. Around 30 feet of persuade link is utilized to associate the indoor unit to the receiving wire. Noteworthy link lessening misfortunes tend to appear as it were past 50 feet of link. Inferable from this reality and due to the radio wire's superb execution no preamplifier was required in the open air unit
Figure 3 Open air mounting of the radio wire
B. Programming Model Implementation The total indoor setup is shown in
figure 4. The SDR dongle is associated with the USB port of the PC. The coaxial link from the receiving wire at the highest point of the building is associated with the flip side of the SDR dongle. The dongle has a MCX female port, thus reasonable connectors changing over BNC to MCX must be utilized. In RF frameworks, the principle guilty party in charge of misfortune in flag quality is impedance befuddle. Thus, adequate care must be taken to guarantee that a wide range of links and connectors are of the same impedance so that regardless of the possibility that there are any misfortunes, one can strike out bungle reflections as one reason.
SD Sharp shapes the product front-end of the framework. It is used to control the parameters of the SDR dongle. As the name
recommends, SDR is programming characterized. To be exact, the radio parameters that are settled in common equipment radios, or other RF gear, those parameters can be altered helpfully in a programming characterized radio [12].
Recipient data transfer capacity, computerized sifting method, request of channel, demodulation plan of the got flag are some of the very valuable parameters that can be changed effortlessly. This capacity of programming characterized radio that permits adaptability makes it a great deal more appropriate for use in ease application particular usage.
Despite the fact that the benefits of SDR are various [13], there are the same numbers of downsides when contrasted and devoted super heterodyne recipients. The channel selectivity, recipient pick up, in band and in addition out of band obstruction dismissal, affectability what's more, element scope of customary devoted recipients is much superior to in programming characterized radios. Actually, a trade-off has to be made between the cost and the execution of the beneficiary. For satellite imaging utilizing LEO satellites, the middle recurrence of transmission shifts in the band from 136 to
138 MHz Thus of the recurrence not being settled, programming characterized radios are generally utilized for satellite imaging. The application frontend utilized here for shifting the parameters of SDR is SD Sharp. In a wide sense, the flag is FM demodulated first in the SDR, and the subsequent sound record is put away as a 8 bit or 16 bit wave record. Just FM demodulation does not give the picture straightforwardly as there is a further AM tweaked motion at 2.4 kHz that must be demodulated.
Sharp what's more, DDE following customer [14] , these being open source. Arbitron monitors the chose satellites by downloading the TwoLine Elements (TLE) and ephemeris information of the comparing satellites to decide and track their area. This area is refreshed each moment so that the client gets a clear gauge of how quick and where the satellite is moving at the present time. In any case, just a tracker won't be adequate on the grounds that we have to trigger an arrangement of orders each time a satellite is overhead. For this, a DDE following customer is utilized that structures a pipe between Arbitron and SD Sharp so orders can be traded among the two programming. The arrangement of summons prearranged in the customer for each satellite is as per the following:
On Acquisition of Signal (AOS) a) Start the radio
b) Set the middle recurrence of the comparing satellite
c) Set the balance plan to Wideband FM and the recipient data transfer capacity to 38 kHz d) Set the RF pick up of the dongle to an appropriate esteem.
e) Start the baseband recorder pre-set to recording 16 bit wave documents
On Loss of Signal (LOS) a) Stop the radio
b) Reset all parameter settings
c) Start following satellites for the following overhead pass These orders guaranteed that the
whole operation of the framework was completely mechanized with no need of human mediation. The recorded sound documents are altogether put something aside for further handling in GNU Radio where the flag is decoded into a picture.
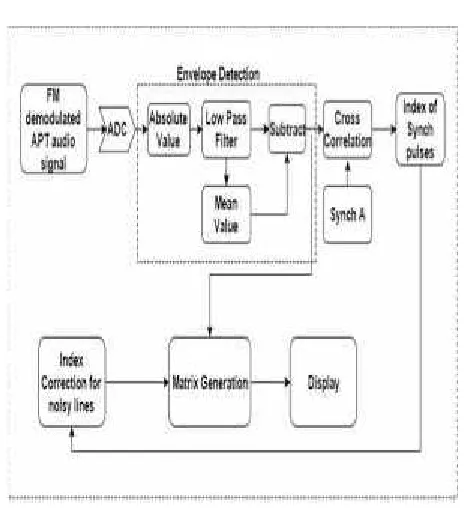
GNU Radio Decoding Process So as to get the picture from the
recorded document it was to handle the crude information. The framework for the whole disentangling procedure can be found in figure 5. Envelope location [15] was utilized to demodulate the AM tweaked flag. The envelope indicator begins by taking the outright estimation of the flag which acts like a rectifier. The amended flag is then gone through a low pass channel which is utilized to smooth the swells of the corrected flag.
Figure 4 Programming Decoding Flow
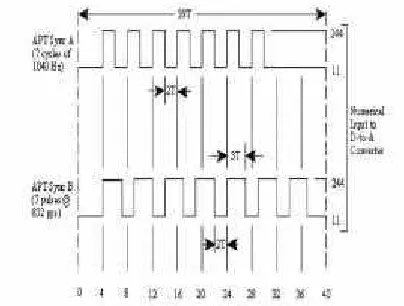
The mean of the low pass flag is then found and subtracted from the low pass flag to evacuate the DC segment of the low pass flag. The cut off recurrence of the low pass channel is an imperative parameter as the picture will seem to have swells crosswise over it on the off chance that it is set too high. To take out the swells the cutoff recurrence ought to be set marginally higher than the most noteworthy recurrence inside the message flag. The following some portion of the preparing chain is the cross relationship of the flag with the synchronization square wave. Each channel has its own particular synchronization square wave. The perfect synchronization square waves [16] are as appeared in figure 6. After AM demodulation was played out, the flag was plotted in GNU Radio to watch the got synchronization beats, these heartbeats are appeared in figure 7 and figure 8. The synchronization square wave chooses which channel is demodulated first. The channel demodulated first shows up on the left. The most extreme focuses in the cross relationship with the demodulated flag indicate precisely where the flag finished if the flag had a reasonable flag to commotion proportion. The cross-relationship of perfect synchronization wave with the got flag was measured and the plot of it is appeared in figure 9. In figure 9 the expansive spikes happen each half second which is the term of each line in the picture. Another critical trademark about this wave is that the second most noteworthy point happens a fourth of a moment after the most elevated point which appears that there is a noteworthy connection between synchronization beat An and B. This is on the grounds that both heartbeats are intermittent and have periods which are corresponding by whole number esteem.
signs that turn out of the collector and to locate the main genuine completion of a synchronization beat which would happen two seconds after another synchronization beat. It additionally takes into consideration interjection of synchronization wave from other synchronization focuses that are known to be great. This is required when there is significant obstruction in the flag. The following piece in the flag handling chain is the rundown rectification obstruct, in this square the test vector is sought to discover the principal esteem that is inside ten specimens of double the testing recurrence. Once that esteem is found the record by then is put into another rundown of good record focuses. At that point the following an incentive in the test vector is assessed. On the off chance that this esteem is inside 10 tests of double the examining recurrence then its esteem is put as the following estimation of the great file focuses. On the off chance that this esteem is not the following great file point it is discarded and the last known great file indicate is included the result of half of the inspecting recurrence furthermore, the quantity of terrible list focuses since the last great record point. The reason for this piece is to distinguish any conflicting connection focuses and after that insert these focuses with known steady list focuses and put them in the vector known as great list focuses. The demodulated flag and the great rundown of list focuses are at that point sent to the following piece which is called make
framework. Figure 5 Perfect synchronization
Figure 7 Adjust B in decoded APT flag great rundown of file focuses what's more, takes areas of the demodulated flag that begins at the focuses recorded and closes a large portion of the testing recurrence later and put these areas into a grid. This network is the information that is used to shape the picture and will be alluded to as the crude information matrix.[16] The information in each line is then resampled to guarantee there are remedy number of information indicates in each column shape the photo. The information focuses are
Figure 8 Cross relationship of demodulated flag with sync A
This piece utilizes the record focuses from the standardized with the goal that they go
should be flipped, this is done as such that the highest point of the picture alludes to north and the base of the picture is towards the south. Once these capacities are finished the last picture is shown on the screen.
2) Pseudo code of sound to picture disentangling a) Read sound record and check if the examining rate is 11025 Hz
b) Find number of columns by partitioning the aggregate number of tests with the quantity of tests in one column recurrence
c) Normalize the information flag d) Subtract the mean estimation of the flag from itself to improve the envelope
e) Find total of the flag to redress AM flag
f) Pass it through a Butterworth LPF
and subtract mean from itself g) Replicate the match up heartbeat and play out its relationship with baseband flag h) For all lines discover most extreme point in the relationship and store its file
i) Excluding the initial four lines, for all lines Contrast match up position of current line and that of a line 4 lines before it Store the distinction in lists in a Test exhibit
j) Determine the initially distinguished adjust beat with the revise dispersing and after that figure out where the first test of the main line is.
k) Starting from this file, check whether all records in Test are legitimate and accurately divided l) If invalid, add the list to Bad count and insert Good list utilizing it
m) Create a grid utilizing good list for each line n) Display the picture
3) Pseudo code of gray scale to warm warmth mapping
a) Decide a resistance esteem for expelling sync beat and telemetry bars b) Extract unmistakable bit from the
two channel picture from as far as possible to focus c) Extract Infrared bit also from focus to right restrict
d) Form a grid of zeros of length and stature equivalent to each of IR and obvious picture e) Concatenate this grid 3 times to shape a 3 channel RGB picture
f) Define a shading guide of 256 hues g) For every pixel a. Utilize a straight change [2] to delineate to temperature b. Outline temperature to picked shading from the shading map
h) Display the warm warmth delineate
V. RESULTS
Well-suited flag from the three dynamic NOAA satellites was gotten and decoded utilizing the executed setup. The flag was seen to be at around 4 dB when the satellites first showed up on the very edge of the skyline. As the height of the satellites expanded the SNR kept scaling to the point of greatest rise of the satellite amid that pass. The SNR was observed to be as high as 25 dB for heights of around 30 degrees. For satellite goes with higher heights, the SNR moved to a greatest of 37 dB when the rise of the satellite was at a most extreme of 88 degrees. In the wake of translating the motion with shifting SNR it was gathered that keeping in mind the end goal to acquire a reasonable commotion free picture in GNU Radio, a base SNR of
Hz which is steady with past dialog. The other unearthly segments in the range emerge from the match up heartbeat and the commotion which is show in the recorded information. The pictures that were acquired after the deciphering procedure are as found in figure 11 and figure 12. Since the SNR of the gotten
flag is beneath 20 dB limit toward the begin and end of the pass, the top and base some portion of the picture gives off an impression of being loud when contrasted with the center bit. The SNR of the gotten flag not just relies on the height of the satellite additionally relies on the ecological conditions at the reception apparatus. It was watched that in breezy conditions there were extensive changes in the beneficiary commotion floor. This presented extensive commotion in the got motion thus of which clear pictures couldn't be acquired. Likewise at certain heights the reception apparatus appeared to deliver nulls which came about in a dark line over the entire picture as found in the figure 11 also, figure 12. Fig.10. Two sided range of recorded wav document. The pictures as clarified before were handled further to get warm maps of the concerned region. For better understanding of the warmth maps, three of them, taken at various circumstances are appeared here. Figures 13, 14 and 15 delineate the landmass of India toward the evening, evening and in the morning separately. The temperature scale is mapped onto this shading map, and thus, as the temperature rises, the land seems more sweltering and more on the rosy end of the shading map.
The circumstance however is not the same in evening, where the majority of the Indian promontory and the Rajasthan betray can be seen in most profound red shading demonstrating high surface temperatures. The night outline to be significantly cooler in spite of the fact that, the shade of yellow is nearer to red than to blue, inferring that the surface temperature is higher than in the morning, yet lower than in the evening. A typical purpose of perception in all the three maps at various circumstances is the cool thick overcast cover over Himalayas which is seen considerably nearer to blue even in the evenings. Fig.15. Warm guide in the morning (7:05 AM).
Figure 11 GNU Radio decoded channel 1 picture
Figure 12 GNURadio decoded channel 2 picture
VI. CONCLUSION
Despite the fact that satellites have been utilized in the course of the last a few decades to get a wide assortment of data about the world's surface, the part of satellite imaging has dependably been hoarded by government or secretly financed associations. The populace in urban areas pretty much, utilizes satellites for the sole motivation behind route. The utilization of satellites for catching pictures which could be utilized for climate examination remains unexplored by the huge masses. The rustic populace is the one that necessities such understandings of climate information the most. Remembering all these, the paper gives a cost viable answer for executing a satellite imaging earth station. The accompanying objectives were met:
• The receiving wire outlines were made flawless, and this joined with the most appropriate receiving wire components guaranteed that there would be no radiation loss of flag, which counteracted any requirement for a pre-intensifier lessening the cost of the equipment setup. Using open- source virtual products, a self-sufficient getting station was setup that could catch pictures from overhead satellites, demodulate and disentangle them all alone with no work force working it. So simple and powerful picture quality is developed.
REFERENCES
[1]S. Glass, V. Muthukkumarasamy M. Portmann “A Software-Defined Radio Receiver for APCO Project 25 Signals”
[2]Kavitha P, Meera Mohan K, Surya R, Gandhiraj R, Soman KP” Implementation of CDMA in GNU Radio” International Conference on Information and Communication Technologies (ICICT 2014)
[3]Santhosh S, Kokila M, KaviNandhini M, Geetha P “Establishment of Pre-processing Station for Denoising NOAA Satellite Images using Legendre Fenchel Transformation method” IEEE Sponsored
2nd International Conference on Innovations in Information,Embedded and Communication systems (ICIIECS)2015 [4] Y. Konkel C. Hartwanger M. Schneider “Turnstile-based Antenna Feed Systems”
[5] Aswathi M, Gandhiraj R, Soman K P “Application and Analysis of Smart Meter Data along with RTL SDR and GNU Radio” SMART GRID Technologies, August 6-8,
2015
[7] Eric D. Conway, "An Introduction to
Satellite Image Interpretation ", Maryland Space Grant Consortium
[8] "Client's Guide for Building and Operating Environmental Satellite Accepting Stations", U.S. Dept of Commerce, National Oceanic and Climatic Administration, 2009. [9] A. Hassini, A. Belbachir, "Equipment and programming thought to utilize
close ongoing MSG-SEVIRI and NOAA- AVHRR Images," Programming and Systems Symposium ISPS, 2013, pp 12-16 [10] Bill Slade, "The fundamentals of
Quadrifilar Helix Antennas", Technical Article for OrbanMicrowave Products
[11] K. Vachhani, A. Rao, "Trial ponder on wide band FM beneficiary Utilizing GNURadio and RTL-SDR", International Conference on Advances in Computing, Communications and Informatics, ICACCI
2015
[12] Government site for points of interest on NOAA: http://www.noaa.gov/satellites [11] Tutorial on building a recipient: http://www.rtl-sdr.com/rtl-sdr-instructional
exercise accepting noaa-climate satelliteimages [13]http://www.antennatheory.com/definitio ns/infinite.php
[14] Online number cruncher of QFH measurements : http://www.jcoppens.com/insect/qfh/index.e n.php [15] Link for all drivers and modules of the
SDR Dongle: http://www.rtl-sdr.com/
[16] Open source programming joins: SDRSharp, www.airspy.com