International Conference on Urban and Regional Planning, 2014
Spatiotemporal Land Use Change Analysis Using
Open-source GIS and Web Based Application.
W. YUSRYZAL W. IBRAHIM ͣ and AHMAD NAZRI M. LUDINᵇ
ͣ
Department of Landscape Architecture, UniversitiTeknologi Malaysia ᵇ Department of Urban and Regional Planning, UniversitiTeknologi Malaysia
Abstract
Spatiotemporal changes are very important information to reveal the characteristics of the urbanization process. Sharing the information is beneficial for public awareness which then improves their participationin adaptive management for spatial planning process. Open-source software and web application are freely available tools that can be the best medium used by any individual or agencies to share this important information. The objective of the paper is to discuss on the spatiotemporal land use change in Iskandar Malaysia by using open-source GIS (Quantum GIS) and publish them through web application (Mash-up). Land use in 1994 to 2011 were developed and analysedto show the landscape change of the region. Subsequently, web application was setup to distribute the findings of the study. The result show there is significant changes of land use in the study area especially on the decline of agricultural and natural land whichwereconverted to urban land uses. Residential and industrial areas largely replaced the agriculture and natural areas particularly along the coastal zone of the region. This information is published through interactive GIS web in order to share it with the public and stakeholders. There are some limitations of web application but still not hindering the advantages of using it. The integration of open-source GIS and web applicationare very helpful in sharing planning informationparticularly in the study area that experiences rapid land use and land cover change. Basic information from this study is vital for conducting further study such as projecting future land use change and other related studies in the area.
KEYWORDS: Spatiotemporal, Land Use Change,Open-source GIS, Web Application
1. Introduction
Urbanization has triggered rapid land use and land cover change especially in developing countries. Several major driving forces contribute to the changes of land use such as population growth, economic development and policy adjustment(Li et al., 2003; Pimental et al., 2006 and Lu et al., 2012). There is different scale of the developmentwhich can be categorized into different temporal and spatial presentations (Mérnard et al., 2007 and Compas, 2007). As regard to the complex urbanization process, various types of landscape composition and configuration can be seen at the landscape level. These characteristics are important elements that influence the whole landscape ecological functionsand disturbing the ecological value and services (Beardsley et al., 2009 and Perrodin et al., 2011).It is necessary
to share the spatiotemporal information of land use and land cover change to stakeholders in order to improve knowledge and public awareness on their surroundings. At the same time, it will attract more participation by public and stakeholders to support planning decisionfor future development.
Monitoring and evaluating are important aspects in adaptive management before designand implementation of development take place. The management is more adaptive as we try to balance human needs and maintain ecological value and services (Mann et al., 1996 and Szaro et al., 2005). Thus it needs the spatiotemporal studies which focus on land use and land cover change of historical and future development. However lack of important information from past development and their consequences will contribute to inappropriate decision for future development. Thus, the approach and tool should be easily available for sharing the information to enhance understanding of the situation.As regard to the issues, GIS and remote sensing play important function in providing valuable information in spatiotemporal studies. It has been widely used as important environment to analyse the characteristics of temporal land use change and provides detailsinformation of temporal land cover (Antrop, 2004; Deng et al., 2009; Han et al., 2009; Huang et al., 2009 and Wang et al., 2011). Many studies and applicationsconducted in many regions indicated different characters of the spatial changes due to their internal and external driving forces. However this integration has limitation especially on software availability and the methodto share the information. There is need ofcost for software and training involved with separate allocation for sharing the information.
In this decade, a new trend of software development shows significant increase of open-source software and improvement of web-based application (Kulawaik et al., 2010;Neteler et al., 2012; Jeong et al., 2012;Steiniger et al., 2013 and McCool, 2014). This development has overcome the aforementioned issues withvarious methods to extendspatial planning capability in analysing data and sharing information. Limitations of GIS spatial analysis tools and medium for sharing the informationcan be resolved by utilizing and exploring toolsthat are freely available. Thus, the spatiotemporal changes analysis and sharing the informationcan be made faster withoutcostimplication. Many people can access and retrieve the information through web application and respond with their idea to consolidate better decision in the future land use planning(Simão et al., 2009 and Qiu et al., 2012). Quantum GIS is one of the open-sources GIS software available that has good performance in terms of functionality, data format and database, and complexity(Chen et al., 2010).Thus this paper discusses the spatiotemporal land use change analysis using open-source GIS and shares theinformation through webapplication. The focus of this study isanalysing the land use change inIskandar Malaysia between 1994and 2011.
2. Materials and Research Methods
Several stages were involved in the study such as database development, database analysis and presentation.Figure 2 shows the framework of the study that describes sequence of the process in this study.
Figure 1: Framework of the study application
i. Study Area
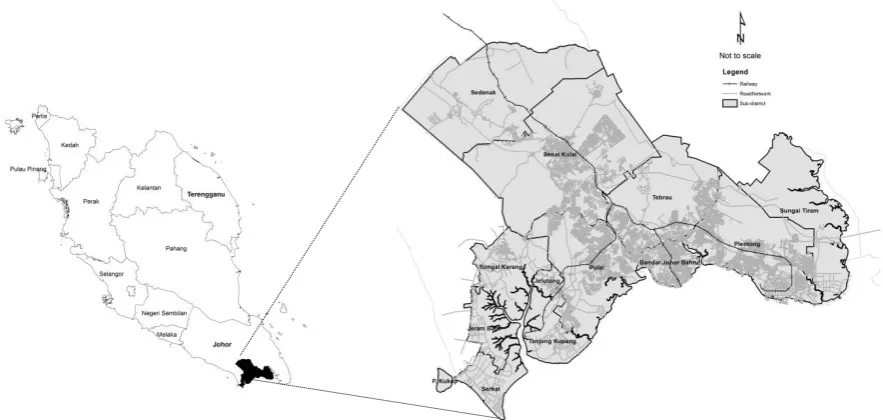
The selected study area is Iskandar Malaysia region located at the southernmost area in the State of Johor (Figure 2). It covers 221 634.1 hectares (2 216.3 square km) of land that covers the whole of Johor Bahru district and some areas in Pontian district. Johor Bahru especially is one of the prominent cities in Malaysiahaving high competitive development particularly in residential, commercial and industrial sectors. Population has promptlygrown with enormous immigration of people from surrounding districts, other states and Singapore. As part of a major role as a capital city, the boom of socioeconomic activities spur rapid urbanization to its surrounding. Since 1994large economic developmenthas increased demand for urban land use that contributed tohuge transformations of existing land uses in this region. In the last couple of years intensive developmentshavetaken place due to new comprehensive development policies for the region by the federal government along with the state government of Johor. It becomes the main entry point for people from Singapore and other countries and elevatesJohor Bahruas an international city providing business potential and logistic hub. As a result, large land use and land cover has significantly changed due to the policies established by the government. Thus, this study discussesthe spatiotemporal land use dynamics of the study area from 1994 to 2011.
Figure 2:Iskandar Malaysia region and its location in Peninsula Malaysia.
Output
Database development Land Use 1994
Land Use 2011
Land Use Change Analysis
Open-Source GIS
Web Application
Designing User Interface
Data uploaded
Raster Vector
GIS environment
Sharing Information Change Detection Map
Transition Matrix
ii. Database development (Land use in 1994 and 2011)
Development of database is focused on the land use characteristics of Johor bahru (Iskandar Malaysia) in 2 different years which is 1994 and 2011. Development of thistwo yearland use databaseswere in similar category and compatible to each other. Development of the data isreferring to valid sources such as digital information from government agencies and printed documents from library. All the data were translated into GIS vector format(shapefile)with MalaysiaRSO (Rectified Skewed Orthomorphic) coordinate system. This coordinate system is selected due to the main reference of database development using topographic maps. Meanwhile, there are 8 categories of land uses classifiedsuch as water body, industry and commercial, infrastructure, institutional, transportation, vegetation (agriculture and forest), residential and open space. The mapping unit for the database development is by lot and land parcel(polygon).Every single polygon has basic information such as type of land use zoning, first level and second level activity, area, perimeter and others. This application however used only the attribute of land use and area of each polygon. In this case, the data has been developed using ArcGIS 10.1 since it performs faster in handling thousands of polygons. Nevertheless, open-source GIS (Quantum GIS) also has strong capability in developing spatial databases.
iii. Land use change analysis
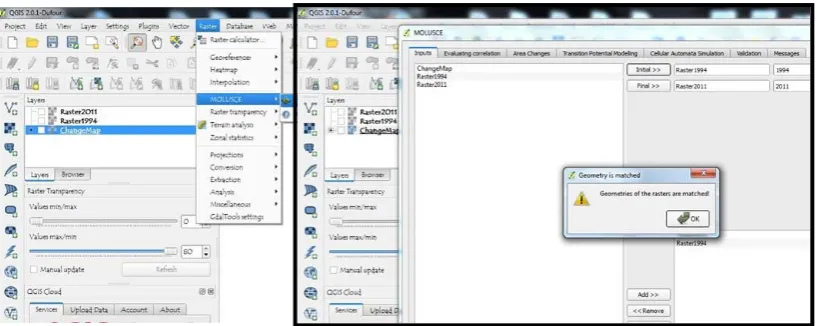
In this study the land use changeanalysis is done by comparing two different years of land uses in IskandarMalaysia (1994 and 2011) using open-source GIS software. Particularly in Quantum GIS, the measurement of the land use change is done by using Molusce(Modules for Land Use Change Evaluation)function (Figure 2). Itis an extension function capable to analyse and distinguish the land use change characteristics between two different years. The function needs to be downloaded separately and installed to ready QGIS system. In this study the land use maps in 1994 and 2011 were analysed to see the spatial patternchanges. The
Molusceis quite similar to spatial analyst tools in ArcGIS software however it is in one
important package in QGIS that cover several important functionsfor spatiotemporal study.
Figure 2:Molusce function analysis in Quantum GIS
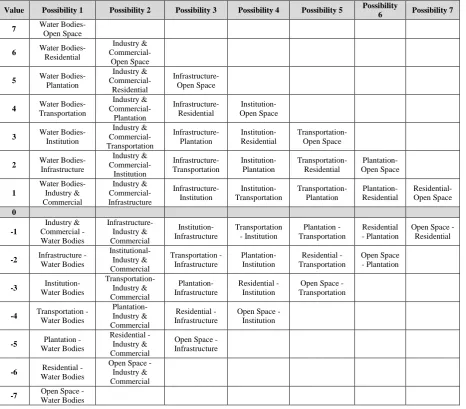
The data is analysed through overlaying processon raster land use data. As a result, the data is displayed under the “Area Change” table (Table 1). It shows the possibility of
transformation of each land use to other land use. Besides that, the created change map indicatesthe location of the area changes. It represents the distribution of converted areas with detail information on its attributes. Molusceis able to calculate a transition matrix of the probability of changes between any given classes and optionally generates a map showing thematically all types of land use change.The output table is exported into Microsoft Excel software to convert the format and for graphs preparation.
iv. Web GIS establishment
Sharing information through web is the best approach and platform in order to increase people awareness about their environment change. Everybody can access the information easily and interpret the information given. In this application we used Mash Up programme to publish our findings from GIS analysis. It is a free application that allows users to design their own friendly interface. Users are able to configure their own interface based on appropriateness of their information. The first step in the establishment of web application
Value Possibility 1 Possibility 2 Possibility 3 Possibility 4 Possibility 5 Possibility
6 Possibility 7 7 Water Bodies- Open Space
6 Water Bodies-Residential
Industry &
Commercial-Open Space
5 Water Bodies-Plantation Industry & Commercial-Residential Infrastructure-Open Space
4 Water Bodies-Transportation Industry & Commercial-Plantation Infrastructure- Residential Institution- Open Space
3 Water Bodies-Institution Industry & Commercial-Transportation Infrastructure- Plantation Institution- Residential Transportation- Open Space
2 Water Bodies-Infrastructure
Industry & Commercial-Institution Infrastructure- Transportation Institution- Plantation Transportation- Residential Plantation- Open Space 1 Water Bodies-Industry & Commercial Industry & Commercial-Infrastructure Infrastructure- Institution Institution- Transportation Transportation- Plantation Plantation- Residential Residential- Open Space 0 -1 Industry & Commercial - Water Bodies Infrastructure-Industry & Commercial Institution- Infrastructure Transportation - Institution Plantation - Transportation Residential - Plantation
Open Space - Residential
-2 Infrastructure - Water Bodies Institutional-Industry & Commercial Transportation - Infrastructure Plantation- Institution Residential - Transportation Open Space - Plantation
-3 Institution- Water Bodies Transportation- Industry & Commercial Plantation- Infrastructure Residential - Institution
Open Space - Transportation
-4 Transportation - Water Bodies Plantation- Industry & Commercial Residential - Infrastructure
Open Space - Institution
-5 Plantation - Water Bodies
Residential - Industry & Commercial
Open Space - Infrastructure
-6 Residential - Water Bodies
Open Space - Industry & Commercial
-7 Open Space - Water Bodies
Table 1:The possibility of the land use change from year 1994 to year 2011.
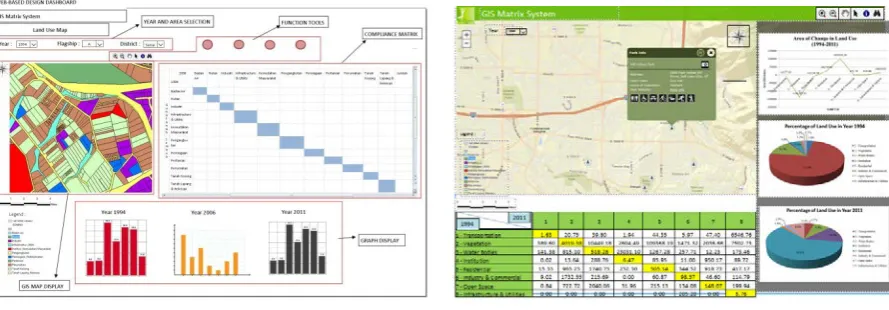
is designing the user interface. Several functions and tools are provided to help users explore the application (Figure 3). Configuration is made based on the information that we need to publish and easy for users to interpret the information. The next step is uploading all the documents such as maps, tables and figures into the application (Figure 4). Thatinformation isrelated to each other and they must be well presented. Once all the process is finished, the link for the application is created and the application started can be used.
3. Results and Discussion
3.1 Land use change from 1994 to 2011
The spatiotemporal study shows the tremendous impact on land use composition and configuration in the pastat Johor Bahru district (Figure 5). Urbanization and comprehensive development policy by the federal and local goverments have significantly contributed to the rapid land use change in this region. It is apparent that large urban areas have replaced agriculture landswithin the study period. Agricultural areas of84.4% in 1994 has reduced to 60.03% in 2011. On the other hand, urban land use has significantly increased with total percentage of24.06% andresidential use is the largest portion of area development. Similarly, the other urban land uses such as industrial and commercial, institution, infrastructure and utilities, and also transportationincreased with different scales. Meanwhile, water body and open space areas relatively decreased due to increasing of urban land use in this region.
As regard to the changes, Figure 6 indicates the different percentage of each land use change in the past. Overall, all the land uses have different trendsof changes. Vegetation land area decreased whereas others increased expanded, removingthe other land uses. Itisdecliningwith24 % loss of its area. It shows that the past development significantly removed the agricutural areas partciluarly oil palm estates. The water body areas also have been replaced by other land use activites. In 1994, 2.16% of water body areas weremaintained to 2.30% in 2011. In contrast, urbanization has led to rapid land use change and contribute to remarkable increase of residential areas from 5.33% in 1994 to 14.20% in 2011. Within 13 years it shows that the changes are very rapid. Demograpy aspects and comprehensive development policy have caused high competition of land development and created complexity inthe study region. Parallel to the development boom of residential area is the expansion of institution, industy and commercial, transportation, infrastructure and utilitiesareas. These developments are important to support high population growth and important assests to achieve international city standing.
Figure 3:Designing user interface of the
Mash Up application.
Figure 4: Example of the design for land use change information in the
webapplication.
Figure5:Different composition of land use percentage in 1994 and 2011.
Change analysis shows the propotion of the transformation of vegetation areato the expansion of urban land uses. Some of the developed areas were also replaced by new development that change to new land use activities. It is clear can be seen that the agriculture areas were replaced by various urban land uses andthe most significantbeing residential. Besides that, some developed areas such as existing residential areas were also converted to other land use activities like institution, infrastructure, industry and commercial.This situation happened due to the regeneration of urban land use in Johor Bahru city centre and consequeces of the implementation of comprehensive new development area that replaced
In other perspective, the results in this application indicate the capability of open-source GIS (Quantum GIS) to run spatial analysis for spatiotemporal land use change study. The maps and tables produced can be interpreted easily by users and it shows itsoperations is comparable to the other available GIS software. In fact by using Molusce function it expedites the land use change analysis. This information is required for the land-use planners to perform their jobs and share it with other members of the community to aid in the decision-making processes. Meanwhile sharing this kind of information is meaningful since individuals or agencies can use and interpret the information easily. Thus it seems to have a big potential for planning enviroment to use open-source GIS as a platform in adaptive management. Specifically, the application is useful for land use planners and decision makers
-30 -25 -20 -15 -10 -5 0 5 10 15
Figure6:Percentage of each land use convertedfrom 1994 to 2011
to monitor and asess their long term development. With the information available, they are able to evaluate the spatial development in Iskandar Malaysia and adjust or control the development direction appropriately. Besides that, it helpsthe community to understand the changes of their development and possible for stakeholders to evaluate the development perspectives. In addition, the findings of the application canalso important to relate with other aspects of studies such as urban design, urban heat island, transporation, socioeconomic evaluation, environmental and landscape ecology. It also provides vital information to state or local govermentdirectly involved in the development of the region. Some agencies can also benefit to look at the larger scale of the business potential of the region and at the same time predicting risk and consequences of their investment.By analyzing the future potential development using the open-source GIS software shows a clear illustration of the various fields that can be benefit from exploring these spatiotemporal infomation.
3.2 Publishing land use change information through web application
Publishing information through web is one of the best platforms to share results of the spatiotemporal land use change study. The public and stakeholders easily can access to review the land use change and their environment characteristics.Maps and tables are posted in the web to share detail information of the study. In this application we uploaded all the output from the land use change analysis into the webapplication (Mash up). The web is designed based on the informationand considering the aspect of friendly user interface. Arrangements of the contents and tools aresimple for user to browse the results (Figure 7).
After reviewing the web application, there are some advantages obtained from the published work. Firstly, the application shows in detail the land use characteristics through different layers of land use maps.All the information for each polygon can be retrieved through query provided in this application. Secondly, the uploaded maps are overlaid with existing map serverthat shows more information on the context area. The graphs and tables for the land use characteristics for each year provide more information for users. It makes stakeholders easy to interpret and understand the changes happening in Johor Bahru area. Apart from this work, this web can also be used to publish future zoning plan in any area.
Figure7:Web application (Mash up) shows land use change results of Johor Bahru city centre.
This method can be adopted in order to get wide and faster revision from stakeholders. This is a reliable approach to get more opinions on the future plan besides time and cost for the planning process will be reduced. However the disadvantage of this application its limited size of file can be uploaded into the system in. Thus the designer should consider thoroughly and be creative to choose information and the design the application.
4. Conclusion
As a conclusion, spatiotemporal land use changeanalysis is crucial for the assessment of progress and effectiveness of development activities in this region. Besides thatdecision makersareable to monitor and evaluate the land use change characteristics thatrelate to other aspects such as ecological impact, traffic and infrastructure problems. Adjustment or design for the future plan will be more comprehensive by involving public in the development decision making process. It will attract many experts and people with multidisciplinary background to involve and share their ideas to produce a better collaborative planning for community and environment.
Acknowledgement
We thank for Department of Town and Country Planning Johor for the information and the students from Urban and Regional Planning Department at UTM for their work as part of the application in the study.
Reference
Antrop, M. (2004). Landscape change and urbanization process in Europe.Landscape and Urban
Planning, 67, 9–26.
Beardsley, K., Thorne, J. H., Roth, N. E., Gao, S. and McCoy, M. C. (2009). Assessing the influence of rapid urban growth and regional policies on biological resources.Landscape and Urban Planning, 93, 172–183.
Chen. D,Shams. S, Carmona-Moreno.C. and Leone, A. (2010).Assessment of open source GIS software for water resources management in developing countries. Hydro-enviroment Research 4, 253-264.
Compas, E. (2007). Measuring exurban change in the American West: A case study in Gallatin County, Montana, 1973-2004.Landscape Urban Planning, 82, 56-65.
Department of Town and Country Planning (Johor). Structure Plan Johor Bahru District 1998-2020. Department of Town and Country Planning (Johor). Local Plan Johor Bahru District 2012-2020
(Amendment).
Deng, J. S., Wang, K., Hong, Y. and Qi, J. G. (2009).Spatio-temporal dynamics and evolution of land use change and landscape pattern in response to rapid urbanization. Landscape and Urban Planning, 92, 187–198.
Federal Department of Town and Country Planning, Ministry of Housing and Local Government (Malaysia). National Physical Plan 1 (2000)
Federal Department of Town and Country Planning, Ministry of Housing and Local Government (Malaysia).National Urbanization Policy (2006).
Federal Department of Town and Country Planning, Ministry of Housing and Local Government (Malaysia).National Physical Plan 2(2010).
Han, J., Hayashi, Y., Cao, X. and Imura, H. Application of an integrated system dynamics and cellular automata model for urban growth assessment: A case study of Shanghai, China. Landscape and Urban Planning, 91, 133-141.
Huang, S. L., Wang, S. Z. and Budd, W. W. (2009). Sprawl in Taipei’s peri-urban zone: Responses to spatial planning and implications for adapting global environmental change. Landscape and Urban Planning, 90, 20-32.
Jeong, J. S., Garcia-Moruno, L. Hernandez-Blanco, J. (2012). Integrating buildings into rural landscape using a multi-criteria spatial decision analysis in GIS-enabled web environment.
Biosystems Engineering, 112, 82-91.
Li, L., Sato, Y. and Zhu, H. (2003).Simulating spatial urban expansion on a physical process.Landscape and Urban Planning, 64, 67-76.
Li, M., Huang, C., Zhu, Z., Shi, H., Lu, H. and Peng, S. (2009). Forest Ecology and Management.257, 1480-1488.
Lu, J. and Guldmann, J. (2012). Landscape ecology, land use structure, and population density: Case study of Columbus Metropolitan Area. Landscape and Urban Planning, x, xxx –xxx.
IRDA (2008). Comprehensive Development Plan for Iskandar Malaysia Region 2006-2025.
Kulawiak, M., Prospathopoulos, A., Perivoliotis, L., Luba, M., Kioroglou, S. and Stepnowski, A. (2010).Interactive visualization of marine pollution monitoring and forecasting data via a Web-based GIS.Computers & Geosciences, 36, 1069-1080.
Mann. S. and Benwell. G. L. (1996). The integration of ecological, neural and spatial modelling for monitoring and prediction for semi-arid landscape.Computers & Geosciences, 22, 1003-1012. McCool, J. P. (2014). PRAGIS: a test for a web-based archeological GIS. Journal of Archeological
Science, 41, 133-139.
Mérnard, A. and Marceau, D. (2007). Simulating the impact of forest management scenarios in an agricultural landscape of southern Quebec, Canada, using a geographic cellular automata. Landscape and Urban Planning 79, 253-265.
Neteler, M., Bowman, N., Landa, M. and Metz, M. (2012). GRASS GIS: A multi-purpose open source GIS. Environmental Modelling & Software, 31 (2012) 124-130.
Perrodin, Y., Boillot, C., Angerville, R., Donguy, G. and Emmanuel, E. (2011). Ecological risk assessment of urban and industrial systems: A review. Science of the Total Environment, 409, 5162-5176.
Pimental, D. and Pimental, M. (2006).Global environment resources versus world population growth.Ecological Economics. 59 (2), 195-198.
Qiu, F., Ni, F., Chastain, B., Huang, H., Zhao, P., Han, W. and Di, L. (2012). GWASS: GRASS web application software application software system based on the GeoBrain web service. Computers & Geoscience, 47, 143-150.
Simão, A., Densham, P. J. and Haklay, M. (2009). Web-based GIS for collaborative planning and public participation: An application to strategic planning in of wind farm sites. Journal of Environmental Management, 90, 2027-2040.
Steiniger, S. and Hunter, A. J. S. (2013). The 2012 free and open source GIS software map – A guide to facilitate research, development, and adoption. Computers, environment and urban systems, 39, 136-150.
Szaro, R. C., Boyce Jr. D. A and Puchlerz, T. (2005). The challenges associated with developing science-based landscape scale management plans. Landscape and Urban Planning, 72, 3-12. Wang, H., Li, Xiaobing, L., Long, H., Qiao, Y. and Li, Y (2011. Development and application of a
simulation model for changes in land-use patterns under drought scenarios. Computers and Geosciences, 37, 831-843.