For the 2012-2014 EcoCAR2 competition, the NCSU EcoCAR2 team designed and constructed a 340V 18.9kW-Hr lithium-ion battery pack. This pack consisted of seven A123 Systems 47.5V prismatic lithium-ion battery modules electrically configured in series. Competition rules dictated the pack be designed to withstand acceleration magnitudes of 8g vertical and 20g longitudinal with proper wire and fuse sizes to ensure safety.
by
Jason Edward Markijohn
A thesis submitted to the Graduate Faculty of North Carolina State University
in partial fulfillment of the requirements for the degree of
Master of Science
Electrical Engineering
Raleigh, North Carolina
2013
APPROVED BY:
_______________________________ Dr. Iqbal Husain
Committee Chair
________________________________ ________________________________
DEDICATION
BIOGRAPHY
The author, Jason Markijohn, has had a passion for cars since high school. He taught himself how to rebuild whole engines and repair vehicles through trial and error. However, his love for engineering and inventions started long before high school. Even as a young child, Jason was interested in how everything worked, and he fed his hunger for knowledge by taking things apart and not necessarily always putting them back together.
Jason Markijohn was born July 19, 1987, in Youngstown Ohio. He is the middle son of Cindy and Phil Markijohn. Jason grew up in a country house on nine acres of land in Canfield, Ohio. He attended high school at Western Reserve High School where he spent his time playing football and running track and cross-county.
After graduating from high school, Jason attended Ohio University in Athens, Ohio, for his bachelor’s degree in Electrical Engineering. During his junior year he became involved in a program that dealt with an electric racecar called the Electric Bobcat. Jason became the president of the program and rekindled the fire in his team members to get the car running again. It was through Jason’s experience with the Electric Bobcat that he discovered his interest in electric vehicles.
After graduating from Ohio University, Jason moved to North Carolina and began working at NAVAIR, in Havelock, North Carolina. After two years, Jason learned of the SMART scholarship program, which offered to pay him to return to school. Jason applied and was accepted. He chose to pursue his degree at North Carolina State University.
At State, he began participating in the EcoCAR2 program. This has allowed his knowledge and passions for cars to mature. He has been the head of the electrical and energy storage system teams and had to overcome many obstacles while working on the EcoCAR2. As a team they have participated in two competitions.
ACKNOWLEDGMENTS
I would like to thank my fiancée for her patience during my studies and for putting up with me being away from home these past two years.
TABLE OF CONTENTS
LIST OF TABLES ... vi
LIST OF FIGURES ... vii
1. INTRODUCTION ... 1
1.1 EV and PHEV... 1
1.2 Batteries ... 2
1.3 Hybrid Configurations ... 4
1.4 Motivation ... 7
1.5 ADVISOR ... 9
2. ARCHITECTURE AND COMPONENT SELECTION ... 10
2.1 Series or Parallel ... 10
2.2 Component Selection ... 21
2.3 Conclusion ... 31
3. ESSANALYSIS ... 33
3.1 Module Configuration Selection ... 33
3.2 Electrical ... 37
3.3 Thermal ... 41
3.4 Physical ... 43
3.5 Structural... 45
3.6 EMI Mitigation Techniques ... 47
3.7 Protection ... 48
3.8 Safety ... 49
3.9 Performance ... 51
4. ADVISORSENSITIVITY STUDY ... 58
5. CONCLUSION ... 60
LIST OF TABLES
Table 1: Vehicle Technical Specifications for Stock, Competition, and NCSU’s Design Goals .. 9
Table 2: Configuration of Vehicle Parameters for ADVISOR Modeling ... 10
Table 3: Performance between Series and Parallel ... 15
Table 4: 20% SOC Range (miles) for Parallel and Series Architectures ... 19
Table 5: A123 Module Specifications ... 25
Table 6: Component Specification List ... 31
Table 7: ESS Sizing Comparison... 33
Table 8: Charge Depleting Range ... 34
Table 9: Weighted Energy Consumption ... 35
Table 10: Greenhouse Gas Emissions and Petroleum Energy Use ... 35
Table 11: Standard Minimum Creepage Distances, Given in Millimeters [13] ... 50
Table 12: Standard Minimum Clearances Distances for Insulation in Primary Circuits and Between Primary and Secondary Circuits, Given in Millimeters [13] ... 51
LIST OF FIGURES
Figure 1: Charge Time - EV Range on a Miles/Minute [2] ... 2
Figure 2: Battery Technology Evolution [7] ... 3
Figure 3: Lithium-Air Battery - Using oxygen in the air for the cathode and lithium metal for the anode allows for a smaller and lighter package [4] ... 4
Figure 4: Series Hybrid Configuration ... 5
Figure 5: Parallel Hybrid Configuration ... 6
Figure 6: Series-Parallel Hybrid Configuration ... 7
Figure 7: AVTC History of Competitions [10] ... 8
Figure 8: UDDS Drive Cycle ... 12
Figure 9: US06 Drive Cycle ... 12
Figure 10: HWFET Drive Cycle ... 13
Figure 11: EcoCAR2 Composite Drive Cycle ... 13
Figure 12: MPG for Series and Parallel Architectures... 14
Figure 13: Hydrocarbon Emissions ... 15
Figure 14: Carbon Monoxide Emissions... 16
Figure 15: Nitrogen Oxides Emissions ... 16
Figure 16: Particulate Matter Emissions ... 17
Figure 17: Sum of HC, CO, NOx, and PM ... 18
Figure 18: SOC for Drive Cycles vs. Time ... 19
Figure 19: Motor Torque for Parallel and Series Architectures ... 20
Figure 20: Effect of Engine Size to Fuel Efficiency ... 21
Figure 21: Effect of Engine Size to Emissions Output ... 22
Figure 22: Effect of Motor Size on Acceleration ... 23
Figure 23: Effect of Motor Size on Range ... 23
Figure 24: US06 Drive Cycle with 40 kW Motor ... 24
Figure 25: Magna E-Drive ... 25
Figure 26: A123 Modules mounted in ESS battery frame ... 27
Figure 27: A123 CSM ... 28
Figure 28: A123 EDM with (left) and without (right) cover ... 29
Figure 29: A123 BCM ... 29
Figure 30: TYCO MSD ... 30
Figure 31: NCSU Series Plug-In Hybrid Electric Vehicle (PHEV) ... 32
Figure 33: ESS LV Wiring Schematic ... 38
Figure 34: ESS HV Wiring Schematic ... 39
Figure 35: ADVISOR results showing current vs. time in CD mode ... 41
Figure 36: ADVISOR thermal analysis results ... 42
Figure 37: SOC and Module Temperature vs. Time for 10 Cycles of US06HWY ... 43
Figure 38: ESS Module Orientation ... 44
Figure 39: ESS in trunk of Chevy Malibu ... 45
Figure 40: 8g Vertical Acceleration ... 46
Figure 41: 20g Longitudinal Acceleration ... 46
Figure 42: Ford Focus EV with Pb acid batteries running UDDS cycle ... 52
Figure 43: Ford Focus EV with NCSU's Li-Ion battery pack running UDDS cycle ... 52
Figure 44: Effect of Module Number to Range ... 54
Figure 45: Effect of Module Number to Fuel Efficiency for Composite Drive Cycle ... 54
Figure 46: Effect of Module Number on Total Emissions Output ... 55
Figure 47: SOC vs. Time for Different Number of Modules ... 56
Figure 48: Module Temperature Rise during EcoCAR2 Composite Drive Cycle ... 57
Figure 49: Range Sensitivity to Max AH Capacity ... 58
Figure 50: Range and Performance Sensitivity to Vehicle Weight ... 59
1.
Introduction
1.1 EV and PHEVThe United States is highly dependent on oil with transportation being responsible for two-thirds of our petroleum usage. Of these two-two-thirds, approximately 80 percent is used in on-road vehicles [1]; there are more than 240M vehicles on the on-road [2].
To decrease petroleum dependence and reduce greenhouse gas emissions, more energy-efficient and environmentally friendly vehicles must be developed. This all starts with battery technology. If electric vehicles are to become the “norm” for commuters in the U.S., battery technology needs to store a lot more energy, be affordable, and have the supporting infrastructure.
With today’s battery technology, affordable electric vehicles (EVs) like the Nissan Leaf and Ford Focus EV are ranging about 100 miles on a single charge, depending on how it is driven and what accessories are being used. More expensive vehicles, like the Tesla Roadster or Tesla Model S, are seeing upwards of 250-300 miles on a single charge, though these models quickly reach the six-figure price tag. These vehicles would be great for a daily commute, but are not yet feasible for a road trip. The infrastructure for charging stations is not in place yet, and charge times aren’t practical during long road trips either. Figure 1 shows a breakdown of typical charging times versus a common fuel pump. Clearly, needing to stop every 70 miles to charge up, even with a fast charger, would make even a short road trip a hassle.
Figure 1: Charge Time - EV Range on a Miles/Minute [2]
1.2Batteries
Battery technology has come a long way. Figure 2 shows a brief timeline of this progression. The first rechargeable battery was invented in 1859 by Gaston Planté in the form of a lead-acid battery. These batteries are quite heavy and have a very low energy density. However, since the lead-acid battery was invented, it has not changed much. In the 1970s, a gel version was created to enable batteries to be mounted in any orientation, for example on its side, without leaking or failure [3].
Nickel-cadmium (NiCd) batteries reached the U.S. market in 1946. These batteries were much more robust and had significantly better energy density in comparison to lead-acid batteries. However, like all new technologies, these were quite a bit more expensive at the time than the lead-acid batteries [3].
first lithium batteries were sold. The slightly more stable and more common version of the lithium ion battery was not commercialized until 1991 [3].
The lithium ion polymer battery was released in 1997. This battery holds its electrolyte in a solid polymer composite instead of a liquid solvent. This allows it to be encased in a flexible package instead of a rigid metal casing, which enabled packaging in more complex spaces [3].
Future battery technologies are being studied in labs today. A joint collaboration between Toyota and BMW to design the next generation battery for electric vehicles is currently ongoing. They are focused on the lithium-air technology (Figure 3), which they believe could see 5 times more energy storage density than the current lithium-ion technology. This means that a current 100-mile range Nissan Leaf could travel 500 miles on a single charge. Unfortunately, this new technology isn’t expected to reach EVs until 2020 [4,5,6].
Figure 3: Lithium-Air Battery - Using oxygen in the air for the cathode and lithium metal for the anode allows for a smaller and lighter package [4]
1.3Hybrid Configurations
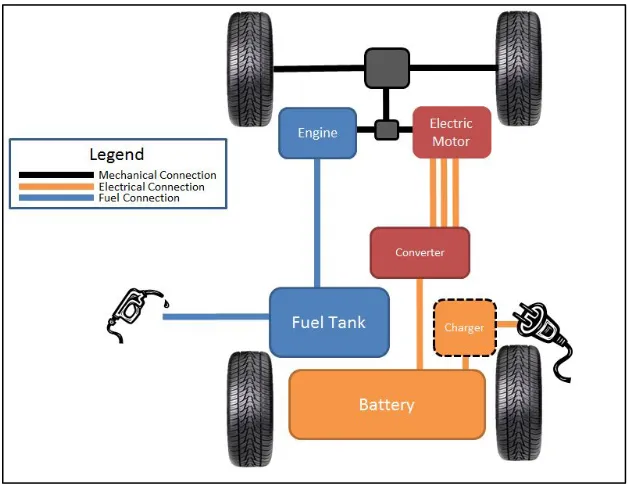
Hybrid vehicles come in series, parallel, or series-parallel powertrain configurations. Hybrid vehicles also may include a plug-in option or rely solely on the on-board generator to recharge their batteries. The ability to charge the battery pack while not in use increases the efficiency of the vehicle. A consumer could potentially drive a plug-in hybrid electric vehicle (PHEV) strictly as an EV, assuming they never exceeded the charge sustaining (CS) criteria of the vehicles controls.
Plug-in hybrids also add the unique ability to use any form of power-producing method available to the consumer. Consumers, whose homes are powered by fossil fuels, still retain a carbon footprint by charging at home. However, installation of a wind or solar power system would net a zero carbon footprint for the consumer as they charge their vehicle.
The three hybrid configurations have their advantages and disadvantages over one another. For the scope of this research, the three configurations will be viewed as plug-in hybrid electric vehicles.
1.3.1Series PHEV
motor receives its power via the high voltage (HV) bus. This power comes from either the generator, the energy storage system (ESS), or both. During the charge-depleting (CD) mode, the vehicle operates as a purely electric vehicle until a certain controls-determined state-of-charge (SOC) is reached. At this point, the generator will be powered by some form of engine to generate power to begin recharging the ESS under light load, or supplying all the power to the electric drive motor under heavy load. This configuration makes the vehicle more efficient in city driving.
A benefit of this system is the ability to operate the engine at a specific operating point that is either most efficient, produces the least emissions, or possibly both. Engineers have the freedom to choose one or a few operating points for the engine to meet specific performance goals. For example, if the vehicle demanded more power than the current output of the engine, the system could switch to a peak-power operating point to ensure the vehicle’s performance was not inhibited.
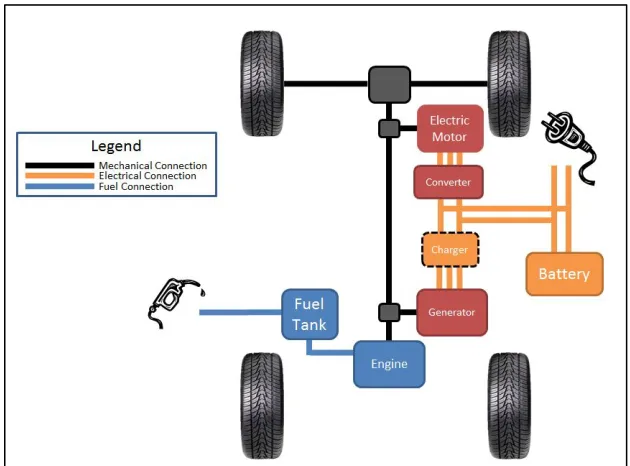
1.3.2 Parallel PHEV
A parallel PHEV architecture, seen in Figure 5, utilizes both the engine and electric motor as the final drive for the system. Since the engine and motor share the total load, the electric motor can be smaller than in a series PHEV. The amount of shared load can be determined by the designer and will dictate the level of hybridization that occurs. A well-balanced system would see the engine operating in its most efficient ranges most of the time, at a point of least emissions output.
Figure 5: Parallel Hybrid Configuration
An advantage of this design is that the motor, ESS, and engine can be smaller than in a series. The net result of this is typically a less expensive vehicle. The control complexity would increase with the parallel architecture. This design typically sees its most efficient point during highway driving.
1.3.3 Series-parallel PHEV
during a drive cycle. The major drawback of this system is its overall complexity. The controls strategy of this method requires major design considerations as well as tradeoff analysis. Due to the overall complexity and infinitely configurable parameters, this configuration will not be analyzed in later sections, but is mentioned here for completeness.
The advantage of this architecture is that it combines the benefits of both series and parallel. This means that it can achieve good efficiencies in city driving, as well as highway driving.
Figure 6: Series-Parallel Hybrid Configuration
1.4Motivation
Recognizing the importance of advanced vehicle technology, and the need to have well-educated, young engineers gearing up for this important field for the auto industry, General Motors (GM) and the Department of Energy (DOE) partnered to create collegiate Advance Vehicle Technology Competitions (AVTCs). These AVTCs started in 1988 and has been going strong for more than two decades. Figure 7 shows the progression of these AVTCs over the years.
Figure 7: AVTC History of Competitions [10]
The current AVTC is called “EcoCAR2: Plugging In to the Future.” EcoCAR2 is a three-year (2012-2014) competition. It challenges selected universities to design, build, and then refine a vehicle whose architecture must include an electric drive technology. While primarily sponsored by GM and the DOE, the program boasts a long list of sponsors who donate components, software, and their expertise to help the teams implement their designs.
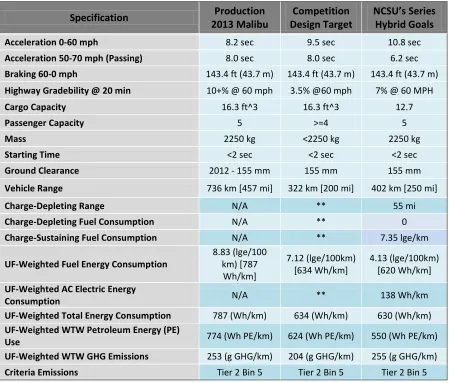
Table 1: Vehicle Technical Specifications for Stock, Competition, and NCSU’s Design Goals
Specification 2013 MalibuProduction Design TargetCompetition NCSU’s Series Hybrid Goals
Acceleration 0-60 mph 8.2 sec 9.5 sec 10.8 sec
Acceleration 50-70 mph (Passing) 8.0 sec 8.0 sec 6.2 sec
Braking 60-0 mph 143.4 ft (43.7 m) 143.4 ft (43.7 m) 143.4 ft (43.7 m) Highway Gradebility @ 20 min 10+% @ 60 mph 3.5% @60 mph 7% @ 60 MPH
Cargo Capacity 16.3 ft^3 16.3 ft^3 12.7
Passenger Capacity 5 >=4 5
Mass 2250 kg <2250 kg 2250 kg
Starting Time <2 sec <2 sec <2 sec
Ground Clearance 2012 - 155 mm 155 mm 155 mm
Vehicle Range 736 km [457 mi] 322 km [200 mi] 402 km [250 mi]
Charge-Depleting Range N/A ** 55 mi
Charge-Depleting Fuel Consumption N/A ** 0
Charge-Sustaining Fuel Consumption N/A ** 7.35 lge/km
UF-Weighted Fuel Energy Consumption 8.83 (lge/100 km) [787 Wh/km]
7.12 (lge/100km)
[634 Wh/km] 4.13 (lge/100km) [620 Wh/km] UF-Weighted AC Electric Energy
Consumption N/A ** 138 Wh/km
UF-Weighted Total Energy Consumption 787 (Wh/km) 634 (Wh/km) 630 (Wh/km) UF-Weighted WTW Petroleum Energy (PE)
Use 774 (Wh PE/km) 624 (Wh PE/km) 550 (Wh PE/km)
UF-Weighted WTW GHG Emissions 253 (g GHG/km) 204 (g GHG/km) 255 (g GHG/km)
Criteria Emissions Tier 2 Bin 5 Tier 2 Bin 5 Tier 2 Bin 5
1.5ADVISOR
2.
Architecture and Component Selection
When determining the architecture and component selection for the NCSU EcoCAR2 team’s vehicle, major emphasis was put on simulation to determine the best course of action. The results of this study are presented in this section. Available sponsor components and the team’s overall abilities were also a contributing factor in the architecture and component selection process.
2.1 Series or Parallel
A comparison was done between series and parallel architectures to determine which direction the team wanted to go. This comparison was conducted using ADVISOR. The simulation model used the same components for each architecture, where possible, to see how the performance would change between the two. Generally, a parallel architecture would not need the same size electric motor or ESS as a series hybrid due to the engine sharing some of the load. Therefore, these results were not optimized for their specific architectures, but instead were used as a general study of what the team could expect from each one in terms of performance and emissions.
Table 2: Configuration of Vehicle Parameters for ADVISOR Modeling
Components Series Parallel
Max Pwr
(kW) Peak Eff Mass (kg) #of mod V nom Description
Vehicle Veh_EcoCARII Veh_EcoCARII 1200 Chevy Malibu rolling chassis parameters converted from GM's Autonomie model Fuel Converter FC_CI60_emis FC_CI60_emis 39 0.41 137
Mercedes 1.7L diesel with validated emissions data from National Renewable Energy Laboratory
Exhaust
Aftertreat EX_CI EX_CI 12 Conventional converter for CI engine Energy Storage EcoCAR A123 LiIon EcoCAR A123 LiIon 151 7 346 A123 modules modeled from A123's experimental data Motor MC_MAGNA103 MC_MAGNA103 97 0.94 105 MAGNA E-drive motor - Data imported from Autonomie
model
Table 2 Continued
Transmission TX_1SPD_IDEAL TX_5SPD_IDEAL 1 50 Ideal 1spd or 5spd transmission - Assumes 100% efficiencies
Wheel/Axle WH_SMCAR WH_SMCAR 0 Tire, wheel and axle parameters for a "small car" Accessory ACC_CONV ACC_CONV Defines standard accessory load data for a hybrid vehicle Powertrain
Control PTC_SER PTC_PAR
Defines powertrain control parameters for the specific architecture
Total mass 1858
Forced total mass used for all simulations regardless of calculated mass based on components used
Figure 8: UDDS Drive Cycle
Figure 10: HWFET Drive Cycle
A chart of CS miles per gallon (MPG) data is shown in Figure 12. The chart shows that a series architecture is more efficient in urban driving environments, where there is a lot of starting and stopping. Parallel architectures are more efficient in highway cycles. The difference between series and parallel in the Composite drive cycle is only a few MPGs because this combines highway and city driving.
Figure 12: MPG for Series and Parallel Architectures
Acceleration and gradeability were analyzed next, as seen in Table 3. The key figures for acceleration are the 0-60 and 50-70 times. ADVISOR gives a Boolean result of whether or not the gradeability could be achieved; both architectures could in fact reach the 3.5% road grade at 60 mph for 20 minutes.
The 0-60 time for the parallel architecture is faster than the series architecture. This result is most likely due to this architecture being over-powered since both architectures are being simulated with the same components. An optimized parallel design would see this time decrease slightly.
0 10 20 30 40 50 60
UDDS US06 HWFET Composite
M
PG
Drive Cycles
Table 3: Performance between Series and Parallel
0-60 (s) 50-70 (s)
Max Accel
(ft/s^2) Distance in 5 seconds (ft) 1/4 mi (s)
Max Speed (MPH)
Gradeability 3.5% at 60mph
for 20min
Parallel 9.9 6.3 17.4 178.7 17.4 96.7 Yes
Series 11.5 5.9 8.6 108.9 18.9 97.9 Yes
Emissions data was simulated utilizing a diesel engine model that was preexisting in ADVISOR. This model included emissions data that was validated to match source data and experimental data by the National Renewable Energy Laboratory. The results of this engine run on the two architectures for the four drive cycles can be seen in Figure 13 through Figure 16.
Figure 13: Hydrocarbon Emissions
0 0.02 0.04 0.06 0.08 0.1 0.12 0.14 0.16
UDDS US06 HWFET Composite
Figure 14: Carbon Monoxide Emissions
Figure 15: Nitrogen Oxides Emissions
0 0.05 0.1 0.15 0.2 0.25 0.3 0.35 0.4
UDDS US06 HWFET Composite
CO (g ra ms /mi ) Drive Cycle Parallel Series 0 0.5 1 1.5 2 2.5
UDDS US06 HWFET Composite
Figure 16: Particulate Matter Emissions
Series architecture seems to have an advantage over parallel when it comes to HC, CO, and PM emissions, though it has higher NOx and total emissions. Figure 17 illustrates the total emissions for each cycle and architecture.
0 0.001 0.002 0.003 0.004 0.005 0.006 0.007 0.008
UDDS US06 HWFET Composite
PM
(g
ra
ms
/mi
)
Drive Cycle
Figure 17: Sum of HC, CO, NOx, and PM
Figure 18 shows the SOC of the ESS during the specific drive cycles. Each of the four drive cycles was run for a total distance of 83.5 miles to match the total distance of the EcoCAR2 Composite cycle. This was also done to ensure that each cycle would deplete the ESS to below 20% SOC. The 20% SOC ranges are shown in Table 4. These values show the series architecture has a longer range than parallel in the UDDS and a slightly longer range in HWFET. The US06 and Composite cycle ranges are nearly the same between the two.
It is important to note that for this SOC simulation, the parallel architecture’s powertrain control had to be modified to keep the engine from powering the vehicle. The focus in this simulation was to compare the EV ranges of the two architectures. This explains why the parallel architecture’s SOC curve after 20% SOC flattens out.
0 0.5 1 1.5 2 2.5 3
UDDS US06 HWFET Composite
All E
m
is
sio
ns
(g
ra
m
s/
m
i)
Drive Cycle
Figure 18: SOC for Drive Cycles vs. Time
Table 4: 20% SOC Range (miles) for Parallel and Series Architectures
UDDS US06 HWFET Composite Series 72.22 50.13 72.78 57.53
Parallel 63.06 51.64 68.65 57.51
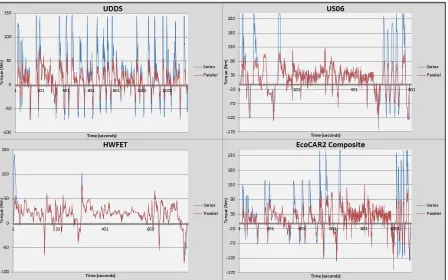
drive cycles. This is because the powertrain controller utilizes the motor during low torque instances to achieve peak fuel economy.
Figure 19: Motor Torque for Parallel and Series Architectures
2.1.1 Architecture Conclusion
The results in section 2.1 did not indicate any hard reasons to choose one architecture over the other. For the EcoCAR2 Composite drive cycle, which is the most important to the team due to competition events, both architectures were very similar in their results for total EV range, SOC and CS fuel efficiency. Parallel did have an advantage for 0-60 times, however this was due to the components being oversized for this architecture. Emissions for parallel were also slightly lower than series.
integration would be simpler. Therefore, the NCSU EcoCAR2 team decided to build a series plug-in hybrid electric vehicle.
2.2 Component Selection
2.2.1 Engine
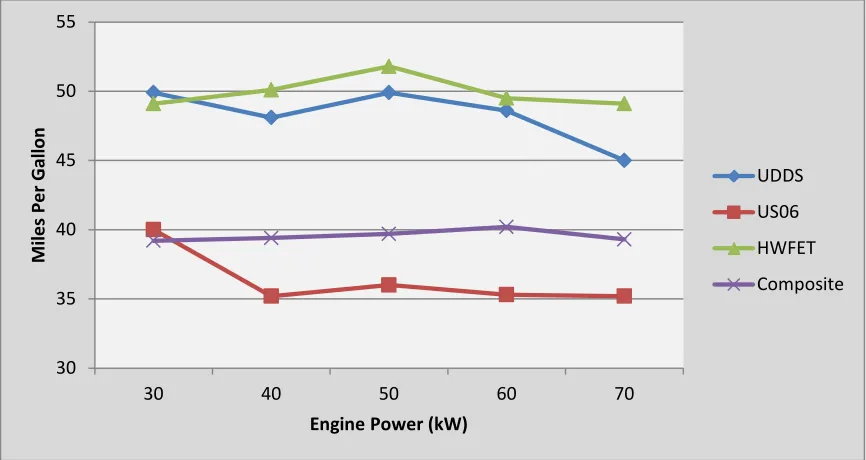
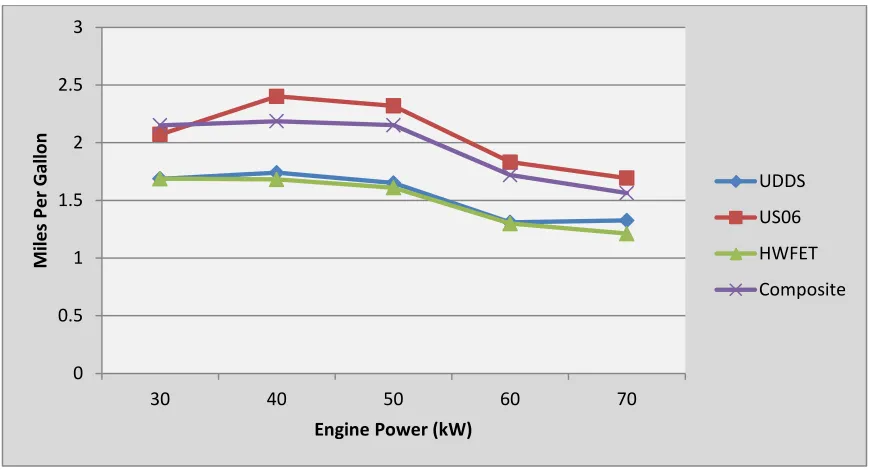
A study was run to determine how varying the power output of an engine would affect the performance of the series architecture. All variables were kept constant aside from the overall power output ability of the engine. The results, seen in Figure 20 and Figure 21, indicate the engine power would not affect the vehicle’s performance as long as it was powerful enough to maintain the vehicle in a CS mode. It was noted that at 30 kW, the vehicle would not be able to achieve the gradeability requirement of the competition.
Figure 20: Effect of Engine Size to Fuel Efficiency
30 35 40 45 50 55
30 40 50 60 70
M
ile
s
Pe
r G
allo
n
Engine Power (kW)
Figure 21: Effect of Engine Size to Emissions Output
Utilizing a 70 kW engine would net fewer emissions, but would also require more physical space in the vehicle. With space at a premium, the team decided to go with a modest 39 kW Kubota turbo diesel engine.
2.2.2 Motor
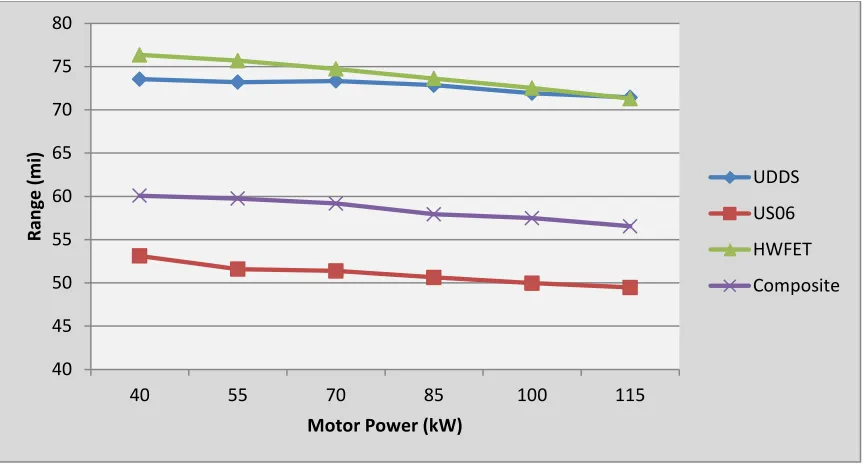
A series architecture sends all power through the motor to propel the vehicle. Therefore, this component must be sized large enough to meet competition performance requirements. Several simulations were conducted based on various motor sizes, and the results are shown in Figure 22 and Figure 23.
0 0.5 1 1.5 2 2.5 3
30 40 50 60 70
M
ile
s
Pe
r G
allo
n
Engine Power (kW)
Figure 22: Effect of Motor Size on Acceleration
Figure 23: Effect of Motor Size on Range
0 5 10 15 20 25 30 35
40 55 70 85 100 115
Ti
m
e (
sec
)
Motor Power (kW)
0-60 mph 50-70 mph 40 45 50 55 60 65 70 75 80
40 55 70 85 100 115
Ra
ng
e (
m
i)
Motor Power (kW)
The size of the motor directly impacts the acceleration performance of the vehicle, however the electric range was not influenced much by the motor size. To ensure competition requirements are met, the motor needs to be able to peak around 115 kW.
It is important to note that with an underpowered motor, the vehicle was unable to match the requested drive cycle. Figure 24 indicates a 40 kW motor would be too small to match the US06 drive cycle. The red line indicates the actual speed achieved by the simulated vehicle, and the blue line is the requested speed.
Figure 24: US06 Drive Cycle with 40 kW Motor
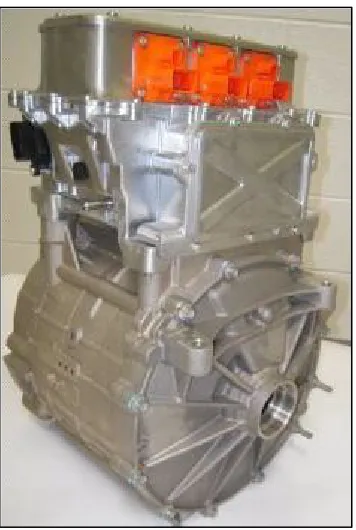
With the data from this section, and the competition requirements in mind, the team chose a Magna E-Drive motor that could peak at 103 kW. The Magna motor (Figure 25) has a continuous power rating of 45kW with a peak of 103kW at 350VDC. The voltage range of this motor is 250VDC-403VDC, which works nicely with the specifications of the battery configuration selected by the team, which will be discussed further in section 3.1.
Figure 25: Magna E-Drive
2.2.3ESS Components and Details
The module configuration the NCSU EcoCAR2 team chose is the 7x15s3p; the decision process is detailed in section 3.1. This configuration includes 7 modules, which have 15 cells in series and 3 in parallel. This nets a total of 45 cells per module and 315 total cells in the pack. The overall pack characteristics are seen in Table 5.
Table 5: A123 Module Specifications
Cells in parallel 3
Pack series cells per module 15
Modules per pack 7
Pack total cells 315
Pack Vmax 378
Pack Vnom 340
Table 5 Continued
Min pack capacity (A-Hr) 58.8 Min pack energy (kW-Hr) 18.9
Cell weight (kg) 151
2.2.3.1A123 Modules
Each A123 module is equipped with integrated Measure and Balance Board (MBB) Electronics. These boards ensure the modules are not over discharged and protect the inherently unstable Lithium Ion cells from runaway. These boards are also in charge of balancing all cells to ensure they remain within a tight tolerance of voltage from each other.
Figure 26: A123 Modules mounted in ESS battery frame
2.2.3.2A123 Current Shunt Module (CSM)
Figure 27: A123 CSM
2.2.3.3A123 Electronic Distribution Module (EDM)
Figure 28: A123 EDM with (left) and without (right) cover
2.2.3.4 A123 Battery Control Module (BCM)
The BCM is the brains of the ESS. It handles all CAN messaging and commands each subcomponent.
2.2.3.5 TYCO Manual Service Disconnect (MSD)
The MSD is used to electrically isolate the pack to approximately half the voltage. It is located between the positive terminal of module 3, and negative terminal of module 4. When removed, the total pack voltage will be cut approximately in half to isolate as much voltage as possible.
As an increased measure of safety, the MSD is also equipped with a High Voltage Interlock Loop (HVIL). This is a single wire path through many of the main components in the vehicle. If this line is ever disconnected, as it would be if the MSD were removed, the BCM immediately opens contactors to remove voltage from the HV bus. This line also runs through various sensors and E-Stop buttons throughout the vehicle.
Figure 30: TYCO MSD
2.2.4 Other Components
Table 6: Component Specification List
Component Interface Vendor Cost Performance Specifications
Generator Batt/Motor/CAN TM4 $8260 37kW Cont. 54kW Peak. 100-400V Engine Gen/CAN Kuboto Donate 39kW 119nm
Drive Motor Batt/Gen/CAN Magna Donate 45kW Cont. 103kW Peak 150nm Charger Batteries/CAN Brusa Donate 260-520V 12.5A 3.3kW Electric Brake Booster Driver EV America $390
APM Batt/Elec Sys/CAN GM Donate 300V to 12V HV-AC Compressor Driver/CAN GM Donate
Batteries Gen/Motor/CAN A123 Donate -12kW Cont. Charge, 60kW cont. Discharge Powertrain Mounts Gen/Motor/CAN NCSU
Fab/BMRS $1000 Fuel Tank and Fuel
Sys. Engine/CAN NCSU Fab $550
DPF Engine/CAN GM Donate
Belt Drive Engine/Gen Gates $500
2.3Conclusion
3.
ESS Analysis
3.1 Module Configuration Selection
The ESS is the primary source of motive energy in the series architecture, which means performance of the vehicle is largely dependent on the capability of the ESS. The team spent a lot of time analyzing the tradeoffs between a 6x15s3P (six module pack) and a 7x15s3P (seven module pack) ESS configuration. As stated in 2.2.3, the “15s” means fifteen cells in series, and “3P” means three cells in parallel. Some of the basic tradeoffs between the two module configurations are shown in Table 7.
Table 7: ESS Sizing Comparison
6x15s3P 7x15s3P
Less Complex Greater Energy Storage Less Weight Higher Voltage capacity Smaller Package Lower Heat Rejection Density
In order to more fully understand the impacts, a series of emissions and energy consumption E&EC performance simulations for the two options were evaluated to determine the possible performance gains. A 7 module ESS has greater performance potential due to higher voltages, power and energy. This potential, however, needed to translate into a quantifiable increase in vehicle performance to justify the additional complexity of the installation. With the resource challenges that face the NCSU team, adding complexity to the vehicle could not be justified without significant performance gains.
3.1.1ADVISOR Modeling
and total weight, since adding a 7th module would add several more pounds. To see where accuracies may greatly affect the result of this study, a sensitivity study was conducted. The results of this analysis are given in section 4.
The team used the ADVISOR model to compare the performance of the Malibu with a 6 module ESS to a 7 module ESS. The comparison evaluated the two ESS configurations based on the following criteria:
• Range and Utility Factor • Energy Consumption • Green House Gas Emissions • Heat Rejection
The results of this study are presented in Table 8 through Table 10. The cycles chosen were the ones that the EcoCAR2 competition will use during the E&EC event. This event will measure emissions during a drive cycle and calculate total energy consumption based on competition rules and guidelines. A majority of the points for final competition are earned in this event.
Table 8: Charge Depleting Range
CD Range (miles)
Weighting 6 Mod 7 Mod %
Cycle Factor Range Range Change
505 29% 55.29 65.2 17.9%
US06 City 14% 32.69 38.71 18.4%
HWFET 12% 48.46 57.14 17.9%
US06 Hwy 45% 59.17 68.63 16.0%
Weighted Range 53.05 62.07 17.0%
Table 9: Weighted Energy Consumption
Energy Consumption
WT 6 Mod 7 Mod
Factor W-h/mi
(CD) W-h/mi (CS) W-h/mi (CD) W-h/mi (CS) Change%
505 0.29 235 959.46 235 936.94
US06 City 0.14 409 1578.31 394 1337.10
HWFET 0.12 303 957.35 302 957.35
US06 Hwy 0.45 221 795.75 220 797.27
Cycle Weighted 261.2 972.2 258.6 932.6
Utility Factor
Weighted 470.8 426.7 -10.3%
Overall Equivalent
mpg 71.58* 78.98* 9.4%
*Units are Miles Per Gallon
Table 10: Greenhouse Gas Emissions and Petroleum Energy Use
Greenhouse Gas Emissions
6 Mod 7 Mod %
Change
WTW Greenhouse Gas Emissions(g
GHG/mi) 449.3 436.1 -2.9%
Petroleum Energy Use (Wh PE/mi) 845.0 810.8 -4.0%
Figure 32: Module Temperature Change During the EcoCAR2 Composite Drive Cycle
3.1.2 Conclusion of Configuration Selection
Many factors led to the decision of how many modules the team would choose. A major factor considered was the total voltage of the pack. With a higher nominal pack voltage, the team can pull more power from the Magna motor. The peak output of the Magna motor (103kW) is only achievable if it receives 350V. The 6 module configuration has a peak voltage of only 324V, and a nominal of 292V. The 6X15s3p configuration would not allow the Magna to reach its full potential. This would result in a failure to meet other competition performance goals.
Choosing the 7 module configuration would net a lower pack temperature during drive cycles, which would be very important due to the passive cooling design. Without an active cooling system, the less heat generated during a drive cycle, the better the modules will perform.
A 7 module ESS would have a 17% greater EV range, and a 6.4% greater Utility Factor. Weighted energy consumption was reduced by 10.3% and greenhouse gas emissions were reduced by 2.9%. While criteria emissions were not part of the simulation, it is logical to
20 22 24 26 28 30 32 34
1 1001 2001 3001 4001 5001 6001 7001
conclude that a reduction in criteria emissions will correlate to a reduction in petroleum use. 30% of the total score for final competition will be E&EC; therefore, all simulations considered, the team felt the additional module would be justified and chose the 7X15s3p configuration.
3.2Electrical
The NCSU EcoCAR2 team designed both the low-voltage (LV) wiring scheme shown in Figure 33 and the HV-wiring scheme shown in Figure 34. As a safety feature, LV schematic has the HVIL sense wire running through each connector. If any connector becomes loose or is disconnected, the main contactors will be opened, containing all high voltage (HV) within the ESS.
The HV schematic has one main pack fuse that was designed to blow only if there is a short-circuit condition. This fuse came with the supplied A123 MSD. This fuse will not blow under normal or even peak operating conditions of our vehicle. Each component was designed to have its own fuse to protect its circuitry outside the ESS. These fuses were either already incorporated into the components themselves, or were given a dedicated fuse in a fuse box.
To further verify, hand calculations were done that showed a #1 AWG wire would be appropriate for the application. This calculation was based on a conservative assumption that the average amperage on the cables will be 150 amps, allowing for safety factor, and that the interior car temperature would be 28º C. Including those assumptions, the calculations showed the dissipated energy through convection would be greater than the energy generated by the resistance of the wire. This calculation uses textbook equations 1.12, and 1.21 ofRating of Electric Power Cables in Unfavorable Thermal Environmentby George Anders [11]. These calculations are shown below:
Power generated by #1 wire at 150 amps, using a resistivity of 0.4066 Ω/km:
P = I2R = 9.149 W/ft
Heat energy dissipated by #1 wire at 150 amps, using a diameter of 7.348 mm, an interior temperature of 28º C, and using the equation for a single wire lying on a surface:
P = πD(1.69/(D^.25)+.63)(ΔT) + πDεσB(ΔT4)= 9.177 W/ft
Where ε is emissivity of wire, assumed to be .7, and σB is Stefan-Boltzmann constant (5.67*10^-8).
Figure 35: ADVISOR results showing current vs. time in CD mode
3.3 Thermal
A123’s Interface Control Document (ICD) states, “For light duty cycle applications or those that have a large energy to power ratio, passive cooling may be sufficient.” One of the advantages of a 7 module ESS was the lower heat rejection compared to a 6 module ESS. The simplicity and low system weight of passive cooling were ideally suited for the NC State University team’s series hybrid. A123 reports, “The battery modules are designed to be cooled via their external skin, which is designed for cell protection and as a heat sink for each cell.” The maximum allowable temperature for the battery is 60° C.
The maximum heat generation will come from a rapid discharge from a fully charged ESS. This was simulated in Figure 36. As the vehicle operates in pure EV mode, there will be a steady increase in module heat generation. Once the CS mode is initiated the heat flux will be reduced, and the generated heat changes slope slightly. In this mode the ESS will no longer be the primary source of energy. The ADVISOR simulation was used to predict the temperature rise for the US06 highway-driving schedule, which is the most aggressive
-200 -150 -100 -50 0 50 100 150 200 250 300 350
1 14 27 40 53 66 79 92
schedule used in E&EC competition. The ADVISOR simulation incorporates look-up tables for ohmic resistance vs. temperature and SOC for a lumped capacitance prediction of ESS temperature.
Figure 37: SOC and Module Temperature vs. Time for 10 Cycles of US06HWY
3.3.1 Conclusion
Data from A123 was used as the input for the ESS tables for the ADVISOR simulation. The output of the simulation showed that despite the aggressive driving cycle the ESS gained only 6.5°C over 3600 seconds of charge-depleting (CD) driving with only passive cooling. As the ESS transitioned from CD to CS mode, the heat flux was dramatically reduced. The simulation showed that over 5500 seconds of US06 highway cycles that the temperature increase was 7.7° C with a 25° C initial temperature. The NCSU team was confident that even with the most aggressive driving cycles, passive cooling will be sufficient to keep the ESS below the 60° C limit.
3.4Physical
The overall packaging design was a box tube frame with a sealed aluminum skin. The arrangement was a staggered design to maximize surface exposure for cooling while minimizing the total volume of the pack and retaining full trunk usage. This design used the current spare tire well for four of the seven modules and the area behind the rear seat for the additional three modules. The module orientations can be seen in Figure 38. Figure 39
20 22 24 26 28 30 32 0 0.1 0.2 0.3 0.4 0.5 0.6 0.7 0.8
1 501 1001 1501 2001 2501 3001 3501
shows the frame resting in the rear of the Malibu where the spare tire well has been removed.
Figure 39: ESS in trunk of Chevy Malibu
The overall frame was a single unit constructed of steel box tubing and is designed to sit on the major frame rails of the vehicle.
3.5 Structural
Static structural finite element analysis (FEA) was conducted in ANSYS to ensure that the ESS system will meet the competition requirements of a 20g longitudinal acceleration and an 8g vertical acceleration. The 7 modules were packaged in two separate sections: a lower section, which contained four modules, and an upper section, which contained three.
Figure 40: 8g Vertical Acceleration
Figure 41: 20g Longitudinal Acceleration
The steel used had a yield of 45KSI. With a safety factor of 2.0, the max allowable yield would be:
45𝐾𝑆𝐼
The peak stress seen in the pack in either case is 22.2KSI. This analysis showed that the enclosure would provide a safe structure for the ESS.
3.6 EMI Mitigation Techniques
Electromagnetic interference is undesirable disturbances that affect electrical circuits and cause them to malfunction or degrade in performance. External sources of EMI threaten the proper operation of systems. However, some systems can also be a threat to themselves due to high-voltage components. In order to protect the NCSU ESS, all sensitive components had to be safeguarded against EMI. The NCSU team achieved this using several shielding techniques.
The ESS was protected from interference using a sealed aluminum shell, which made up the outermost structure of the pack. The shell, made up of several interlocking pieces, functioned to conduct incoming radiation, routing it around the pack, and dissipating it in the process. The junctions between the various pieces of the pack consisted of a flange that joins each pair of pieces with an EMI-resistant gasket. The ideal gasket surface is conductive, galvanic-compatible, and recessed to completely house the gasket. This is what the NCSU team strived to design. The gaskets were tightly sealed between the interlocks of the main pieces of the enclosure, providing a continuous EMI barrier around the enclosure. A smaller enclosure, similar in construct, contained the battery control module. The main purpose of this enclosure was to protect the integrity of the data contained in the controller and its many communication lines during operation, ensuring the ESS continued to function as intended by the vehicle’s controls system.
Low-voltage wiring was shielded from EMI as well. The important communication wires were housed in a shielded twisted pair cable, which ran the entire length of the wire. Where the wires terminated at connectors, the shielding of one was attached to the shielding of the next cable to ensure the entire harness was protected end to end.
3.7 Protection
In order to design an ESS that was reliable, the NC State University EcoCar2 team had to consider the conditions it would potentially face in real world operation. Conditions are caused by the climate the car could be driven in as well as the stress that would be placed on the car. The climate a car is driven in implements various concerns for an engineer when designing an ESS. These concerns include, but are not limited to, sand, dust, salt fog, and condensation. Furthermore, it is inevitable that the automobile will experience vibrations and even concentrated shocks caused by a wreck. It was crucial that the ESS was protected from every possible situation it might experience.
Sand was a major concern that if given the chance could cause many problems on the automobile. In order to protect the ESS from sand, the team had to design a pack that was fully encapsulated in an aluminum skin where every entrance to the pack was sealed with sealant or grommets, except for the venting port required in the case of battery degassing. The ESS has a tray that covered the pack from road debris, which could consist of salt. In order to protect wires that were not concealed in the pack a decision was made to run them through orange conduit. U-bolt cushioned pipe clamps held the conduit. In addition to safeguarding the ESS from salt spray, the conduit also protects from other harsh conditions as well.
The team also provided protection for the ESS from dust. Dust, like salt, can be detrimental to a vehicle’s performance and reliability. In order to protect the ESS from dust, measures were taken to clean and inspect every item that was placed inside the pack. The pack venting was handled by using a one-way valve, similar to a Studor vent in household plumbing, to allow gases to escape but not allow materials in. This design protects against all foreign contaminants that the ESS may be exposed to.
Salt fog was yet another condition that our ESS needed to be able to protect itself from. Salt fog can be corrosive to steel bolts and is why any bolts or nuts that are externally exposed on the ESS were zinc-plated to prevent corrosion.
automotive-spec, watertight connectors. This ensures a weatherproof seal where wires pass into the ESS.
Based on those designs, the NCSU EcoCAR2 team believed that the ESS was well protected against any condition brought about by the weather or a collision that any vehicle is likely to be confronted with. By utilizing items such as an enclosed design and rubber gaskets or grommets, the team has minimized the likelihood that any condition will harm the driver, passengers, or the ESS itself.
3.8 Safety
Safety is absolutely critical when dealing with batteries, as short-circuit events and a thermal runaway can pose a number of serious risks. The primary means of combating these issues were to prevent them from happening through a number of key design areas.
3.8.1 Fusing, Creepage, and Clearance
The NCSU EcoCAR2 team fused the HV lines with a high-current fast-blowing fuse in order to prevent shorting the mains of the battery pack. Additionally, the team added slow-blowing fuses to the HV wiring system in order to protect each major powertrain component from surges of abnormally high current.
The team determined that, in terms of creepage and clearance issues, the ESS was a pollution of degree 3 (conductive pollution or dry nonconductive that becomes conductive due to expected condensation occurs. The ESS fit the category of products used in rugged environments and was typically exposed to pollution such as dust, grime, etc.) and of overvoltage category III, which is equipment that is intended for use in installations or parts of installations, in which lightning overvoltages need not be considered, but which are subject to particular requirements with regard to the safety and availability of the equipment and its supply systems. This includes equipment for fixed installation, such as energy storage systems, protective devices, relays, switches, and sockets. The team also assumed the working voltage of the ESS to be 400V, which was the highest voltage in which the insulation under consideration was subjected to when the equipment was operating at its rated voltage under normal use conditions.
negative HV lines were kept as far from each other as possible. This also meant that all HV and LV lines were kept a minimum of 7mm apart to ensure no interference of the LV signals.
Table 12: Standard Minimum Clearances Distances for Insulation in Primary Circuits and Between Primary and Secondary Circuits, Given in Millimeters [13]
3.9 Performance
Figure 42: Ford Focus EV with Pb acid batteries running UDDS cycle
Figure 43: Ford Focus EV with NCSU's Li-Ion battery pack running UDDS cycle
As seen in Figure 43, the lead-acid battery pack was unable to continue matching the requested drive cycle speed around the 11k second mark, which is indicated by the blue line. The actual speed achieved is indicated by the red line. Most of the chart is only red because the requested and actual speeds are equal. It is only when the pack reaches approximately 20 percent SOC that the vehicle is no longer capable of matching the drive cycle. Figure 49 shows that with the integration of NCSU’s Li-Ion battery pack, the data points continue to match throughout the chart, and the SOC is still above 30 percent at the end of the graph.
Discharging batteries past 20 percent SOC is typically not a good idea. Batteries become very non-linear in their current output, and if discharged much lower, could cause damage to the cells. Therefore, the ranges in Table 13 are taken at the 20 percent SOC point. The results clearly show the advantage of Li-Ion over lead-acid. This is due to the different charge densities. The lead-acid battery pack was 3.5+ times the weight of the Li-Ion pack. This weight difference coupled with the lower amp-hour rating of the lead-acid pack means a lower charge density resulting in lower CD range possibilities.
Table 13: Pb Acid vs. Li-Ion Range Comparison
CD Range (miles)
Cycle Pb Acid NCSU Li-Ion Change %
UDDS 54.18 73.15 29.8%
US06 40.31 56.43 33.3%
HWFET 65.63 80.21 20.0%
Similarly to section 3.1, a performance study was conducted on the number of modules. However, this time the number was expanded to see how different numbers of modules would affect various parameters. Figure 44 through Figure 46 show the results of this study.
Figure 44: Effect of Module Number to Range
Figure 45 shows how the number of modules affects the fuel efficiency. This efficiency is based on how much fuel was consumed during the 83.3-mile cycle of the EcoCAR2 Composite cycle.
Figure 45: Effect of Module Number to Fuel Efficiency for Composite Drive Cycle
0 10 20 30 40 50 60 70 80
5 6 7 8 9
Ra ng e a t 2 0% S O C (m i)
Number of Modules
0 50 100 150 200 250 300 350
5 6 7 8 9
Fu el E ffi ci en cy (m pg )
Figure 46 takes the sum of the four emissions numbers and displays them as a total number for each group of modules. Clearly only having five modules would net the most emissions due to the engine operating longer during a CS mode.
Figure 46: Effect of Module Number on Total Emissions Output
Figure 47 shows how the number of modules will affect how long the ESS would be in CD mode. This is important because the longer the vehicle can remain in CD mode, the less fuel the vehicle would consume. This in turn means less emissions and greater overall fuel economy.
0 0.2 0.4 0.6 0.8 1 1.2 1.4
5 6 7 8 9
To
ta
l E
m
issi
on
s
(g
ra
m
s/
m
i)
Figure 47: SOC vs. Time for Different Number of Modules
To elaborate on Figure 32, Figure 48 expands this graph to include 5, 8, and 9 modules. The trend is as expected and further verifies the effect of module number to overall temperature climb.
0 0.1 0.2 0.3 0.4 0.5 0.6 0.7 0.8 0.9 1
1 1001 2001 3001 4001 5001 6001 7001
SO
C (
%
)
Time (seconds)
Figure 48: Module Temperature Rise during EcoCAR2 Composite Drive Cycle
3.9.1 Conclusion
As this section showed, lithium-ion battery technology is far better than lead-acid technology in terms of energy density. The only drawbacks are that it is still very expensive over the much older lead-acid technology, and also requires monitoring hardware to ensure the cells do not become damaged or reach thermal runaway.
Clearly, adding additional energy storage to the vehicle would allow further full electric ranges. This study was mostly conducted to show how much more all-electric range could be achieved with different Li-ion battery module configurations. As stated in the introduction, new technologies will be reaching the market in the next decade that should allow a five times improvement over the existing technology. If this does happen, EV vehicles will have exceptional range capabilities, and PHEVs would outdrive any existing vehicles on the road today.
20 22 24 26 28 30 32 34
1 1001 2001 3001 4001 5001 6001 7001
4.
ADVISOR Sensitivity Study
Due to experimental limitations on the A123 modules set by the competition rules and guidelines, all modeling was conducted using A123’s published experimental results. These results were PDF documents that required a best-fit approximation and extrapolation. Given this, the following sensitivity study was conducted to determine what variable(s) most affected the simulation results.
All results were obtained using the EcoCAR2 Composite drive cycle. This cycle is a mixture of drive cycles shown in Table 8, with their respected weightings. This is the cycle competition will use for their E&EC event. This cycle was shown in Figure 11.
Figure 49 takes the published amp-hour rating of the A123 battery modules and implements a ±50 percent difference. The data clearly indicates that a greater amp-hour rating would in fact lead to an increased range capability. The main focus on this chart, however, is to show the performance as this amp-hour rating decreases. As Li-Ion batteries are aged and cycled, they break down and lose some of their max amp-hour capacity. A decrease in only 10 percent yields a five-mile range degradation.
Figure 49: Range Sensitivity to Max AH Capacity
0 10 20 30 40 50 60 70 80 90
-50 -40 -30 -20 -10 0 10 20 30 40 50
20% S OC D ist an ce (m ile s)
Figure 50 shows the vehicle’s range and 0-60 times and how they are affected by increasing its weight. This is a very important chart as it shows how much performance can be gained with every 50 kg lost. This will help the NCSU team determine how much weight should be reduced in the vehicle to meet competition required performance.
Figure 50: Range and Performance Sensitivity to Vehicle Weight
Figure 51 shows the ESS module temperature at the end of the EcoCAR2 composite drive cycle against an increasing ambient temperature up to 50°C. As expected, the increased ambient temperature would cause the modules to run hotter. This simulation assumed the modules began at 20°C, as they should at the competition. The vehicle will be in a climate-controlled garage leading up to the events.
10 10.5 11 11.5 12 12.5 13 13.5 14 14.5 15 50 52 54 56 58 60 0-60 Ti m es ( se co nd s) 20% S OC D ist an ce (m ile s)
Figure 51: Module Temp Sensitivity to Ambient Temp
5.
Conclusion
ADVISOR has been extensively analyzed and validated as a suitable simulator for the automotive market. A study was done utilizing ADVISOR and an earlier version of the EcoCAR2 competition called “FutureCar.” This study evaluated the effectiveness of ADVISOR in simulating a series hybrid electric car. The conclusion showed that ADVISOR was a valuable simulation tool, though it was limited on the accuracy of the model data of each component. The study goes on to state “simulations would likely be the most accurate for pure EVs, since the transient effects of an electric drivetrain are fairly small and would not introduce errors… Series HEVs, having the next most-steady operating characteristics, appear to be nearly as accurately modeled.” [12]
By using consistent model parameters throughout the simulations, and mostly looking at the CD mode, which occurs above 20 percent SOC, the results seen in earlier sections will be accurate relative to the simulations in which they were run. This means the vehicle may not perform exactly as simulated, but it would likely see a 5-mile reduction in range as the weight increased roughly 50kg.
29 30 31 32 33 34 35 36 37 38
20 25 30 35 40 45 50
Fi na l M od ul e T emp (d eg re es C )
For the 2012-2014 EcoCAR2 competition, the NCSU EcoCAR2 team designed and
constructed a rugged battery pack that was powerful enough for sustained travel of up to roughly 60 miles on a charge. Decisions were made based on extensive simulation and analysis to determine how many modules should be used, as well as wire and fuse sizing. Other components were then selected based on the ESS voltage and power limits to ensure competition requirements could be met.
Analysis and simulation also guided the team to determine the structural and cooling design. A steel box tubing frame with structural walls and passive cooling was the result of this analysis. Though heavy, this frame was capable of withstanding forces of 8g vertical and 20g longitudinal. Weight was saved by utilizing a passive cooling design.
The project required a unique design to integrate the pack into the vehicle without
REFERENCES
1. Lohse-Busch, Henning, PHD. "Current and Future Trends in Alternative Fuel
Vehicles... A Research Persepective." Argonne National Labratory. US Department of Energy, 16 Aug. 2011. Web. 21 Feb. 2013.
2. "Statistical Abstract of the United States:." State Motor Vehicles Registration. U.S. Census Bureau, 2012. Web. 21 Feb. 2013.
3. "History of the Battery." Wikipedia. Wikimedia Foundation, 17 Mar. 2013. Web. 18 Mar. 2013. <http://en.wikipedia.org/wiki/History_of_the_ battery>.
4. "Research Progress : Next Generation Secondary Batteries." TOYOTA MOTOR CORPORATION GLOBAL WEBSITE. N.p., n.d. Web. 18 Mar. 2013.
<http://www.toyota-global.com/innovation/environmental_technology/next_generation_secondary_bat teries.html>.
5. "CleanTechnica." CleanTechnica. N.p., n.d. Web. 18 Mar. 2013.
<http://cleantechnica.com/2013/03/14/toyota-solid-state-batteries-that-leapfrog-li-ion-coming-in-2020/?utm_source=feedburner>.
6. Leader, Jessica. "Lithium-Air Battery Technology Being Developed Through Toyota BMW Collaboration." The Huffington Post. TheHuffingtonPost.com, 24 Jan. 2013. Web. 18 Mar. 2013. <http://www.huffingtonpost.com/2013/01/24/lithium-air-battery-toyota-bmw_n_2540099.html>.
7. "Technology Today." Raytheon Company:. N.p., n.d. Web. 18 Mar. 2013. <http://www.raytheon.com/technology_today/2011_i1/battery.html>.
8. NCPEV Taskforce, comp. PLUG-IN ELECTRIC VEHICLE (PEV) ROADMAP FOR NORTH CAROLINA. Rep. Vol. 1.1. N.p.: NCPEV Taskforce, 2013. Print.
9. "Hybrid Electric Vehicles in the United States." Wikipedia. Wikimedia Foundation, 03 May 2013. Web. 18 Mar. 2013.
<http://en.wikipedia.org/wiki/Hybrid_electric_vehicles_in_the_United_States>.
11.Anders, George J. Rating of Electric Power Cables in Unfavorable Thermal Environment. Hoboken, NJ: Wiley, 2005. Print.
12.Donn Senger, Randall. Validation of ADVISOR as a Simulation Tool for a Series Hybrid Electric Vehicle Using the Virginia Tech FutureCar Lumina. Thesis. Virginia Tech, 1997. Blacksburg: n.p., 1997. Print.
![Figure 1: Charge Time - EV Range on a Miles/Minute [2]](https://thumb-us.123doks.com/thumbv2/123dok_us/1328398.1165750/11.612.126.505.130.370/figure-charge-time-ev-range-miles-minute.webp)