BEXCO, Busan, Korea - August 20-25, 2017 Division IX (include assigned division number from I to X)
Equivalent Linear response of reinforced concrete structures under seismic loading
Mohamed-Bachir HOCINE1, Pierre LABBE2, Guillaume HERVE- SECOURGEON 2, and François TOUTLEMONDE3
1PhD Student, Paris-Est University, RENON (IRC-ESTP, IFSTTAR), IRC-ESTP, France. 2 Professor, Paris-Est University, RENON (IRC-ESTP, IFSTTAR), IRC-ESTP, France.
3 Chief Scientist, Ph. D., Res. Dir., Paris-Est University, RENON (IRC-ESTP, IFSTTAR), IFSTTAR, France
ABSTRACT
A new method of equivalent linearization is presented, which aims to estimate the response of structures under seismic loads. The idea was inspired with the geotechnical engineering practice of estimating the soil response by using shear modulus degradation curves and the damping increase curves as functions of the distortion. These curves are used to update the soil characteristics. In the case of a structure, we present some methods to characterize the stiffness degradation and the damping variation as a function of a damage index D. This new method is tested on ten shear walls (T3-T12) of the SAFE experimental research program and SMART mockup, by comparing calculated displacements with experimental observations.
I. Introduction
In civil engineering a recurrent problem is posed by calculating the non-linear response of structures under strong motion inputs. For calculating this response, current engineering practices propose methods that are sometimes cumbersome to implement in terms of computation time and convergence of results. However, for limited strains, an equivalent linearization method has been established by Idriss et al. (1968) , whichtakes into accounts the non-linear soil response. The principle is based on the characterization of the shear modulus degradation and the damping increase versus the shear strain. In general, an elastic calculation is carried out to calculate the shear strain in each soil layer, which will be used subsequently to update the soil characteristics (shear modulus and damping) using the above mentioned curves. The identification of these curves is carried out by methods proposed in the literature. Pégon and Molina (1999) have worked on the analysis of results of the pseudo-dynamic test SAFE. They propose two methods to identify the variation of the damping and the frequency of shear walls, namely the spatial method and the filter model. In the first method, the damping and stiffness matrices are directly identified from the displacement, the velocity and the restoring force. The matrices obtained are then combined with the mass in order to obtain the natural frequencies. This method gives a very good estimation of frequency and damping in the case of pseudo dynamic and cyclic tests. The filter model defines the ground acceleration as an input and the relative displacement as an output. The frequencies and the damping are then obtained from the identified coefficients of the filter. This method is much more accurate in the case of dynamic tests.
In this paper, a linearization method similar to that of Idriss et al. (1968) is applied to SAFE shear walls in order to take into account the non-linear behavior of reinforced concrete in the domain of small deformations. We first define the small deformations as those which correspond to concrete cracks without soliciting the plastification of steel bars. The method is applied through the use of new curves of frequency decrease and damping variation. These curves were determined out following the method proposed in the literature (Pégon and Molina (1999)).
Two test cases are investigated. The first is based on the comparison of the proposed method outputs with those of the SAFE research program (pseudo-dynamic test single degree of freedom structures). The second test is carried out on the SMART mock-up (shaking table test of a multi degrees of freedom structure). Numerical analyses are carried out with Code_Aster.
II. Presentation of the experimental campaign SAFE
The SAFE experimental campaign comprises pseudo-dynamic tests carried out by using a reaction wall in
the ELSA laboratory of the JRC-Ispra in 1998 [Labbé et al. 2015]. Although twelve shear walls of
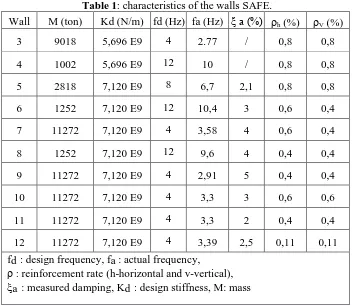
different thickness and reinforcement were tested, only 10 of them (T3-T12) are usable in practice. Their characteristics are presented in the Table 1.
Table 1: characteristics of the walls SAFE.
Wall M (ton) Kd (N/m) fd (Hz) fa (Hz) ξ a (%) h (%) V (%)
3 9018 5,696 E9 4 2.77 / 0,8 0,8
4 1002 5,696 E9 12 10 / 0,8 0,8
5 2818 7,120 E9 8 6,7 2,1 0,8 0,8
6 1252 7,120 E9 12 10,4 3 0,6 0,4
7 11272 7,120 E9 4 3,58 4 0,6 0,4
8 1252 7,120 E9 12 9,6 4 0,4 0,4
9 11272 7,120 E9 4 2,91 5 0,4 0,4
10 11272 7,120 E9 4 3,3 3 0,6 0,6
11 11272 7,120 E9 4 3,3 2 0,4 0,4
12 11272 7,120 E9 4 3,39 2,5 0,11 0,11
fd : design frequency, fa : actual frequency,
: reinforcement rate (h-horizontal and v-vertical),
a : measured damping, Kd : design stiffness, M: mass
Figure 1 : shear wall T5, (Dimension in millimetres), (a) view in elevation, (b) top view
Figure 2 : picture of shear wall T5
Figure 3: loading device of shear walls SAFE. [Labbé et al. (2015)]
III.Identification of Equivalent Frequency and damping
We find in the literature several methods which allow the identification of the frequency decrease of the shear wall and the variation of the damping. In this work, we use the spatial method proposed by Pégon and Molina (1999), which allows us to describe the evolution of the frequency and the damping variation during loading. These evolutions are obtained from the results of the pseudo dynamic test by using the displacement, the experimental velocity and the restoring force. The restoring force measured during the pseudo-dynamic test is assumed to be related to the displacement and the velocity by the following formula
(1)
Where K and C are the stiffness and the damping matrices, respectively. More precisely, the expression
(1) can be formulated as
(2)
r(𝑡) : restoring force, d(𝑡) : relative displacement, v(𝑡) : relative velocity, o: residual.
The identification of the matrix K and C is based on the resolution of the system (2). In our case, the resolution of the system is done with the least squares method by using sliding time windows of n size (n: represents the number of the taken time steps). The aim of this approach is to estimate an instantaneous value of stiffness and damping in order to associate it with the maximum drift observed on this time window.
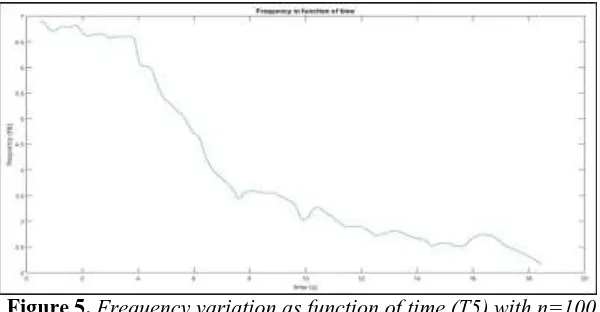
For the determination of the frequency variation, the size of the sliding window selected is equal to 100. For damping, this approach did not allow us to have exploitable results. Therefore, we have chosen a window of time equal to the duration of the loading. This gives us an average damping value that will be associated with the maximum observed drift.
Figure 5. Frequency variation as function of time (T5) with n=100.
(3) (4)
: Frequency at time (t), : design frequency, : Ultimate frequency,
X: max of displacement at the top of shear wall, H: height of wall (1.2m for shear walls SAFE)
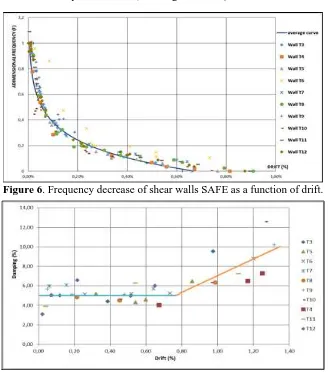
Figure 6. Frequency decrease of shear walls SAFE as a function of drift.
Figure 7. Damping variation of shear walls SAFE as a function of drift.
The updating of the structure characteristics during the iterative process is carried out using an average curve passing through the dots in figures. (6) and (7). The average curves are expressed by the following formulas:
- For the variation of F as function of D (drift) :
(5)
- - For the damping:
ξ = 5% for D < 0.78% (6)
ξ = 8,51D -1.46 for D > 0.78% (7)
IV.1. Principle of the equivalent linearization method
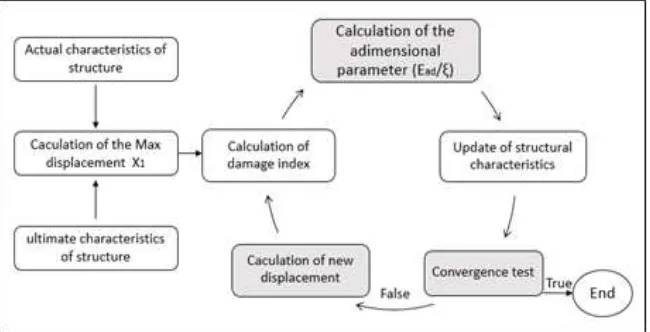
The equivalent linearization method, tested on SAFE walls, is based on an iterative calculation which takes into account the non-linear behavior by updating the structure characteristic values (Frequency/Young modulus and damping) as a function of the experienced damage. At each iteration the maximum displacement at the top of the shear wall is calculated by the spectral method. (the maximum displacement is regarded as the best damage indicator.) This displacement is used to calculate damage index (Drift) as the maximum displacement divided by the height of the wall.
The updating process is fed by the characteristics of structure in the initial and ultimate state:
- Initial state: we use the elastic actual characteristics (measured) to calculate the first displacement
by the spectral method.
- Ultimate state: we consider that the ultimate frequency is equal to one third of the initial frequency. All the parameters are used with the maximum displacement for the calculation of the damage index, and to evaluate the new value of the frequency and to estimate a new displacement.
Figure 8.The iterative process of the equivalent linearization method.
IV.2. Implementation of the equivalent linearization method
The proposed method is applied on structures by using Code_Aster. The software allows us only to update the Young's modulus of the structures. We deduce the degradation curve of the Young's modulus (Fig.6) from the degradation curve of the frequency by using the formula 8. We then apply the method on ten SAFE shear walls and the SMART mockup.
(8)
( ) (8)
E: Young modulus, Ead: adimensional Young modulus, Ei: initial Young modulus, Er: ultimate Young
We present in this work the results obtained for the wall T3 (Run1). The results of the other walls are presented in the table 6showing that the method gives a good estimation of displacement for all the SAFE shear walls.
Table 4. Results of shear wall T3
iteration D Ead LE Disp EXP Disp
1 6,34E-04 1,75E+10 7,39E-04
1,43E-03
2 1,09E-03 7,45E+09 1,23E-03
3 1,22E-03 6,11E+09 1,36E-03
4 1,26E-03 5,75E+09 1,40E-03
5 1,28E-03 5,62E+09 1,42E-03
6 1,29E-03 5,58E+09 1,43E-03
7 1,29E-03 5,56E+09 1,43E-03
D : damage index,
LE Disp: linear equivalent displacement EXP Disp: experimental displacement
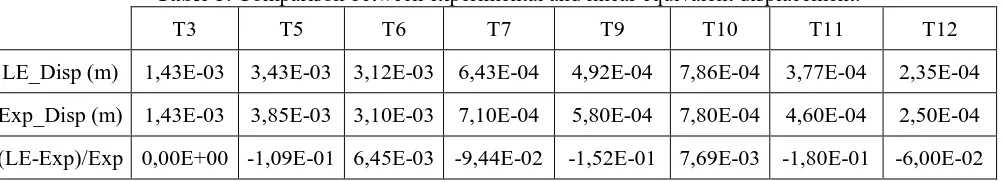
Table 5. Comparison between experimental and linear equivalent displacement.
T3 T5 T6 T7 T9 T10 T11 T12
LE_Disp (m) 1,43E-03 3,43E-03 3,12E-03 6,43E-04 4,92E-04 7,86E-04 3,77E-04 2,35E-04
Exp_Disp (m) 1,43E-03 3,85E-03 3,10E-03 7,10E-04 5,80E-04 7,80E-04 4,60E-04 2,50E-04
(LE-Exp)/Exp 0,00E+00 -1,09E-01 6,45E-03 -9,44E-02 -1,52E-01 7,69E-03 -1,80E-01 -6,00E-02
IV.3. Application on SMART mockup
IV.3.1. SMART mockup
SMART (Seismic design and best-estimate Methods Assessment for Reinforced concrete buildings
subjected to Torsion and non-linear effects).
A reinforced concrete mockup, which represents a part of a nuclear building, was made and tested on the shaking table AZALEE(CEA Saclay) [SMART 2013. Test report]. The structure was subjected to a series of seismic loading (runs). The figure Fig 9 present the displacement (input) applied at the base of the structure in run 009. A first test on the SMART mockup (run 007) is carried out before run 009 using an
accelerogram which corresponds to 50% of the nominal level.The table 6 presents the characteristics of
the accelerograms of the first two tests (run007 and run 009).
Table.6: Accelerograms characteristics
Test Signal characteristics
RUN 007 Test n°1 : 50% of nominal level
Pga x : 0.13g. Pga y : 0.14g
RUN 009 Test n°2 : 100% of nominal level
Pga x : 0.22g. Pga y : 0.23g
Figure.9: The input displacement for run009 (x direction)
IV.3.2.Nonlinear dynamic analysis:
Before the application of the linearization equivalent method on the mockup, several nonlinear dynamic calculations are performed to simulate the experiment. The numerical model used for mockup is presented by the figures (10 and 11). The calculation is carried out with Code_Aster by applying a signal in the 3 directions at the base of the foundation.
Figure.10: top view of SMART mockup Figure.11: geometry of the mockup
The finite element model used in this analysis is realized with the software Salome_Meca. It contains 941 Nodes. We used plate elements for the modeling of floors and walls, elements beam for posts and beams and 3D element for foundations.
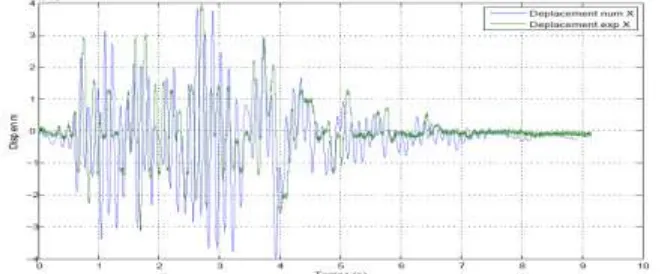
the x direction is plotted in the figure 12 as well as the output of time-history analysis. A reasonably good match is achieved.
Figure.12: comparison between experimental and numerical displacement (X direction)
IV.3.3. Linear equivalent analysis:
The maximum of displacement obtained with numerical computation and experimental test are compared to the displacement given by the proposed method tested on SMART mockup (figure 13 and 14). We define structural element as an element limited by two walls and two floors (in our case we have 9 structural elements). The results are presented and compared in the figures 13 and 14 and table 7. A reasonably good match is achieved again.
Figure 13. comparison in the direction X Figure 14. comparison in the direction Y
Table.7 numerical and linear equivalent results.
X Displacement (mm) Y Displacement (mm) Linear equivalent
calculation (LE) 5.3mm 2.2mm
Numerical computation 1
(Num) 5.4mm 1.9mm
Numerical computation ² 4.0mm 1.8mm
Experimental displacement
(EXP) 4.0mm 1.8mm
V. Conclusion
The use of the spatial method allowed us to describe the variation of frequency and damping of shear walls as function of a damage index (drift). The frequency degradation and damping increase curves were exploited in the proposed linear equivalent method. For simple cases (SAFE campaign), a good estimation of the displacement at the top of the shear walls in the non-linear behavior domain is obtained with a very modest calculation cost (some iterations with an elastic model).
Application of the method proposed on the SMART mockup showed its performance and proves its rapidity. We obtain a good estimation of the displacements.
VI.REFERENCES
Brun M., Labbé P., Bertrand D., Courtois A., « Pseudo-dynamic tests on low-rise shear walls and simplified model based on the structural frequency drift », Engineering Structures 2011 (33) pp. 796-812
Brun M., thèse de doctorat, Contribution à l’étude des effets endommageants des séismes proches et lointains sur des voiles en béton armé, INSA de Lyon 2002
Brun M., Reynouard JM., Jezequel L., « A Simple shear wall model taking into account stiffness degradation ». Eng Struct 2003;25(1):1–9.
Idriss I M., Seed H B., (1968), « Seismic response of soil deposits », J. Soil Mech. & Found Div., ASCE, vol 96,
Labbé P.B., « Categorization of seismically-induced stresses for civil and mechanical engineering». Nuclear Engineering and Design 255 (2013) 240– 247
Labbé P., Pégon P., Molina J., Gallois C., Chauvel D., «The SAFE Experimental Research on the Frequency Dependence of Shear Wall Seismic Design Margins». Journal of Earthquake Engineering, 2015
Molina F.J, Pégon P., Verzeletti G., « Time-domain identification from seismic pseudo-dynamic test results on civil engineering specimens », Proceeding 2° Int. Conf. On Identification in Engineering Systems, 1999
Pégon P., Molina J, Identification of the damping properties of the walls of the SAFE program. JRC technical note no I.98.35; 1998.
![Figure 3: loading device of shear walls SAFE. [Labbé et al. (2015)]](https://thumb-us.123doks.com/thumbv2/123dok_us/1413263.1173890/3.612.110.498.292.640/figure-loading-device-shear-walls-safe-labbe-et.webp)