Development of an Analytical Model for Local Hydrogen Behavior Analysis in NPP
Containment
Un-Jang Lee l), Yong-seog Choi l) and Goon-Cherl Park 2)
1) Graduate Student, Department of Nuclear Engineering, Seoul National University, Seoul, Korea 2) Professor, Department of Nuclear Engineering, Seoul National University, Seoul, Korea
A B S T R A C T
Hydrogen control during severe accidents has been required by nuclear regulations after TMI accident to ensure the integrity of containment. Up to now many experimental and analytical studies have been conducted to predict hydrogen behavior on the purpose of preventing hydrogen explosion in nuclear power plant. In this study a three-dimensional and time-dependent code, HYCA3D, was developed to calculate the local hydrogen distribution with simulating the transport of multiple species in a subcompartment of NPP containment. Large density variations due to thermal and species concentration gradients are accounted for with excluding the restrictions of the classical Boussinesq approximation. The developed code has been validated by analyzing experiments that have been performed in SNU multi-subcompartment mixing facility. In the experiments hydrogen was simulated by Helium and the local He concentration was measured in various conditions including the condensation, followed by pre-tests with EPRI/HEDL standard problems. The calculation results show good agreement with experimental data.
I N T O D U C T I O N
After the TMI-2 accident in 1979, the prevention and mitigation of severe accidents have become a critical issue to ensure the ultimate safety of nuclear power plants. Following severe accidents in NPP containments substantial amounts of hydrogen, which is generated by metal-water reaction during the core-uncover as well as by virtue of core-concrete interactions after vessel lower head failure, may be mixed with steam and transported invariably into the compartments in the containment building. The mixture including hydrogen has a potential to threaten the integrity by over-pressurizing the containment from global burning or explosion. Moreover, even local hydrogen burning, which cannot be a threat to global containment integrity, may also be hazard to the survivability of safety-related equipment. Hence, regulations for hydrogen control have been established on the basis of the local hydrogen concentration in the NPP containment of Korea as well as in USNRC [ 1]. However, most previous analytical and experimental works that attempted to estimate the hydrogen concentration during the accidents have been based on the average concentrations in the compartment. The licenses from the authorities concerned have also been issued from the estimation by lumped parameter models such as MAAP, CONTAIN or GOTHIC. Such models have been verified with the experimental data of representative concentration in the compartment having the large volume in a large-scaled facility such as HEDL, NUPEC and so on. Recently, the analytical calculation for local hydrogen distribution in the containment has been attempted using three- dimensional codes such as GASFLOW or GOTHIC-3D. However, the results are still not fully accepted due to the lack of local data for the compartment. Thus, in this study, a three-dimensional gas dynamics code named HYCA3D has been developed to calculate the local distribution of hydrogen during the transport in a compartment. Also local concentrations of hydrogen simulated by helium have been measured in the mixing test facility established in this study to understand the mixing characteristics and to verify analytical capability of the HYCA3D code. Because in real accident situation of NPP containment serious steam condensation occurs entirely and/or locally, the condensation model was included in HYCA3D to simulate the real accident situation, and some tests with steam condensation were performed to validate prediction ability of the code for the condition. Before this test, a pre-test for the verification of the code was implemented with EPRI/HEDL standard problems.
C O D E D E V E L O P M E N T
General Description of the Model
The computer code HYCA3D has been developed in order to predict the thermodynamics and the local three- dimensional behavior of the hydrogen/steam mixture, within a subdivided containment volume following the hydrogen generation during severe accidents in nuclear power plants. This model of the full three-dimensional and time-dependent Navier-Stokes equations, which include the species transport equation, is solved by the SIMPLER algorithm. To model
, ~i~ ~ .
SMiRT 16, Washington DC, August 2001 Paper # 1331
the mixture behavior of three gases (hydrogen or helium, steam and air), a continuum model is applied, where only one velocity field is defined using the average density of the gas mixture. The independent behavior of each gas is considered in the species transport equation. For low speed flows, the pressure wave propagation need not be resolved in detail, and thus in this study the local fluid density is expressed as a function of the average fluid pressure, local temperature and relative concentrations of the available species. Moreover, this allows accurate representation of flows driven by large density variations for which the Boussinesq approximation may not provide sufficient accuracy. In consideration of the steam condensation in non-isothermal condition of a volume, a steam condensation model was added to the code. Each equation of HYCA3D is written in cylindrical coordinates to simulate the experimental geometry and to extend the calculations for local hydrogen concentration in the containment of nuclear plants. However, this code also has the capability to easily convert to plane coordinates by setting the radial distance y equal to unity.
Governing Equations
The continuity equation is
~ + V . =0
/)t " (1)
The mixture momentum conservation equations are given by
- u)
^-
p +u-V = - V p + p g + V . r _
~
)tA
where p is the local density relative to the average density defined as
~t Z P 17i
,, j i,j,k+~
Pi,j,k = Pi,j,k - ~ ]~7i t j
The mixture energy equation is
The mixture energy equation is
~gT + u . V T = V . P~, Ot
The dynamics of the individual species are determined by
o
VT +Q .
/
-
/
(opwi )+ p ri
p ~ + u . V Y i =V. at
(2)
(3)
(4)
(5)
where
Pi
r~ = - - p • (6)
The source of helium and steam are specified by the experiment; however, the condensation rate must be modeled. We
propose the simple but effective relationship, based on the assumption of local equilibrium.
{~010 / sec
For steam, (PY/) = Rc (Psa t - PYi) R c = ( P Y i ) P s a t ) i (7)
(PYi < Psat )
The equation-of-state for average fluid pressure is given by the ideal gas mixture equation
P = PRTi~=I •
(8)
Prandtl's mixing length model is used for turbulence modeling, which represents eddy viscosity as the local average
v t = I m (9)
The mixing length I m is assumed for free shear flow as,
I m = 0.098. (10)
The boundary conditions are as follows. For the velocity field, no-slip condition is taken on the walls and the diffusion term is neglected on the outflow boundary. For the temperature field, the constant temperature or the constant heat flux condition is selectable. For the concentration of each gas, it is assumed that there are no changes on the walls.
Numerical Scheme
Integrating the governing equations over the control volume shown in Fig. 1, the difference equation can be obtained as
follows:
a p O p = aEO E + a w O W + aNO N + aSO S + aTO T + aBO B + b , (11)
Where
aI=DiA(IPeil)+MAX[-Fi,O] I=E,N,T
i = e , n , t (12a)a j = D j A ( [ P e j [ ) + M A X [ F j , 0] J = W , S , B j = w , s , b (12b)
0
o p p r A O A r ~ z
a p = (12C)
At
0 0
b = ScrAOArAz + apOp (12d)
0
a p = a E + a W + a N + a S + a T + a B + a p - SprAOArAz (12e)
riAi
F t. - ( P u ) i A i, D i = ~ i = e , w , s , n , t , b (12f)
Pe = F / D . ( 1 2 g )
The term
A(IPel)
of Eqs. (12a) and (12b) varies with the scheme used for calculating the convection term. In thisstudy the power-law scheme [2], which shows the excellent characteristics of high accuracy and calculation speed, is
I U
used to yield:
A ( I P e I ) = M A X I O , (1 - 0.1[Pel)5 ] • (13)
To settle problems caused by the first differential term (the convective term and the pressure gradient term), the staggered grid is adopted in HYCA3D. Thus, the velocity is calculated on the surface of the control volume and other variables are determined at the grid points.
Detailed procedures of calculation are as follows.
a. Start with a given initial condition or proper prediction for the velocity field. b. Calculate the coefficients for the momentum equations and hence calculate ~i from
i ~ anbunb + b
a i
Where the subscript
nb
represents a point adjacent to grid point i. [qc. Calculate the pressure field from u~.
d. Solve the momentum equation by adding the determined pressure to the source term. e. Correct the velocity field but do not correct the pressure.
f. Solve the discretization equations for other variables if necessary. g. Return to step b and repeat until convergence.
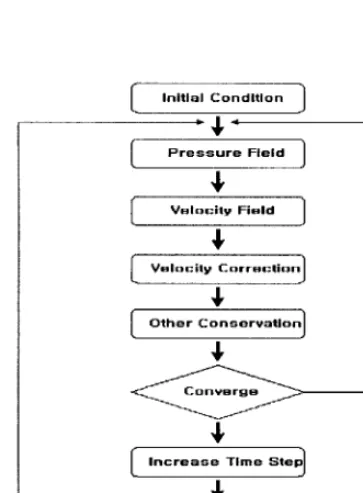
The above algorithm is referred to as the SIMPLER (Semi-Implicit Method for Pressure-Linked Equation Revised) algorithm developed by Patankar [2]. Fig. 1 shows the flow chart of this algorithm.
V A L I D A T I O N O F T H E C O D E
The hydrogen mixing tests of HEDL had been implemented with simulating the representative events in which hydrogen is injected at higher rates than slowly core degraded events. Thus, HEDL experiments were adopted to verify the analytical model of the three-dimensional computer code, HYCA3D, which has been developed in this study. Also, SNU (Seoul National University) mixing tests were considered for the verification of the code. These are the experiments for the investigation of local distributions and three-dimensional behavior of the hydrogen mixture in subcompartments of the real NPP containment.
HEDL Hydrogen Mixing Test, HM-6
Test HM-6 among the HEDL hydrogen mixing tests [5, 6] simulates the failure of a vertical 10-in-diameter rupture disk in the reference plant. Since the test is a well-known experiment evaluating hydrogen concentration in the annulus compartment, even though lumped representative concentration, it was selected to assess the ability of HYCA3D to predict the transport of non-condensing gases, prior to the comparison with the local tests in this study.
Fig. 3 shows plane and vertical views of the computational grid. The plane view shows a 10x15 grid2.36m < z < 2.76m in cylindrical coordinates where each section is divided in equi-angle and equi-width, and has axially 12 divisions. Blower and vent system that provide the air recirculation from the upper to the lower regions are simulated as shown in Fig. 3.
Four recirculation blowers are located on the outer circumference in the azimuthal positions of 30, 90, 210 and 270 degrees, and at the axial position of 2.36m < z < 2.76m. Eight outflow vents are distributed around the outer wall of the test compartment. The arrow symbol in Fig. 3 represents the injection points of the helium and steam mixture. The injection nozzle is located 170 degrees from one radial wall at 1.52 m above the lower deck. The sequences of all transient events were referenced from the reference [5, 6].
SNU Hydrogen Mixing Tests
Up to now, many experiments for hydrogen management have been conducted around the world to investigate the hydrogen behavior in the containment and to provide data for the verification of existing computer codes; VICTORIA experiments in Finland [3, 4], HEDL (Hanford Engineering Development Laboratory) experiments [5, 6] in USA, HDR experiments at Battelle-Frankfurt [7, 8], NUPEC tests in Japan [9, 10]. Most of those experiments introduced above were conducted for the inter-compartment analysis of hydrogen concentration distribution for the global flow of hydrogen in a large-scaled multi-compartment containment building. The key matters of concern for the experiments were containment- wide natural circulation, stratification in some compartments, effective mixing by the spray systems or diffusion fans, and the effects of the hydrogen Control system, etc. The results obtained from such experiments provided important data to confirm lumped analysis codes, such as MAAP, CONTAIN, MELCOR and GOTHIC, which have been widely used for plant analysis. However, such lumped analyses have a limit to meet the requirement of 10CFR50.44(f), which sets the local hydrogen limit to 10%, to ensure equipment survivability and to determine the exact positions of the control measures, such as ignitor [11] or PAR [12]. In particular, if obstacles exist in the way of hydrogen behavior in a compartment which hydrogen diffuses through, they may cause a remarkable gradient of hydrogen concentration in the compartment. And the accumulated hydrogen itself may be hazard to flame flow path in the severe accident. Hence, in this study, local concentrations of hydrogen simulated by helium have been measured in the mixing test facility to understand the local mixing and/or steam condensation characteristics in various conditions, and to verify the HYCA3D, which has been developed in this study, or other 3-D codes.
Comparisons with Experimental Results from HELD and SNU tests
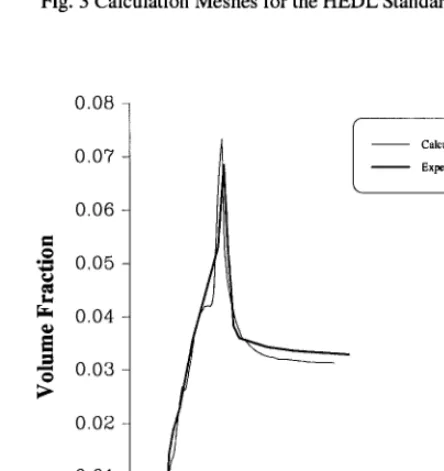
The comparison between the predicted and measured helium concentrations for Test HM-6 of HEDL is shown in Fig. 4. Helium concentrations predicted by HYCA3D slightly exceed the experimental data. There is a difference of 0.5 percent between the predicted and measured helium concentrations. However, this is not significant because the calculation result is the value of a specific point in the test compartment, whereas the experimental data is the local average value• From this point of view, the prediction of HYCA3D is very consistent with the measured data both in shape and magnitude. In spite of the simple turbulence simulation the calculation result is agreeable to the experimental result. Thus it is assumed that Prandtl's mixing length model is sufficient to simulate the behavior of the gas mixture.
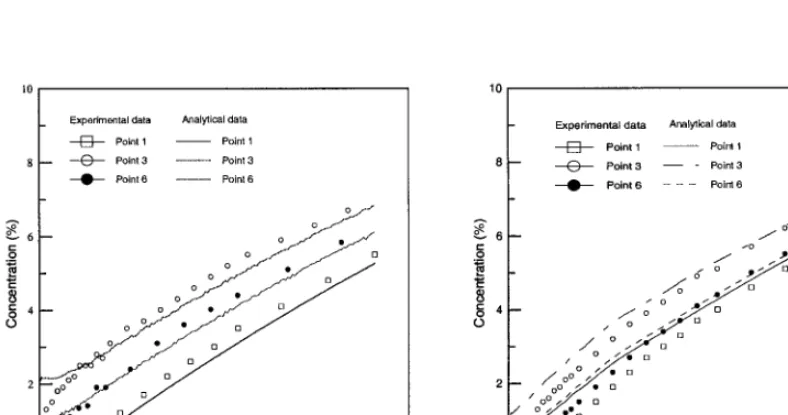
The prediction capability of the HYCA3D code, which includes the steam condensation model, was examined by analyzing the results of SNU Hydrogen Mixing and Distribution (HMD) tests in this study. According to the objective of code verification, the reference mixing tests R2 and R3 with the different initial conditions (i.e. with steam condensation and without steam condensation) was evaluated in this article.
Fig. 6(a) and 6(b) compare the predicted and measured helium concentrations for these two tests and show that the prediction of HYCA3D is very consistent with the measured data both in shape and in magnitude.
C O N C L U S I O N
For hydrogen management in severe accidents with a degraded nuclear core of PWR's, several experiments and three-dimensional simulations have been performed in the SNU hydrogen mixing facility•
A new computer code named HYCA3D has been developed, which can predict the transient behavior of the hydrogen concentration in any subcompartment of a containment building. In the above two cases (with and without the steam condensation), the HYCA3D code shows good agreement with SNU experimental data and the extensive verification programs. In this study, local He distribution is estimated without the engineering feature such as spray or fan. But in the severe accident those engineering system will be operated, and the effect of the feature should be included in HYCA3D to simulate the hydrogen behavior inside the containment in the real accident. The detailed effect of the spray or fan on He concentration will be studied in future works after conducting experiments with the system. Equipped with the detailed modeling of spray or fan, the three-dimensional computer code HYCA3D will be very useful for the analysis of the hydrogen distribution in nuclear power plants.
Nomenclature
p " average density p • pressure
g" gravitational acceleration vector T" mixture temperature
c • specific heat at constant pressure p
P S A T " saturation density of steam at a given temperature
D" mass diffusion coefficient
M i molecular mass of gas
u" mass-average velocity vector
~" local density relative to average density
~'" viscous stress tensor
m
K" thermal conductivity
Q" energy source and/or sink per unit volume and time
R" universal gas constant
S" the length causing local velocity variation
Reference
1. NRC Action Plan Developed as a Result of the TMI Accident, NUREG-0660, USNRC, May, 1980 2. Suhas V. Patankar, Numerical Heat Transfer and Fluid Flow, McGRAW-HILL Book Company, 1980
3. Hongito O.& Tuomisto H. Experimental verification of the Loviisa Ice Condenser Containment Transient Operation in Reactor Accident. ANS International Topical Meeting on Safety of Thermal Reactor, Portland, Oregon, July 21-25,
1991.
4. Lundstr m, P., Toumisto H., Lamberg T., and Hongisto O. Experimental Studies of the Hydrogen Behavior in Ice Condenser Containments. Proceedings of OECD workshop on the Implementation of Hydrogen Mitigation Technique, Winnipeg, Canada, May. 12-16, 1996.
6. S. E Hall and J. Mackenzie. Hydrogen Phenomena in PWR Degraded Core Accidents. SRD R 271- Safety and Reliability Directorate. United Kingdom Atomic Energy Authority Wigshaw Lane, Culcheth Warrington, September,
1982
7. VALENCIA L. WOLF L. 1990 - Large-Scale HDR- Hydrogen Mixing Experiments Test Group E 11. Proceedings 18th Water Reactor Safety Information Meeting, Rockville, MD, USA, October 22-24, 1990
8. Wolf. L, Valencia. L. Results of the Preliminary Hydrogen Distribution Experiment at HDR and Future Experiments for Phase III, 16th Water Reactor Safety Information Meeting, Galthersburg, MD, NUREG/CP. USA, Oct. 1988 9. NUCLEAR POWER ENGINEERING CORPORATION (NUPEC). 1993 -Specification of ISP-35 NUPEC's
Hydrogen Mixing and Distribution Test- Test M-7-1. NUPEC Systems Safety Department, ISP35-027 Rev, 1, 1993 10. K. Takumi, T. Yamada Overview of Containment Integrity Test at NUPEC. The 4th International Topical Meeting on
Nuclear Thermal Hydraulics, Operations and Safety, Taipei, Taiwan, April 6 -8, 1994
11. Lundstrum P., Routamo T., Tuomilsto H. & Theofanous T.G "Hydrogen Behavior in Ice Condenser Containments", Proceedings of the 7th International Meeting on Nuclear Reactor Thermal-Hydraulics NURETH-7, Saratoga Springs, New York, September 10 15, 1995
12. Karsten Fisher. Qualification of a Passive Catalytic Module For Hydrogen Mitigation. Nuclear Reactor Safety on Nuclear Technology VOL.112. OCT. 1995.
Table 1. Test condition for Test R
Test condition Test R1 Test R2 Test R3
Helium (g min -1) 0.4 0.4 0.4
Steam (g min l) 0 8 8
Mixture injection ( 1 min -~) 0.87 17.4 17.4
Mixture injection velocity (m s -~) 0.17 0.56 0.56
Steam condensation No No Yes
-- ,I, "
I
Initial Condition 1
I
Pressure Field }
I
Velocity Field
]
I Velocity Correction]
l Other Conservation 1
$
$
i
I n c r e a s e Time Step 1$
I
S T O P1
r - @ p t e n e
k.,)
±,
b (,,
S
r - z p[o, n e
Fig. 1 Calculation flow chart Fig. 2 Calculation control volume and grid points
T T f T F T T F F P ~
- - ¢ > Venting Region
Blowing Region
~ Source Flow
Fig. 3 Calculation Meshes for the H E D L Standard Case
@
E
0 0.08
0.07
0.06
0.05 -
0 . 0 4 -
0 . 0 3 -
0 . 0 2 -
0 . 0 1 -
I
Calculation
Experiment
1
0 . 0 0 , , i ~ l ,
0 i0 2 0 3 0 4 0 5 0 6 0 7 0
Time(min)
He Gas
o
--R
Z
O #t #
/ .
t
M i x ± u r ~ n j e c t i o n
M i x e r L i n e s
Sempkin 9 L i n e s
; ~ S e m p t i n 9
e l Pump
ExcLusion
F i L t e r ~ 1 II
He Anc~tyzer
<---, ~ T/C P r o b e
4___
M i x ± u r e Smmptin 9 Lines
,'#
Point 3
,V
%2
/
o;/
~
Poi|
Fig. 5 Schematic diagram of the SNU Mixing Facility and He detection points
10 10
Experimental d a t a Analytical data
[ ] Point 1 ~ Point 1
8 b 0 Point 3 - - ~ Point 3
L - - - 0 - - Point 6 ~ Point 6
~4 - / ' J
o .,~.~_..,.
~
o
o
o,
°
o
o j ~ , ~
o
°
E 6 o • 6
o • ~
g 4 o g 4
o • i-1
2 2
0 - ~ , I , , , , I, , , , I , , , , I , , , , I , , , , I , , o
0 500 1000 1500 2000 2500 3000
Time (see)
(a) T e s t R 2
- Experimental data Analytical data
Point 1 Point t
8 i 0 Point 3 Point 3
Point 6 Point 6 o
- /
/ o / n
/ o o / 1 ~ - / / rl
^ o ° / ~ / / e B
r- foO~/;/. .
/ "oO-M', o
I1' o y e e u
" , , , I , , , , I , , , , I . . . . I , , , , I . . . . I , ,
0 500 1000 1500 2000 2500 3000
Time (sec)
(b) T e s t R 3