ABASTRACT
WANG, XIAOYANG. Development of a Computationally Efficient Finite Element Model of the Human Spine for the Purpose of Conducting Parametric Studies of the Stresses Induced in the Spine and in Spinal Fusion Instrumentation Hardware during Flexion, Torsion and Extension. (Under the direction of Andre Mazzoleni.)
various parameters. These results have the potential to provide surgeons with guidance as to when to implant an interbody spacer to reduce the risk of rod breakage.
Some disadvantages of an anterior surgical approach (necessary to implant an ALIF spacer) have been noticed, such as vascular injury. Therefore, the possibility of implanting an interbody device posteriorly with similar function to the ALIF (e.g. a TLIF) may be an option to prevent those disadvantages. The results show that a TLIF can yield similar results to an ALIF, in terms of reducing rod stress, when it is placed as anteriorly as possible in between the vertebrae. Parametric studies of novel posterior connector structures are performed to examine their impact on reducing rod stress, and the results show that adding a truss-type structure to the instrumentation can help to reduce the stresses induced in the fusion rods, particularly under torsional loading.
© Copyright 2012 by Xiaoyang Wang
Development of a Computationally Efficient Finite Element Model of the Human Spine for the Purpose of Conducting Parametric Studies of the Stresses Induced in the Spine and in
Spinal Fusion Instrumentation Hardware during Flexion, Torsion and Extension
by Xiaoyang Wang
A dissertation submitted to the Graduate Faculty of North Carolina State University
in partial fulfillment of the requirements for the degree of
Doctor of Philosophy
Mechanical Engineering
Raleigh, North Carolina
2012
APPROVED BY:
_______________________________ _______________________________ Dr. Gregory Buckner Dr. Carl Zorowski
_______________________________ _______________________________ Dr. Mansoor Haider Dr. Andre Mazzoleni
ii
DEDICATION
Dedicated to
my parents
iii
BIOGRAPHY
iv
ACKNOWLEDGMENTS
First and foremost, I would like to thank my advisor, Dr. Andre Mazzoleni for his patient guidance, enthusiastic encouragement and generous support throughout my study and research at NC State University. Especially, he encouraged me to pursue new ideas throughout and took time to share his insight into the research.
I would like to thank my committee members, Dr. Gregory Buckner, Dr. Carl Zorowski, and Dr. Mansoor Haider for their generosity with their time and valuable suggestions in completing this thesis.
v
TABLE OF CONTENTS
List of Figures... vii
List of Tables... xiii
Chapter 1 Introduction... 1
Chapter 2 Development of Computationally Efficient Finite Element Model of the Human Spine for Instrumentation Studies... 5
2.1 Introduction... 6
2.2 Development of a computationally efficient finite element model of the spine ... 8
2.2.1 Model validation... 9
2.3 Some parametric studies using the model... 19
2.3.1 Parametric study of stresses induced in the spine and in associated spinal fusion hardware, as intervertebral disc conditions are varied parametrically with respect to stiffness... 19
2.3.2 Interbody device location and type selection study... 49
2.4 Conclusion... 55
Chapter 3 Novel Spinal Connectors Provide Potential to Reduce Rod Stress on the Lumbar Rod-Screw Construct... 56
2.1 Introduction... 57
3.2 Development of posterior connector constructs... 57
3.3 Posterior constructs analysis... 63
3.4 Conclusion... 80
Chapter 4 Adjacent Disc Biomechanics after Spine Fusion... 81
4.1 Introduction... 82
4.2 Development of spine fusion models... 82
4.3 Adjacent disc stress analysis... 87
4.4 Conclusion... 103
vi
References... 107 Appendix ... 115 Appendix A. Fusion Rods Material Substitution-Titanium... 116
vii
LIST OF FIGURES
Figure 2.1 Interbody devices 3-dimensional models... 7
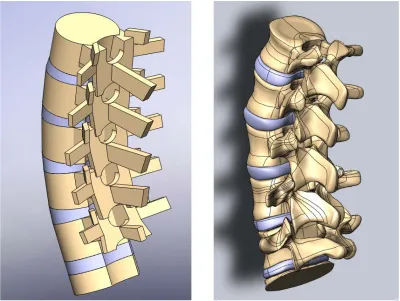
Figure 2.2 Computationally efficient model and detailed 3D model... 8
Figure 2.3 The side view and posterior view of intact L1-S1 spine model... 11
Figure 2.4 Stress and strain curve (hyperelastic definition)... 11
Figure 2.5 Spine motions... 13
Figure 2.6 Yamamoto's experiment setup [19]... 15
Figure 2.7 C.S Chen's lumbar spine finite element model [16]... 15
Figure 2.8 Comparison between the present study and the in vitro experimental study in the 3D angular motion under extension motion... 17
Figure 2.9 Comparison between the present study and the in vitro experimental study in the 3D angular motion under flexion motion 17 Figure 2.10 Comparison between the present study and the in vitro experimental study in the 3D angular motion under torsion motion 18 Figure 2.11 Comparison between the present study and the in vitro experimental study in the 3D angular motion under lateral bending motion... 18
Figure 2.12 The anterior view and posterior view of T1-Pelvis spine model with 2 ALIFs implanted... 21
Figure 2.13 Maximum rod stress on non-spacer model and L4-L5 spacer models during disc degeneration in flexion motion... 25
Figure 2.14 Maximum rod stress on non-spacer model and L4-L5 spacer models during disc degeneration in extension motion... 26
Figure 2.15 Maximum rod stress on non-spacer model and L4-L5 spacer models during disc degeneration in torsion motion... 27
viii
Figure 2.17 Maximum rod stress on models with ALIF implanted on the L4-L5 level during disc degeneration in extension motion... 30
Figure 2.18 Maximum rod stress on models with ALIF implanted on the L4-L5 level during disc degeneration in torsion motion... 31
Figure 2.19 Maximum rod stress on models with TLIF implanted on the L4-L5 level during disc degeneration in flexion motion... 33
Figure 2.20 Maximum rod stress on models with TLIF implanted on the L4-L5 level during disc degeneration in extension motion... 34
Figure 2.21 Maximum rod stress on models with TLIF implanted on the L4-L5 level during disc degeneration in torsion motion... 35
Figure 2.22 Maximum rod stress on non-spacer model and L5-S1 spacer models during disc degeneration in flexion motion... 37
Figure 2.23 Maximum rod stress on non-spacer model and L5-S1 spacer models during disc degeneration in extension motion... 38
Figure 2.24 Maximum rod stress on non-spacer model and L5-S1 spacer models during disc degeneration in torsion motion... 39
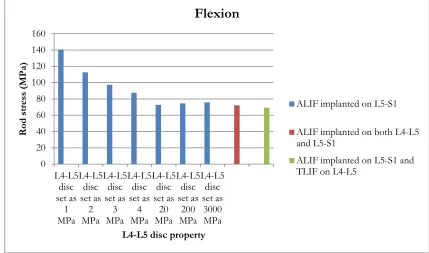
Figure 2.25 Maximum rod stress on models with ALIF implanted on the L5-S1 level during disc degeneration in flexion motion... 41
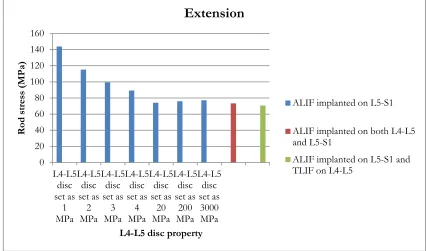
Figure 2.26 Maximum rod stress on models with ALIF implanted on the L5-S1 level during disc degeneration in extension motion... 42
Figure 2.27 Maximum rod stress on models with ALIF implanted on the L5-S1 level during disc degeneration in torsion motion... 43
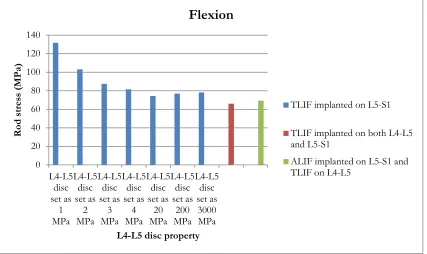
Figure 2.28 Maximum rod stress on models with TLIF implanted on the L5-S1 level during disc degeneration in flexion motion... 45
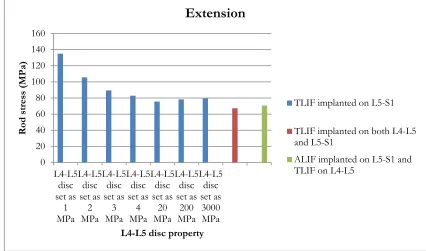
Figure 2.29 Maximum rod stress on models with TLIF implanted on the L5-S1 level during disc degeneration in extension motion... 46
Figure 2.30 Maximum rod stress on models with TLIF implanted on the L5-S1 level during disc degeneration in torsion motion... 47
Figure 2.31 The side view and posterior view of intact T1-S1 spine model... 50
ix
Figure 2.33 Maximum stresses on rods for all cases... 54
Figure 2.34 Maximum Stress Comparison between ALIF and TLIF Studies on Rods... 54
Figure 3.1 Different configurations of models used in connector study... 60
Figure 3.2 The side view and posterior view of a L1-iliac fusion model with TLIF, transverse connector, and truss connector implanted... 61
Figure 3.3 Maximum rod stress on L1-iliac fusion models with transverse connector during disc degeneration in flexion motion... 64
Figure 3.4 Maximum rod stress on L1-iliac fusion models with transverse connector during disc degeneration in extension motion... 65
Figure 3.5 Maximum rod stress on L1-iliac fusion models with transverse connector during disc degeneration in torsion motion... 66
Figure 3.6 Maximum rod stress on L1-iliac fusion models with truss connector during disc degeneration in flexion motion... 68
Figure 3.7 Maximum rod stress on L1-iliac fusion models with truss connector during disc degeneration in extension motion... 69
Figure 3.8 Maximum rod stress on L1-iliac fusion models with truss connector during disc degeneration in torsion motion... 70
Figure 3.9 Maximum rod stress on L1-iliac fusion models with truss and DLink connector during disc degeneration in flexion motion... 72
Figure 3.10 Maximum rod stress on L1-iliac fusion models with truss and DLink connector during disc degeneration in extension motion... 73
Figure 3.11 Maximum rod stress on L1-iliac fusion models with truss and DLink connector during disc degeneration in torsion motion... 74
Figure 3.12 Maximum rod stress comparison among different connectors during disc degeneration in flexion motion... 76
Figure 3.13 Maximum rod stress comparison among different connectors during disc degeneration in extension motion... 77
x
Figure 3.15 Novel connector models maximum rod stress difference
percentage compared to transverse connector in torsion motion... 79
Figure 4.1 Different configurations of models used in adjacent disc study... 84
Figure 4.2 The side view and posterior view of a L1-iliac fusion model... 85
Figure 4.3 T12-L1 disc stress with L1-iliac fusion during flexion motion... 88
Figure 4.4 T12-L1 disc stress with L1-iliac fusion during extension motion... 89
Figure 4.5 T12-L1 disc stress with L1-iliac fusion during torsion motion... 90
Figure 4.6 T12-L1 disc stress with L2-iliac fusion during flexion motion... 92
Figure 4.7 T12-L1 disc stress with L2-iliac fusion during extension motion... 93
Figure 4.8 T12-L1 disc stress with L2-iliac fusion during torsion motion... 94
Figure 4.9 T12-L1 disc stress with T10-iliac fusion during flexion motion... 95
Figure 4.10 T12-L1 disc stress with T10-iliac fusion during extension motion.... 96
Figure 4.11 T12-L1 disc stress with T10-iliac fusion during torsion motion... 97
Figure 4.12 T12-L1 disc stress comparison among all fusion models during flexion, extension, and torsion motions... 99
Figure 4.13 T12-L1 disc stress comparison between fusion models and noninstrumented model during flexion, extension, and torsion motions... 99
Figure 4.14 T11-T12 disc stress comparison among all fusion models during flexion, extension, and torsion motions... 101
Figure 4.15 T11-T12 disc stress difference percentage between fusion models and noninstrumented model during flexion, extension, and torsion motions... 101
Figure 4.16 T10-T11 disc stress comparison among all fusion models during flexion, extension, and torsion motions... 102
xi
Figure A.1 Maximum rod stress on non-spacer model and L4-L5 spacer models during disc degeneration in flexion motion... 120
Figure A.2 Maximum rod stress on non-spacer model and L4-L5 spacer models during disc degeneration in extension motion... 121
Figure A.3 Maximum rod stress on non-spacer model and L4-L5 spacer models during disc degeneration in torsion motion... 122
Figure A.4 Maximum rod stress on models with ALIF implanted on the L4-L5 level during disc degeneration in flexion motion... 124
Figure A.5 Maximum rod stress on models with ALIF implanted on the L4-L5 level during disc degeneration in extension motion... 125
Figure A.6 Maximum rod stress on models with ALIF implanted on the L4-L5 level during disc degeneration in torsion motion... 126
Figure A.7 Maximum rod stress on models with TLIF implanted on the L4-L5 level during disc degeneration in flexion motion... 128
Figure A.8 Maximum rod stress on models with TLIF implanted on the L4-L5 level during disc degeneration in extension motion... 129
Figure A.9 Maximum rod stress on models with TLIF implanted on the L4-L5 level during disc degeneration in torsion motion... 130
Figure A.10 Maximum rod stress on non-spacer model and L5-S1 spacer models during disc degeneration in flexion motion... 132
Figure A.11 Maximum rod stress on non-spacer model and L5-S1 spacer models during disc degeneration in extension motion... 133
Figure A.12 Maximum rod stress on non-spacer model and L5-S1 spacer models during disc degeneration in torsion motion... 134
Figure A.13 Maximum rod stress on models with ALIF implanted on the L5-S1 level during disc degeneration in flexion motion... 136
Figure A.14 Maximum rod stress on models with ALIF implanted on the L5-S1 level during disc degeneration in extension motion... 137
xii
Figure A.16 Maximum rod stress on models with TLIF implanted on the L5-S1 level during disc degeneration in flexion motion... 140
Figure A.17 Maximum rod stress on models with TLIF implanted on the L5-S1 level during disc degeneration in extension motion... 141
xiii
LIST OF TABLES
Table 2.1 Material and mechanical properties used in L1-S1 model... 12
Table 2.2 Comparison between the present study and the in vitro experimental study in the 3D angular motion... 16
Table 2.3 Material and mechanical properties in T1-Pelvis model... 22
Table 2.4 Models with different spinal interbody devices... 23
Table 2.5 Maximum stress on rods and for all studies... 53
Table 3.1 Material and mechanical properties used in connector study... 62
Table 4.1 Material and mechanical properties used in adjacent disc study... 86
1
Chapter 1
2
This dissertation presents several comprehensive parametric studies of the stresses induced in the spine and in spinal fusion instrumentation during flexion, torsion and extension, by making use of a validated, computationally efficient, finite element model of the human spine. Intervertebral disc degeneration is a serious medical condition which sometimes necessitates spinal fusion in order to relieve the patient’s back pain and restore spinal function. Curvature of the spine, or scoliosis, is another medical condition which may require spinal fusion. A variety of spinal fusion instrumentation constructs are studied, as invtervertebral disc conditions are varied parametrically with respect to disc stiffness. The motivation for conducting these studies is to develop computational tools which can be used to help surgeons predict potential surgical outcomes prior to surgery, and hence provide some guidance as to what type of surgery may be most beneficial for a given patient, given the pre-operative condition of their spine. Although previous researchers have developed finite element models of the spine, most only cover a subsection of the spine, e.g. the lumbar spine, and the model presented here covers the entire thoracic-lumbar spine. Also, most finite element models of the spine which have been developed run very slowly, due to the fact that they are based on detailed CT scans of a particular patient, while the model presented here is based on simpler geometrical shapes which make it an order of magnitude faster to run. This computationally efficient model has proven to be just as accurate as more anatomically complicated models, as will be shown in Chapter 2, and its efficiency enables detailed parametric studies to be performed in a reasonable amount of time; these studies will be presented in later chapters.
3
due to a patient’s propensity for disc failure, or whether the structural changes in the spine due to the fusion surgery cause the adjacent discs to fail. Surgeons currently have many different options available to them when performing spinal fusion surgeries, such as using interbody spacers, and different types of reinforcing structures placed between the fusion rods (e.g. cross-links or truss structures). In this dissertation, we show how the computationally efficient finite element model which has been developed can be used to evaluate the performance of a particular configuration of fusion hardware (instrumentation) in terms of the stresses induced in the hardware and in adjacent discs. Parametric studies are also conducted to give insight into which types of surgeries might be most effective for a particular patient, given the condition of the patient’s intervertebral discs, namely the modulus of elasticity of the disc, i.e. its stiffness.
Further details of the computationally efficient model discussed above, and how it was validated, will be discussed in chapter 2. Chapter 2 also presents studies of how the use of interbody spacers can reduce the stresses experienced by the rods used in spinal fusion surgery, and gives guidance as to when it might be prudent to use these spacers. The studies also examine how the placement of the spacers (anterior vs. posterior) affects the stresses experienced by the rods.
The fact that using this model enables results to be generated quickly makes it possible to conduct detailed parametric studies, as will be presented in later chapters. The basic outline of the rest of this dissertation is outlined below.
4
degeneration process on rod stress, and also presents the longest rod-screw spinal fusion construct that has been investigated via finite element studies of the spine.
Chapter 3 presents two novel posterior connector structures, and conducts parametric studies to investigate the effect of these structures on rod stress over a wide range of parametrically varied disc stiffness values.
Chapter 4 studies three different fusion levels to investigate the stress level on adjacent discs after fusion surgery, where the adjacent disc stresses in the fused spine are compared with a non-fused control case.
5
Chapter 2
Development of Computationally
Efficient Finite Element Model of
the Human Spine for
6
2.1 Introduction
CT-7
scans which incorporate very fine details particular to a specific patient, our model has been simplified to capture the essential geometric properties (taken from the biomechanics literature [12-14]), while still generating valid results; the validation of the model is presented in a following section.
In this simplified finite element model, parameters can be changed easily, and new results generated in just a few minutes, as opposed to the several hours of computer time required to generate results from a more complicated model. This reduced computation time makes it possible to conduct parametric studies in a reasonable amount of time. To our knowledge, this work is the first to conduct parametric studies of the stresses induced in spinal fusion hardware for different instrumentation configurations over a wide range of disc stiffness parameters.
In this chapter, a spine model from L1 (Lumbar) to S1 (Sacrum) is compared with both experimental and finite element analysis data (from other sources) to validate the accuracy of the model. Some parametric studies which involve spinal fusion hardware are then presented to illustrate the utility of the model.
8
2.2 Development of a computationally efficient finite
element model of the spine
In the current literature, spine finite element analysis is mostly based on computed tomography (CT) scan images of individual human spines. The models generated from those CT scan images are full of very small and intricate geometries. In finite element software packages, smaller and finer meshing elements are required to represent these geometries, resulting in very long computational times to finish analyses.
9
A 3D model based on one patient's CT scan is presented in Figure 2.2. With tiny and intricate geometries (mainly on facet joints), the computer run time for this model is over 24 hours. The main objective of our research is analyzing the stresses induced in the spine (mainly disc) and spinal instrumentation hardware. Therefore, the detailed geometries on facet joints are irrelevant to our study purposes and make the model computationally inefficient. In order to make the analysis computationally efficient, a 3D spine model based on geometrical details based on statistical anatomical dimensions [12-14] has been created (Figure 2.2). The most important spinal geometries (such as vertebra heights, vertebra widths, angles between vertebrae, disc heights, and etc) are strictly based on data from the literature. The main geometries of the spine are created as simple blocks and cylinders, which make the simplified model very easy to mesh and generate results in very short time (in some cases, an analysis can be run in as little as 10 minutes). Solidworks 20 geometry. The solid model is then imported into a finite element analytical program (ABAQUS 6.10, Hibbitt, Karlsson and Sorenson, Inc., Providence, RI) to perform the analysis.
In our model, cortical bone is modeled by using thin shell elements [15]. 3D solid elements are applied to model the trabecular bone, posterior elements of the vertebrae, annulus fibrosus, and the nucleus pulposus of intervertebral discs. All seven ligaments are incorporated into the model as spring elements: anterior longitudinal, posterior longitudinal, intertransverse, ligamentum flavum, capsular, interspinous, and supraspinous ligaments [16-18]. 3D surface-to-surface contact is established to simulate the interaction between the facet joints surfaces.
2.2.1 Model validation
10
11
Figure 2.3. The side view (left) and posterior view (right) of intact L1-S1 spine model
12
Table 2.1. Material and mechanical properties used in L1-S1 model
Component Element type
Young’s Modulus (MPa) Cross-section (mm2)
Poisson’s ratio
Cortical bone Shell 12000 - 0.3
Trabecular bone Solid 100 - 0.2
Annulus fibrosus Solid Parametric Study - 0.3
Nucleus pulposus Solid 1 - 0.499
Posterior elements Solid 3500 - 0.25
Ligaments Anterior longitudinal Posterior longitudinal Intertransverse Interspinous Ligamentum flavum Capsular Supraspinous Spring 7.8(<12%) 20(>12%) 10(<11%) 20(>11%) 10(<18%) 58.7(>18%) 10(<14%) 11.6(>14%) 15(<6.2%) 19.5(>6.2%) 7.5(<25%) 32.9(>25%) 8(<20%) 15(>20%) 63.7 20.0 1.8 40.0 40.0 30.0 30.0 - - - - - - -
Sacrum Solid 12000 - 0.3
13
a). flexion b). extension
c). torsion d). lateral bending
14
15
Figure 2.6. Yamamoto's experiment setup [19]
16
Table 2.2. Comparison between the present study and the in vitro experimental study in the 3D angular motion (hyperelastic and elastic (in parenthesis))
Extension Flexion
Present Study Yamamoto et al. (1989) C.S. Chen et al. (2001) Present Study Yamamoto et al. (1989) C.S. Chen et al. (2001)
L1-L2(degree) 3.81(3.65) 2.8 2.64 4.10(3.98) 4.2 3.05
L2-L3(degree) 3.72(4.12) 3.3 2.32 3.98(4.12) 5.4 3.28
L3-L4(degree) 3.61(4.07) 2.3 1.18 4.01(3.78) 6.1 3.58
L4-L5(degree) 3.70(3.23) 4.0 2.89 4.04(3.91) 7.1 4.49
Torsion Lateral Bending
Present study Yamamoto et al. (1989) C.S. Chen et al. (2001) Present study Yamamoto et al. (1989) C.S. Chen et al. (2001)
L1-L2(degree) 1.81(1.72) 1.4 2.28 3.26(3.45) 3.5 2.85
L2-L3(degree) 1.85(1.73) 1.9 2.56 4.08(4.17) 5.0 3.31
L3-L4(degree) 1.90(1.85) 1.9 2.21 3.80(4.23) 4.3 3.33
17
Figure 2.8. Comparison between the present study and the in vitro experimental study in the 3D angular motion under extension motion
Figure 2.9. Comparison between the present study and the in vitro experimental study in the 3D angular motion under flexion motion
0 0.5 1 1.5 2 2.5 3 3.5 4 4.5
L1-L2 L2-L3 L3-L4 L4-L5
R an ge of m oti on (d eg ree) Spine level
Extension
Present study (hyperelastic) Present study (elastic)Yamamoto C.S. Chen 0 1 2 3 4 5 6 7 8
L1-L2 L2-L3 L3-L4 L4-L5
R an ge of m oti on (d eg ree) Spine level
Flexion
Present study (hyperelastic) Present study (elastic)Yamamoto
18
Figure 2.10. Comparison between the present study and the in vitro experimental study in the 3D angular motion under torsion motion
Figure 2.11. Comparison between the present study and the in vitro experimental study in the 3D angular motion under lateral bending motion
0 0.5 1 1.5 2 2.5 3
L1-L2 L2-L3 L3-L4 L4-L5
R an ge of m oti on (d eg ree) Spine level
Torsion
Present study (hyperelastic) Present study (elastic)Yamamoto C.S. Chen 0 1 2 3 4 5 6
L1-L2 L2-L3 L3-L4 L4-L5
R an ge of m oti on (d eg ree) Spine level
Lateral bending
Present study (hyperelastic) Present study (elastic)Yamamoto
19
The range of motion comparison is also presented in Figure 2.8-2.11 under all four loading motions (extension, flexion, torsion and lateral bending). The good correlation between our finite element analysis and Yamamoto's experimental data gives us confidence that our finite element model will be able to represent and analyze spinal responses effectively under various loading scenarios. Note that although the model presented extends from T1 to the sacrum, only the L1-S1 portion was validated with experimental data, since no experimental data is available for T1-L1.
2.3 Some parametric studies using the model
2.3.1 Parametric study of stresses induced in the spine
and in associated spinal fusion hardware, as
intervertebral disc conditions are varied
parametrically with respect to stiffness
20
finite element model presented in Figure 2.9 is developed with 80,634 nodes and 291,034 elements. A variety of spinal fusion instrumentation constructs are studied. The ALIFs are placed at the center between vertebrae, and the TLIFs are located as anteriorly as possible.
Interbody devices are commonly used to strengthen the spine and relieve patients' back pain. In order to further support the spine, surgeons sometime implant a second interbody device into the lumbar spine to provide it with more spinal rigidity. In this study, finite element analysis is used to show its potential to provide surgeons with guidance as to when to implant one or two interbody devices to reduce the risk of rod breakage.
21
22
Table 2.3. Material and mechanical properties in T1-Pelvis model
Component Element type
Young’s Modulus (MPa) Cross-section (mm2)
Poisson’s ratio
Cortical bone Shell 12000 - 0.3
Trabecular bone Solid 100 - 0.2
Annulus fibrosus Solid Parametric Study - 0.3
Posterior elements Solid 3500 - 0.25
Ligaments Anterior longitudinal Posterior longitudinal Intertransverse Interspinous Ligamentum flavum Capsular Supraspinous Spring 7.8(<12%) 20(>12%) 10(<11%) 20(>11%) 10(<18%) 58.7(>18%) 10(<14%) 11.6(>14%) 15(<6.2%) 19.5(>6.2%) 7.5(<25%) 32.9(>25%) 8(<20%) 15(>20%) 63.7 20.0 1.8 40.0 40.0 30.0 30.0 - - - - - - -
Sacrum Solid 12000 - 0.3
Fusion rods (Cobalt) Solid 209000 - 0.31 Fusion screws
(Titanium)
Solid 116000 - 0.32
Interbody device (PEEK)
Solid 3800 - 0.3
23 L5-S1 levels (Table 2.4).
A 40 N concentrated force is applied at the center of the spine model in the posterior and anterior directions to simulate extension and flexion motions, respectively. A 10 Nm moment is imposed on the spine to create the torsional motion.
Table 2.4. Models with different spinal interbody devices
Level Model No 1 2 3 4 5 6 7 8 L4-L5 implant Disc Disc ALIF ALIF TLIF TLIF TLIF Disc L5-S1 implant ALIF TLIF Disc ALIF Disc TLIF ALIF Disc
24
25
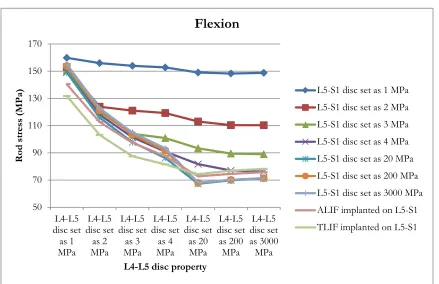
Figure 2.13. Maximum rod stress (MPa) on non-spacer model and L4-L5 spacer models during disc degeneration in flexion motion
50 70 90 110 130 150 170 190 210 L5-S1 disc set as 1 MPa L5-S1 disc set as 2 MPa L5-S1 disc set as 3 MPa L5-S1 disc set as 4 MPa L5-S1 disc set as 20 MPa L5-S1 disc set as 200 MPa L5-S1 disc set as 3000 MPa Ro d s tre ss (M Pa )
L4-L5 disc property
Flexion
26
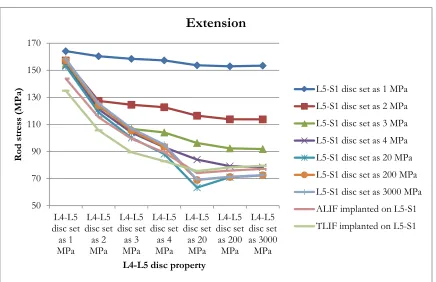
Figure 2.14. Maximum rod stress (MPa) on non-spacer model and L4-L5 spacer models during disc degeneration in extension motion
50 70 90 110 130 150 170 190 210 L5-S1 disc set as 1 MPa L5-S1 disc set as 2 MPa L5-S1 disc set as 3 MPa L5-S1 disc set as 4 MPa L5-S1 disc set as 20 MPa L5-S1 disc set as 200 MPa L5-S1 disc set as 3000 MPa Ro d s tre ss (M Pa )
L4-L5 disc property
Extension
27
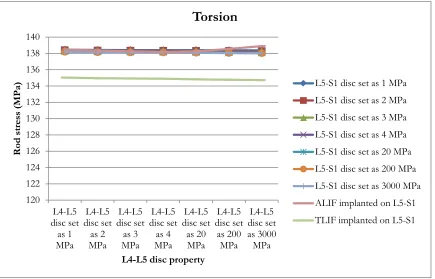
Figure 2.15. Maximum rod stress (MPa) on non-spacer model and L4-L5 spacer models during disc degeneration in torsion motion
120 122 124 126 128 130 132 134 136 138 140 L5-S1 disc set as 1 MPa L5-S1 disc set as 2 MPa L5-S1 disc set as 3 MPa L5-S1 disc set as 4 MPa L5-S1 disc set as 20 MPa L5-S1 disc set as 200 MPa L5-S1 disc set as 3000 MPa Ro d s tre ss (M Pa )
L4-L5 disc property
Torsion
28
Figure 2.13-2.15 also illustrate if both L4-L5 and L5-S1 discs are degeneratively soft (i.e. with a Young's modulus of 1 MPa), just replacing L4-L5 disc with an interbody device doesn’t reduce the maximum rod stress during extension and flexion motions. In fact, in some cases adding an interbody device induces an even larger maximum rod stress. For example, in the model with an ALIF implanted on L4-L5 (yellow dot curve), when L5-S1 is degeneratively soft we have that in extension the maximum rod stress is 18.7% higher than the model where both discs are degeneratively soft. A similar situation also occurs during flexion motion.
29
Figure 2.16. Maximum rod stress (MPa) on models with ALIF implanted on the L4-L5 level during disc degeneration in flexion motion
0 20 40 60 80 100 120 140 160 180 200 L5-S1 disc set as 1
MPa L5-S1
disc set as 2
MPa L5-S1
disc set as 3
MPa L5-S1
disc set as 4
MPa L5-S1 disc set as 20 MPa L5-S1 disc set as 200 MPa L5-S1 disc set as 3000 MPa Ro d s tre ss (M Pa )
L4-L5 disc property
Flexion
ALIF implanted on L4-L5
30
Figure 2.17. Maximum rod stress (MPa) on models with ALIF implanted on the L4-L5 level during disc degeneration in extension motion
0 50 100 150 200 250 L5-S1 disc set as 1 MPa L5-S1 disc set as 2 MPa L5-S1 disc set as 3 MPa L5-S1 disc set as 4 MPa L5-S1 disc set as 20 MPa L5-S1 disc set as 200 MPa L5-S1 disc set as 3000 MPa Ro d s tre ss (M Pa )
L4-L5 disc property
Extension
ALIF implanted on L4-L5
31
Figure 2.18. Maximum rod stress (MPa) on models with ALIF implanted on the L4-L5 level during disc degeneration in torsion motion
0 20 40 60 80 100 120 140 160 L5-S1 disc set as 1 MPa L5-S1 disc set as 2 MPa L5-S1 disc set as 3 MPa L5-S1 disc set as 4 MPa L5-S1 disc set as 20 MPa L5-S1 disc set as 200 MPa L5-S1 disc set as 3000 MPa Ro d s tre ss (M Pa )
L4-L5 disc property
Torsion
ALIF implanted on L4-L5
32
Von Mises stress of each model is tabulated to compare the maximum rod stress. For the model with an ALIF implanted on L4-L5 (blue bars), we see that the highest maximum rod stress occurs when the L5-S1 disc’s Young's modulus is set as 1 MPa. For extension and flexion motions, the maximum rod stress decreases when the L5-S1 disc becomes stiffer, as expected. The maximum rod stress decreases 58.0% as the L5-S1 disc property is varied from 1 MPa to 3000 MPa under extension. The percentage difference is 57.3% under flexion.
During extension and flexion motions, a second ALIF spacer (red bars) can significantly reduce the maximum rod stress if the L5-S1 disc is degeneratively soft. If the L5-S1 disc is stiffer than normal (i.e. its Young's modulus is higher than 4 MPa), the second ALIF on L5-S1 has no significant impact on reducing the maximum rod stress. Similarily, there is no significant difference between the two models under torsional loading for all of the parameter values investigated.
33
Figure 2.19. Maximum rod stress (MPa) on models with TLIF implanted on the L4-L5 level during disc degeneration in flexion motion
0 20 40 60 80 100 120 140 160 180 L5-S1 disc set as 1 MPa L5-S1 disc set as 2 MPa L5-S1 disc set as 3 MPa L5-S1 disc set as 4 MPa L5-S1 disc set as 20 MPa L5-S1 disc set as 200 MPa L5-S1 disc set as 3000 MPa Ro d s tre ss (M Pa )
L4-L5 disc property
Flexion
TLIF implanted on L4-L5
TLIF implanted on both L4-L5 and L5-S1
34
Figure 2.20. Maximum rod stress (MPa) on models with TLIF implanted on the L4-L5 level during disc degeneration in extension motion
0 20 40 60 80 100 120 140 160 180 L5-S1 disc set as 1 MPa L5-S1 disc set as 2 MPa L5-S1 disc set as 3 MPa L5-S1 disc set as 4 MPa L5-S1 disc set as 20 MPa L5-S1 disc set as 200 MPa L5-S1 disc set as 3000 MPa Ro d s tre ss (M Pa )
L4-L5 disc property
Extension
TLIF implanted on L4-L5
TLIF implanted on both L4-L5 and L5-S1
35
Figure 2.21. Maximum rod stress (MPa) on models with TLIF implanted on the L4-L5 level during disc degeneration in torsion motion
0 20 40 60 80 100 120 140 160 L5-S1 disc set as 1 MPa L5-S1 disc set as 2 MPa L5-S1 disc set as 3 MPa L5-S1 disc set as 4 MPa L5-S1 disc set as 20 MPa L5-S1 disc set as 200 MPa L5-S1 disc set as 3000 MPa Ro d s tre ss (M Pa )
L4-L5 disc property
Torsion
TLIF implanted on L4-L5
TLIF implanted on both L4-L5 and L5-S1
36
For the model with a TLIF implanted on L4-L5 (blue bars), the maximum rod stress decreases when the L5-S1 disc gets stiffer under extension and flexion motions. 57.0% and 56.4% percentage differences are noticed, respectively, for extension and flexion when the L5-S1 disc stiffness property is changed from 1 MPa to 3000 MPa.
As Figure 2.19-2.21 depict, either ALIF (green bars) or TLIF (red bars) can significantly reduce the maximum rod stress if L5-S1 disc is degeneratively soft. In this case, a second spacer can be critical to prevent the risk of rod breakage. Similarly as discussed earlier, no spacer would be necessary if the disc is already degeneratively stiff prior to surgery. During torsion motion, we see that all the models generate similar maximum rod stresses.
Note that there is no significant difference between an ALIF and TLIF at reducing the maximum rod stress. As the name implies, ALIF requires surgeons to operate from the anterior side of the patient. Currently, most of the spinal fusion is implanted on the posterior side, such as rod-screw constructs, so implanting an ALIF increases both the surgical difficulty and time, which are directly related to the surgical cost and also increase the possibility of post-surgical complications. Also, in some cases, vascular injuries have been seen to occur with the anterior surgical approach. A TLIF, however, can be implanted from the posterior side, where the rod-screws construct is located; since a TLIF serves a similar function in reducing the risk of rod breakage, a TLIF may be a better option than an ALIF for some cases in which the spacer is being implanted to replace a degeneratively soft disc for the purpose of reducing the stresses induced in the fusion rods.
37
Figure 2.22. Maximum rod stress (MPa) on non-spacer model and L5-S1 spacer models during disc degeneration in flexion motion
50 70 90 110 130 150 170 L4-L5 disc set as 1 MPa L4-L5 disc set as 2 MPa L4-L5 disc set as 3 MPa L4-L5 disc set as 4 MPa L4-L5 disc set as 20 MPa L4-L5 disc set as 200 MPa L4-L5 disc set as 3000 MPa Ro d s tre ss (M Pa )
L4-L5 disc property
Flexion
38
Figure 2.23. Maximum rod stress (MPa) on non-spacer model and L5-S1 spacer models during disc degeneration in extension motion
50 70 90 110 130 150 170 L4-L5 disc set as 1 MPa L4-L5 disc set as 2 MPa L4-L5 disc set as 3 MPa L4-L5 disc set as 4 MPa L4-L5 disc set as 20 MPa L4-L5 disc set as 200 MPa L4-L5 disc set as 3000 MPa Ro d s tre ss (M Pa )
L4-L5 disc property
Extension
39
Figure 2.24. Maximum rod stress (MPa) on non-spacer model and L5-S1 spacer models during disc degeneration in torsion motion
120 122 124 126 128 130 132 134 136 138 140 L4-L5 disc set as 1 MPa L4-L5 disc set as 2 MPa L4-L5 disc set as 3 MPa L4-L5 disc set as 4 MPa L4-L5 disc set as 20 MPa L4-L5 disc set as 200 MPa L4-L5 disc set as 3000 MPa Ro d s tre ss (M Pa )
L4-L5 disc property
Torsion
40
41
Figure 2.25. Maximum rod stress (MPa) on models with ALIF implanted on the L5-S1 level during disc degeneration in flexion motion
0 20 40 60 80 100 120 140 160 L4-L5 disc set as 1 MPa L4-L5 disc set as 2 MPa L4-L5 disc set as 3 MPa L4-L5 disc set as 4 MPa L4-L5 disc set as 20 MPa L4-L5 disc set as 200 MPa L4-L5 disc set as 3000 MPa Ro d s tre ss (M Pa )
L4-L5 disc property
Flexion
ALIF implanted on L5-S1
ALIF implanted on both L4-L5 and L5-S1
42
Figure 2.26. Maximum rod stress (MPa) on models with ALIF implanted on the L5-S1 level during disc degeneration in extension motion
0 20 40 60 80 100 120 140 160 L4-L5 disc set as 1 MPa L4-L5 disc set as 2 MPa L4-L5 disc set as 3 MPa L4-L5 disc set as 4 MPa L4-L5 disc set as 20 MPa L4-L5 disc set as 200 MPa L4-L5 disc set as 3000 MPa Ro d s tre ss (M Pa )
L4-L5 disc property
Extension
ALIF implanted on L5-S1
ALIF implanted on both L4-L5 and L5-S1
43
Figure 2.27. Maximum rod stress (MPa) on models with ALIF implanted on the L5-S1 level during disc degeneration in torsion motion
0 20 40 60 80 100 120 140 160 L4-L5 disc set as 1 MPa L4-L5 disc set as 2 MPa L4-L5 disc set as 3 MPa L4-L5 disc set as 4 MPa L4-L5 disc set as 20 MPa L4-L5 disc set as 200 MPa L4-L5 disc set as 3000 MPa Ro d s tre ss (M Pa )
L4-L5 disc property
Torsion
ALIF implanted on L5-S1
ALIF implanted on both L4-L5 and L5-S1
44
For the model with an ALIF implanted on L5-S1 (blue bars), the maximum rod stresses are reduced by 46.4% and 46.0% under extension and flexion respectively as the L4-L5 disc property is varied from 1 MPa to 3000 MPa. As discussed earlier, the maximum rod stress is still quite high when the L4-L5 disc is degeneratively soft. A second interbody device replacement on the L5 level (red and green bars) can significantly reduce the maximum rod stress when L4-L5 disc is degeneratively soft. If the L4-L4-L5 disc becomes stiffer (Young's modulus is higher 4 MPa), a second interbody device implant is not necessary. The maximum rod stress decreased automatically due to the higher spinal rigidity provided by stiffer discs. No significant difference is noticed between an ALIF and TLIF at reducing the maximum rod stress as they are used as the second interbody device.
45
Figure 2.28. Maximum rod stress (MPa) on models with TLIF implanted on the L5-S1 level during disc degeneration in flexion motion
0 20 40 60 80 100 120 140 L4-L5 disc set as 1 MPa L4-L5 disc set as 2 MPa L4-L5 disc set as 3 MPa L4-L5 disc set as 4 MPa L4-L5 disc set as 20 MPa L4-L5 disc set as 200 MPa L4-L5 disc set as 3000 MPa Ro d s tre ss (M Pa )
L4-L5 disc property
Flexion
TLIF implanted on L5-S1
TLIF implanted on both L4-L5 and L5-S1
46
Figure 2.29. Maximum rod stress (MPa) on models with TLIF implanted on the L5-S1 level during disc degeneration in extension motion
0 20 40 60 80 100 120 140 160 L4-L5 disc set as 1 MPa L4-L5 disc set as 2 MPa L4-L5 disc set as 3 MPa L4-L5 disc set as 4 MPa L4-L5 disc set as 20 MPa L4-L5 disc set as 200 MPa L4-L5 disc set as 3000 MPa Ro d s tre ss (M Pa )
L4-L5 disc property
Extension
TLIF implanted on L5-S1
TLIF implanted on both L4-L5 and L5-S1
47
Figure 2.30. Maximum rod stress (MPa) on models with TLIF implanted on the L5-S1 level during disc degeneration in torsion motion
0 20 40 60 80 100 120 140 160 L4-L5 disc set as 1 MPa L4-L5 disc set as 2 MPa L4-L5 disc set as 3 MPa L4-L5 disc set as 4 MPa L4-L5 disc set as 20 MPa L4-L5 disc set as 200 MPa L4-L5 disc set as 3000 MPa Ro d s tre ss (M Pa )
L4-L5 disc property
Torsion
TLIF implanted on L5-S1
TLIF implanted on both L4-L5 and L5-S1
48
During extension and flexion motions, 41.1% and 40.7% percentage decreases are noticed in the maximum rod stresses respectively when the L4-L5 disc property is varied from 1 MPa to 3000 MPa. It is critical to use a second interbody device at the L4-L5 level if the disc is diagnosed as degeneratively soft, in terms of reducing the maximum rod stress.
49
2.3.2 Interbody device location and type selection study
50
51
52
TLIF location 1 TLIF location 2 TLIF location 3
TLIF location 4 TLIF location 5 TLIF location 6
ALIF
Figure 2.32. Interbody device locations
53
The finite element analysis results are listed in Table 2.5. The maximum stress induced on rods is tabulated for each case, where case 7 is the simulation with the ALIF. As can be seen from Table 2.5, placement of the TLIF is very critical to the maximum stresses experienced in the rods during a torso bend, as placing the TLIF fully posteriorly results in a 61% increase in maximum rod stress (relative to an ALIF), while placing the TLIF fully anteriorly results in a 10% decrease in maximum rod stress (relative to an ALIF). Figure 2.33 also presents the maximum stress in the rods for each case. The percentage difference is shown in Figure 2.34. As can be seen in the chart and the figures, a TLIF can be just as effective (if not more so) at reducing rod stress during flexion, so given the relative ease of implanting a TLIF (as opposed to and ALIF), implanting a TLIF may be preferable to implanting an ALIF in certain situations.
Table 2.5. Maximum stress on rods and for all studies
Spacer Case No. Maximum stress on rods (MPa)
Percentage difference relative to ALIF on rods
TLIF
1 42.6 61%
2 42.1 59%
3 37.8 43%
4 31.8 21%
5 29.1 10%
6 23.7 -10%
54
Figure 2.33. Maximum stresses on rods for all cases
Figure 2.34. Maximum stress comparison between ALIF and TLIF studies on rods
0 5 10 15 20 25 30 35 40 45 St re ss (MP a)
Maximum rod stress
Maximum stress on rods
-20% -10% 0% 10% 20% 30% 40% 50% 60% 70% TLIF location 1 TLIF location 2 TLIF location 3 TLIF location 4 TLIF location 5 TLIF location 6 Per cen ta ge (% )
Rod stress difference (compare to ALIF)
55
2.4 Conclusion
In this chapter, a computationally efficient L1-S1 spine model is compared with experimental and finite element analysis data and shown to be a validated model. The model is then extended to include the T1-L1 portion of the spine. With less complicated geometries, the model presented is very computationally efficient, enabling the rapid conduction of detailed parametric studies. In the interbody device selection and disc degeneration study presented in this chapter, eight models with all possible interbody device (ALIF and TLIF) implant combinations (for L4-L5 and L4-L5-S1) are modeled for a rod-screw fusion from T2 to the iliac wing. Extension, flexion and torsional loads are applied to investigate the spinal response and the stresses induced in the fusion rods. The results show that implanting an interbody device (ALIF of TLIF spacer) can significantly reduce the rod stress during extension and torsion motion by replacing a degeneratively soft (1 MPa) disc. If an interveterbral disc has begun the self-fusion process (i.e. is stiffer than a healthy disc), an interbody device may not be required, since our results show that replacing a degeneratively stiff disc with an interbody spacer has only minimal effect on rod stress. Little difference was noticed between an ALIF implant and a TLIF placed very close to the anterior edge of the intervertebral space. Due to the procedural difficulty of ALIF surgery, our sutdies show that a TLIF may be a preferable alternative to ALIF spacers for many patients.
56
Chapter 3
Novel Spinal Connectors Provide
57
3.1 Introduction
Currently, pedicle screw and rod fixation for fusion surgeries has become the standard method for fusing the spine to treat a variety of degenerative and traumatic conditions [1, 2, 5]. To enhance the rigidity of the rod-screw system, mechanical transverse connectors are often used as part of spinal instrumentation to provide a connection between the left and right fusion rods [30-48]. Studies have shown a 44% torsional segmental stiffness increase with use of a transverse connector in an in vitro spine model, with little effect on flexion and extension motions [49]. Pedicle screw fixation is well known to be most effective at stabilizing spinal surgical instrumentation during extension and flexion motions [50]. It is also suggested that the application of two transverse connectors is more effective in providing torsional stiffness than one connector [51]. Despite its effectiveness in providing increased spine segmental stiffness, the necessity of using a transverse connector is still controversial [52]. In addition to the extra costs and surgical time involved, the higher surgical construct profile that results from implanting a transverse connector is another limitation. Medical cases have been presented in the literature where implant removal was necessitated due to the discomfort caused by a high posterior spinal construct profile [53].
The objectives of posterior connectors are to provide immediate stability after surgery and to facilitate healing while maintaining the desired correction in the shape of the spine. This chapter focuses on comparing two novel posterior connector constructs to standard transverse connectors with respect to their ability to reduce rod stress and reduce the risk of rod breakage.
3.2 Development of posterior connector constructs
58 various load conditions.
In this chapter, rod-screw constructs are used to simulate an L1-iliac spinal fusion for several different models, where different types of posterior connectors are considered to provide support between two rods. Following standard surgical protocol, the traditional connector model is modeled with two transverse connectors on both the L1-L2 and L4-L5 levels (Figure 3.1(a)). Novel connector structures are then proposed and studied in this chapter to evaluate the potential of these novel structures to reduce the rod stress. In one of the novel structures, a truss-type connector links the left and right rods between L3 and the sacrum (Figure 3.1 (c)). In another one of the novel structures, a DLink-type connector is placed on the side of each rod and is connected between L3 and the sacrum. In surgical practice, a D-Link connector is recommended to be implemented along with truss connector (Figure 3.1 (e)). For each connector model, the situation with a transfominal interbody lumbar fusion (TLIF) located on L5-S1 as anteriorly as possible is also studied.
Therefore, there are six different configurations of models in this chapter: (1) a T1-Pelvis spine model with L1-iliac fusion and transverse connectors on both L2-L3 and L4-L5; (2) a T1-Pelvis spine model with L1-iliac fusion, TLIF on L5-S1, and transverse connectors on both L2-L3 and L4-L5; (3) a T1-Pelvis spine model with L1-iliac fusion and truss connector; (4) a T1-Pelvis spine model with L1-iliac fusion, TLIF on L5-S1, and truss connector; (5) a T1-Pelvis spine model with L1-iliac fusion and truss-DLink connectors; (6) a T1-Pelvis spine model with L1-iliac fusion, TLIF on L5-S1, and truss-DLink connectors as shown in Figure 3.1.
The procedures of model development and geometrical connections are discussed earlier in Chapter 2. The overall view of T1-Pelvis spine model with L1-iliac fusion, TLIF on L5-S1, and transverse connectors on both L2-L3 and L4-L5 is presented in Figure 4.2. In the finite element model associated with this 3D model, there are 71,330 nodes and 268,214 elements. The mechanical and material parameters are given in Table 3.1.
59
60 a). Transverse connectors
on L1-L2 and L4-L5 b). Transverse connectors on L1-L2 and L4-L5 with TLIF on L5-S1
c). Truss connector
d). Truss connector with
TLIF on L5-S1 e). Truss-DLink connectors f). Truss-DLink connectors with TLIF on L5-S1
61
62
Table 3.1. Material and mechanical properties used in connector study
Component Element type
Young’s Modulus (MPa) Cross-section (mm2)
Poisson’s ratio
Cortical bone Shell 12000 - 0.3
Trabecular bone Solid 100 - 0.2
Annulus fibrosus Solid Parametric Study - 0.3
Posterior elements Solid 3500 - 0.25
Ligaments Anterior longitudinal Posterior longitudinal Intertransverse Interspinous Ligamentum flavum Capsular Supraspinous Spring 7.8(<12%) 20(>12%) 10(<11%) 20(>11%) 10(<18%) 58.7(>18%) 10(<14%) 11.6(>14%) 15(<6.2%) 19.5(>6.2%) 7.5(<25%) 32.9(>25%) 8(<20%) 15(>20%) 63.7 20.0 1.8 40.0 40.0 30.0 30.0 - - - - - - -
Sacrum Solid 12000 - 0.3
Fusion rods (Cobalt) Solid 209000 - 0.31 Fusion screws
(Titanium)
Solid 116000 - 0.32
Interbody device (PEEK)
Solid 3800 - 0.3
63
3.3 Posterior constructs analysis
In this chapter, all six models are analyzed under extension, flexion, and torsion motions. For those models with L4-L5 and L5-S1 discs intact, sensitivity analysis is conducted by varying the Young's modulus of both intervertebral discs parametrically with respect to disc stiffness. For models with TLIF implanted on L5-S1, L4-L5 disc property is varied to simulate the disc degeneration process. The maximum rod stress resulted are collected to study the trends.
64
Figure 3.3. Maximum rod stress (MPa) on L1-iliac fusion models with transverse connector during disc degeneration in flexion motion
50 60 70 80 90 100 110 120 130 L4-L5 disc set as 1 MPa L4-L5 disc set as 2 MPa L4-L5 disc set as 3 MPa L4-L5 disc set as 4 MPa L4-L5 disc set as 20 MPa L4-L5 disc set as 200 MPa L4-L5 disc set as 3000 MPa R od St re ss (MP a)
L4-L5 disc property
L1-iliac fusion with transverse connector (flexion)
65
Figure 3.4. Maximum rod stress (MPa) on L1-iliac fusion models with transverse connector during disc degeneration in extension motion
40 50 60 70 80 90 100 110 120 130 L4-L5 disc set as 1 MPa L4-L5 disc set as 2 MPa L4-L5 disc set as 3 MPa L4-L5 disc set as 4 MPa L4-L5 disc set as 20 MPa L4-L5 disc set as 200 MPa L4-L5 disc set as 3000 MPa R od St re ss (MP a)
L4-L5 disc property
L1-iliac fusion with transverse connector (extension)
66
Figure 3.5. Maximum rod stress (MPa) on L1-iliac fusion models with transverse connector during disc degeneration in torsion motion
70 72 74 76 78 80 82 84 86 L4-L5 disc set as 1 MPa L4-L5 disc set as 2 MPa L4-L5 disc set as 3 MPa L4-L5 disc set as 4 MPa L4-L5 disc set as 20 MPa L4-L5 disc set as 200 MPa L4-L5 disc set as 3000 MPa R od St re ss (MP a)
L4-L5 disc property
L1-iliac fusion with transverse connector (torsion)
67
68
Figure 3.6. Maximum rod stress (MPa) on L1-iliac fusion models with truss connector during disc degeneration in flexion motion
45 55 65 75 85 95 105 115 125 135 L4-L5 disc set as 1 MPa L4-L5 disc set as 2 MPa L4-L5 disc set as 3 MPa L4-L5 disc set as 4 MPa L4-L5 disc set as 20 MPa L4-L5 disc set as 200 MPa L4-L5 disc set as 3000 MPa R od St re ss (MP a)
L4-L5 disc property
L1-iliac fusion with truss connector (flexion)
69
Figure 3.7. Maximum rod stress (MPa) on L1-iliac fusion models with truss connector during disc degeneration in extension motion
40 50 60 70 80 90 100 110 120 130 L4-L5 disc set as 1 MPa L4-L5 disc set as 2 MPa L4-L5 disc set as 3 MPa L4-L5 disc set as 4 MPa L4-L5 disc set as 20 MPa L4-L5 disc set as 200 MPa L4-L5 disc set as 3000 MPa R od St re ss (MP a)
L4-L5 disc property
L1-iliac fusion with truss connector (extension)
70
Figure 3.8. Maximum rod stress (MPa) on L1-iliac fusion models with truss connector during disc degeneration in torsion motion
50 55 60 65 70 75 80 L4-L5 disc set as 1 MPa L4-L5 disc set as 2 MPa L4-L5 disc set as 3 MPa L4-L5 disc set as 4 MPa L4-L5 disc set as 20 MPa L4-L5 disc set as 200 MPa L4-L5 disc set as 3000 MPa R od St re ss (MP a)
L4-L5 disc property
L1-iliac fusion with truss connector (torsion)
71
72
Figure 3.9. Maximum rod stress (MPa) on L1-iliac fusion models with truss and DLink connector during disc degeneration in flexion motion
45 55 65 75 85 95 105 115 125 135 L4-L5 disc set as 1 MPa L4-L5 disc set as 2 MPa L4-L5 disc set as 3 MPa L4-L5 disc set as 4 MPa L4-L5 disc set as 20 MPa L4-L5 disc set as 200 MPa L4-L5 disc set as 3000 MPa R od St re ss (MP a)
L4-L5 disc property
L1-iliac fusion with truss and DLink connector (flexion)
73
Figure 3.10. Maximum rod stress (MPa) on L1-iliac fusion models with truss and DLink connector during disc degeneration in extension motion
40 50 60 70 80 90 100 110 120 130 L4-L5 disc set as 1 MPa L4-L5 disc set as 2 MPa L4-L5 disc set as 3 MPa L4-L5 disc set as 4 MPa L4-L5 disc set as 20 MPa L4-L5 disc set as 200 MPa L4-L5 disc set as 3000 MPa R od St re ss (MP a)
L4-L5 disc property
L1-iliac fusion with truss and DLink connector
(extension)
74
Figure 3.11. Maximum rod stress (MPa) on L1-iliac fusion models with truss and DLink connector during disc degeneration in torsion motion
45 50 55 60 65 70 75 L4-L5 disc set as 1 MPa L4-L5 disc set as 2 MPa L4-L5 disc set as 3 MPa L4-L5 disc set as 4 MPa L4-L5 disc set as 20 MPa L4-L5 disc set as 200 MPa L4-L5 disc set as 3000 MPa R od St re ss (MP a)
L4-L5 disc property
L1-iliac fusion with truss and DLink connector (torsion)
75
The maximum rod stresses among three different posterior connector structures are compared in Figure 3.12-3.14. It is reported that the traditional connectors are quite effective at providing spinal support and increasing rigidity, especially torsional rigidity. However, hardware breakage are often caused by high stresses induced on rod-screw constructs.
76
Figure 3.12. Maximum rod stress (MPa) comparison among different connectors during disc degeneration in flexion motion
0 20 40 60 80 100 120 L4-L5 disc set as 1 MPa L4-L5 disc set as 2 MPa L4-L5 disc set as 3 MPa L4-L5 disc set as 4 MPa L4-L5 disc set as 20 MPa L4-L5 disc set as 200 MPa L4-L5 disc set as 3000 MPa Ro d s tre ss (M Pa )
L4-L5 disc property
Rod stress comparison (flexion)
L1-iliac fusion with transverse connector
L1-iliac fusion with truss connector
77
Figure 3.13. Maximum rod stress (MPa) comparison among different connectors during disc degeneration in extension motion
0 20 40 60 80 100 120 L4-L5 disc set as 1 MPa L4-L5 disc set as 2 MPa L4-L5 disc set as 3 MPa L4-L5 disc set as 4 MPa L4-L5 disc set as 20 MPa L4-L5 disc set as 200 MPa L4-L5 disc set as 3000 MPa Ro d s tre ss (M Pa )
L4-L5 disc property
Rod stress comparison (extension)
L1-iliac fusion with transverse connector
L1-iliac fusion with truss connector
78
Figure 3.14. Maximum rod stress (MPa) comparison among different connectors during disc degeneration in torsion motion
0 10 20 30 40 50 60 70 80 90 L4-L5 disc set as 1 MPa L4-L5 disc set as 2 MPa L4-L5 disc set as 3 MPa L4-L5 disc set as 4 MPa L4-L5 disc set as 20 MPa L4-L5 disc set as 200 MPa L4-L5 disc set as 3000 MPa Ro d s tre ss (M Pa )
L4-L5 disc property
Rod stress comparison (torsion)
L1-iliac fusion with transverse connector
L1-iliac fusion with truss connector
79
Figure 3.15. Novel connector models maximum rod stress difference percentage compared to transverse connector in torsion motion
-35 -30 -25 -20 -15 -10 -5 0 L4-L5 disc set as 1 MPa L4-L5 disc set as 2 MPa L4-L5 disc set as 3 MPa L4-L5 disc set as 4 MPa L4-L5 disc set as 20 MPa L4-L5 disc set as 200 MPa L4-L5 disc set as 3000 MPa Per cen ta ge (% )
L4-L5 disc property
Rod stress difference percentage
(compared with transverse model)
L1-iliac fusion with truss connector
80
In torsion motion, Figure 3.15 shows both proposed connector structrues reduce the maximum rod stress significantly compared to transverse connector structure. If a truss connector is implemented rather than a transverse connector, the maximum rod stress can be reduced from 22.9% to 28.3%. A truss-DLink connector can help to reduce the maximum rod stress from 26.8% to 32.5% compared with the transverse connector. Approximately, adding two DLink connectors to the truss model yields another 4% to 5% deceased rod stress under torsion motions. Based on the surgical cost the related difficulites, it is recommended to use just the truss connector. However, if an additional 4% to 5% decease is very critical to certain patients, truss-DLink connectors can also be considered.
3.4 Conclusion
81
Chapter 4
82
4.1 Introduction
Intervertebral disc degeneration is a serious medical condition which sometimes necessitates spinal fusion in order to relieve the patient’s back pain and restore spinal function. Two common surgical treatments are often used for degenerative disc disease: spinal fusion and disc replacement (e.g. the interbody devices discussed in Chapter 2). However, it is widely known that spinal fusion result in increased rigidity of the spine, some loss of motion, and may possibly lead to adjacent level degeneration [54-69].
Studies have indicated that patients with spinal fusion appear to be at greater risk for adjacent segment disease, and sometimes revision surgeries are required due to the failure of adjacent discs. Hilibrand et al. [70] studied over 300 patients after fusion surgery for 10 years and found the rate of adjacent level failure was approximately 3% per year. Goffin et al. [71] reported a 92% incidence of adjacent disc degeneration after anterior fusion surgery. In Gore and Sepic's [72] study, the incidence rate is recorded as 98% in a 21-year follow-up after the surgeries. To help shed light on the possible causes of adjacent disc failure, we have used our finite element model to study how spinal fusion affects the adjacent disc stresses compared to a non-fused spine under the same loadings.. Several intervertebral discs above the fusion level (along with the immediately adjacent disc) are analyzed for three different spinal fusion constructs (covering different levels) to conduct a comprehensive study of the stresses induced in adjacent discs after spinal fusion surgery.
4.2 Development of spine fusion models
83
model with L1-iliac fusion; (3) a T1-pelvis spine model with L1-iliac fusion and a TLIF implanted at L5-S1; (4) a T1-pelvis spine model with L2-iliac fusion; (5) a T1-pelvis spine model with L2-iliac fusion and a TLIF implanted at L5-S1; (6) a T1-pelvis spine model with T10-iliac fusion; (7) a T1-pelvis spine model with T10-iliac fusion and a TLIF implanted at L5-S1(as shown in Figure 4.1).
The components and details of this noninstrumented model are provided in Chapter 2 Section 2. The rod-screw constructs are implemented to create different spinal fusion levels. The 3D T1-Pelvis spine model with L1-iliac fusion is presented in Figure 4.2. Its finite element model includes 71,330 nodes and 268,214 elements. The sensitivity analysis is conducted by varying the Young's modulus of intervertebral discs parametrically with respect to disc stiffness. The mechanical and material parameters are listed in Table 4.1.
84
a). Noninstrumented
control model b). L1-iliac fusion c). L1-iliac fusion with TLIF on L5-S1
d). L2-iliac fusion e).L2-iliac fusion
with TLIF on L5-S1 f). T10-iliac fusion with TLIF on L5-S1 g). T10-iliac fusion
85
86
Table 4.1. Material and mechanical properties used in adjacent disc study
Component Element type
Young’s Modulus (MPa) Cross-section (mm2)
Poisson’s ratio
Cortical bone Shell 12000 - 0.3
Trabecular bone Solid 100 - 0.2
Annulus fibrosus Solid Parametric Study - 0.3
Posterior elements Solid 3500 - 0.25
Ligaments
Anterior longitudinal Posterior longitudinal Intertransverse Interspinous
Ligamentum flavum Capsular
Supraspinous
Spring
7.8(<12%) 20(>12%) 10(<11%) 20(>11%) 10(<18%) 58.7(>18%) 10(<14%) 11.6(>14%) 15(<6.2%) 19.5(>6.2%) 7.5(<25%) 32.9(>25%) 8(<20%) 15(>20%)
63.7 20.0 1.8 40.0 40.0 30.0 30.0
- - - - - - -
Sacrum Solid 12000 - 0.3
Fusion rods (Cobalt) Solid 209000 - 0.31 Fusion screws
(Titanium)
Solid 116000 - 0.32