Transactions,SMiRT-23
Manchester, United Kingdom - August 10-14, 2015
Division II, Paper ID 131
EC FP7 Structural Performance of MULTI-METAL
AREVA GmbH Fracture toughness testing and interpretation on MU1
Part 1: testing
Elisabeth Keim1, Sébastien Blasset2, Andreas Seubert3, Herbert Schendzielorz3, Stefan Heußner4
1
Fracture Mechanics, AREVA GmbH, Technical Center Germany 2
Analytical Fracture Mechanics, AREVA GmbH, Technical Center Germany 3
Experimental Fracture Mechanics, AREVA GmbH, Technical Center Germany 4
Numerical Fracture Mechanics, AREVA GmbH, Technical Center Germany
ABSTRACT
The purpose of this paper is to present the testing of standard specimens taken from the dissimilar metal welds mock-ups investigated at AREVA GmbH Technical Center labs in the frame of the MULTIMETAL project. Tests on standard fracture mechanics specimens have been performed, the specimen were taken from welded plates mock-up MU1 (narrow gap DMW with Ni-52). Several crack locations have been considered according to the experience from field (WP2). Preparations of the CT specimens as well as testing and the interpretation of the results are summarized.
INTRODUCTION
Dissimilar metal welds (DMWs), such as joint welds between ferritic steels with either austenitic stainless steels or Nickel-base alloys, are commonly found in piping systems of nuclear power plants (NPPs) as well as in other industrial plants. Depending upon the specific application, these welds are usually produced using either austenitic stainless steel filler materials (electrodes) or nickel-base filler materials, manual or automatic welding process, and V grooved or Narrow gaps. Due to the large number of manufacturers and applied optimization methods, existing DMW configurations are numerous. In recent years some concerns have been raised about the reliability of DMWs, especially when the plant in focus is in operation beyond its initial design life. Integrity assessment of flaws in welds requires substantial material data like fracture toughness values, which are evaluated according to standards that are not necessarily foreseen for the weld configuration in focus. Thus, there is a need to develop a standard for toughness measurements in multi-metallic specimens. In addition harmonised procedures for defect assessment in DMWs would be advantageous. In this context the MULTIMETAL project was aimed at a good practical approach for testing, integrity and LBB analyses. Toughness is not only a material property. In general it depends on the specimen size and the type of loading. This is the reason why the standards (for homogeneous material) select the most conservative specimen in term of constraint, which is the CT specimen.
RESULTS
CT12.5 specimens are manufactured from mock-up material specifically produced for this purpose and tested at room temperature in order to determine the tearing resistance of the material combination. Besides mechanical testing, additional examination techniques such as electron micrography and 3D macroscopy are applied to investigate the material behavior. Furthermore, a numerical analysis of one of the tested CT specimens is performed to verify the applicability of the J-integral method for inhomogeneous specimens. This last numerical analysis is presented in a parent paper at the SMIRT conference.
Reception
The dissimilar metal weld coupon for extracting the specimens is provided by the French organization CEA for MU1 and EDF Septen for MU2-a. A photographic documentation of the received material sections and of its position within the entire coupon has been performed.
Figure 1: Mock ups of DMWs investigated at AREVA GmbH labs for the MULTIMETAL project
Sampling and specimens manufacturing
For MU1, six CT12.5 fracture-mechanics specimens are manufactured from the material section provided by CEA. Position, orientation and designation of the specimens are documented in the extraction plan and detailed manufacturing drawings of the CT12.5 specimen. A photographic documentation of the specimen extraction is depicted in Figure 2. Specimen manufacturing and dimensional control is performed by a subcontractor of AREVA GmbH. Three crack locations from the fusion line between Ni 52 and ferritic base material are investigated: at 0.0 mm crack located at fusion line in specimen 1 and 2, 0.5 mm (specimen 3 and 4) and 1 mm (5 and 6) from FL in Ni-5.
Figure 2: Mock ups of DMWs investigated at AREVA GmbH labs (MU1)
Metallographic investigation
The metallographic investigation of the base material 18MND5 in transverse direction indicates a relative fine grained, homogenous bainitic structure consisting of ferrite and fine distributed carbides, see Figure 3. The microstructure is typical for a quenched and tempered 18MND5. Furthermore, a longitudinal microsection was prepared, which exhibits the predominant direction of the microstructure due to the forging process.
23rd Conference on Structural Mechanics in Reactor Technology Manchester, United Kingdom - August 10-14, 2015 Division II - Fracture Mechanics and Structural Integrity
Hardness profile
Hardness measurements HV5 are performed in both base materials (ferritic and austenitic) and as hardness profiles across the weld. The average hardness of the ferritic base material 18MND5 is 206 HV5. The average hardness of the austenitic base material 316L is 159 HV5. The hardness across the weld is measured along three different lines from the austenitic base material to the ferritic base material (top, middle and root of the weld). The results of the hardness measurements along the middle line is illustrated in Figure 4.
Figure 4: Hardness measurement lines (left), HV5 results line 2 (MU1)
Fracture mechanic tests
Fracture-mechanics testing is performed on CT12.5 specimens. After fatigue pre-cracking (without side-grooves) of specimen no. 1, 2 and 3 (a0/W ratio ≈ 0.6) two 90° side-grooves (20 %) with a notch radius of 0.5 mm are milled into the specimen surface to achieve a net thickness BN = 10 mm. Specimens no. 5 and 6 have been pre-cracked with side-grooves from the beginning. Details of the crack notch and crack growth after pre-cracking for specimen with crack at fusion line can be seen in Figure 5, showing that the fusion line was met within high precision despite of the waviness of the weld.
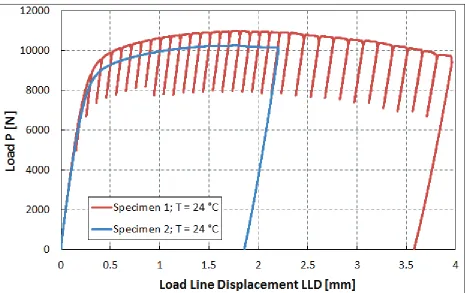
The tests are performed at room temperature on an Instron tensile testing machine with a computer control unit. The crack opening displacement is measured with a clip gage (displacement transducer) which is placed in the load line of the specimen. Specimen type and test procedure are conform to ASTM E 1820-11. The tests are performed on the specimen 1, 2, 3 and 6. Specimen 1, 3 and 6 are tested by single specimen technique (partial unloading method). Specimen 2 is tested by multi specimen technique (interrupted loading method) in order to confirm the J0.2BL value. After testing, the J-Δa curve is calculated using the regression fit (least squares) according to ASTM E 1820-11 using internal script. The load-displacement curves are recorded, see Figure 6.
Figure 6: Load line displacement record for specimen 1 and 2 (MU1)
Photo documentation during and at the end of testing has been performed. The J-Δa curves and the coefficients of the optimum regression function of the data points are shown in Figure 7. The variation of the J-Δa values (specimen no. 1 and 2) fits well and with low variation to the regression line (using M = 2 and tensile properties of Ni-52 for construction line). The visual check confirms the reliability of the compliance. For specimen 3 and 6 there is no regression fit (least squares) possible. The basic results are tabulated in Table 1.
Table 1: Basic results for MU1 specimens
Specimen Test temperature [°C]
JQ = J0.2BL
[kJ/m²]
J [kJ/m²]
1 24 441 -
2 24 - 447.7
3 24 no value -
23rd Conference on Structural Mechanics in Reactor Technology Manchester, United Kingdom - August 10-14, 2015 Division II - Fracture Mechanics and Structural Integrity
Figure 7: J-Δa curves for specimen 1 and 2 (MU1) ASTM 1820-11
Fractographic examination
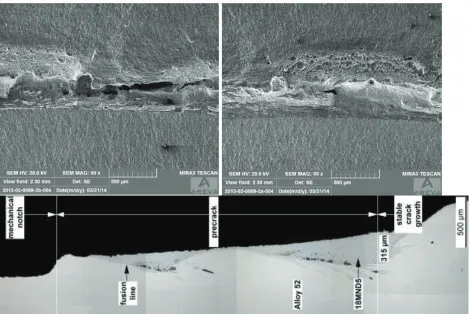
In order to characterize the fracture types and fracture features fractographic examinations by SEM are performed. Therefore, both halves (the ferritic 18MND5 and the austenitic alloy 52 side) of the CT12.5 specimen 1, 2, 3 and 6 are examined after fracture, see Figure 8.
The overview of the fracture surfaces of both halves of the specimen 1 and 2 reveals the following fracture features: notch, performed by EDM; fatigue pre-crack; stretch zone and stable crack growth zone (ca. 1.5 mm width for specimen 1), and residual fracture. The fatigue pre-crack propagates mainly in-plane along the fusion line and shows a transgranular fatigue fracture. The transition to the stable crack growth, the stretched zone, reveals a ductile transgranular fracture with some secondary cracks. The secondary cracks are elongated to the crack front and run perpendicular to the main fracture surface to Ni-52 side, see Figure 9. The zone of the stable crack growth reveals a transgranular dimple fracture. The ferritic 18MND5 side does not show as much secondary cracks as the austenitic alloy 52 side in the stable crack growth zone. In this zone the austenitic alloy 52 half exhibits much higher necking as the ferritic counterpart. Specimen 2 shows similar fracture features as specimen 1. For specimen 3 the notch was set in the alloy 52 weld metal parallel to the fusion line with the 18MND5 base metal. The notch is 0.5 mm away from the fusion line. The overview of the fracture surfaces of both halves reveals similar fracture features. The pre-crack and the residual fracture propagate mainly parallel to the fusion line. However, some regions show a jump of the crack to the fusion plane. The stretched zone and the stable crack growth zone are hardly to keep apart. The transition zone between the pre-crack and the residual fracture is characterized by a deformation rich dimple fracture with many secondary cracks running perpendicular to the fracture plane. Specimen 6 shows similar fracture features as specimen 3. In comparison to specimen 3, specimen 6 does not show a jump of the crack to the fusion line.
23rd Conference on Structural Mechanics in Reactor Technology Manchester, United Kingdom - August 10-14, 2015 Division II - Fracture Mechanics and Structural Integrity
3D macroscopy / topography
In order to reveal the 3-dimensional morphology of the fracture faces, a 3D measuring macro-scope from Keyence is used. Surfaces of both halves of the specimens 1, 2, 3 and 6 were acquired. The letters “a” and “b” in the specimen notation stand for the 18MND5 and the alloy 52 half, respectively. The pictures represent the 3D-surfaces overlayed either with the optical image, a height color coding or a mixture between the optical image and color coding. Furthermore, representative profiles along the crack propagation direction at the specimen edges and in the center are shown, see Figure 10. These profiles show how the crack propagates in the plane perpendicular to the notched surface and allow appreciating the stretch zone before ductile tearing initiation.
DISCUSSION
All testing activities are performed in the materials testing laboratory of AREVA GmbH / PTCM-G which is accredited according to DIN EN ISO/IEC 17025:2005 by Deutsche Akkreditierungsstelle GmbH (German accreditation body).
Large plastic deformation (strain) occurs in the specimen, and plastic strain is not confined to the crack tip but develops into the material with lower yield level for increasing load. Slip lines are seen during experimental testing and ductile tearing and plastic collapse are in competition. Such similar plastic deformations have been investigated by Wasylyk during ductile tearing testing of an austenitic steel with digitalized evaluation of specimen surface (316L) and tearing initiation was occurring after achieving the limit load (plastic collapse) for this tough material, this is also in line with an investigation made in the 1980’s (with ductility criteria: at least 45J according to Golembiewski) and lately in 2005, Chen: limit load (scaled on the yield strength) was reached for various types of metals while undergoing significant crack extension by intending to perform J-R curves. These results indicate that the failure of tough steels when the crack extends in a slow-stable-ductile manner is a plastic tearing problem governed essentially by material properties instead of a “fracture” problem determined by singularity or weak singularity parameters.
CONCLUSION
The size requirements of the ASTM E 1820-11 are fulfilled, even using the weakest material in terms of flow stress. However, the experiments show that CT12.5 may be too small to investigate the toughness of MU1 DMW for a crack located more than 0.5 mm from the fusion line into the Ni-52. Secondary cracks perpendicular to the initial crack plane are identified. The numerical investigation will allow us to check the ASTM E 1820-11 interpretation of the J-integral.
23rd Conference on Structural Mechanics in Reactor Technology Manchester, United Kingdom - August 10-14, 2015 Division II - Fracture Mechanics and Structural Integrity
NOMENCLATURE
a0 Initial crack length [mm]
am Machined notch [mm]
ap Final crack length [mm]
AP Plastic area [N*mm]
ASTM American Society for Testing and Materials
B Specimen thickness [mm]
b0 Length of initial ligament [mm]
BN Net specimen thickness, sidegrooves [mm]
C0 Slope at the beginning [mm/N]
Ci Slope at pop in [mm/N]
CT Compact Tension
E Young`s modulus [MPa]
f(a0/W) Form function
J J-integral [kJ/m²]
Jel Elastic component of J [kJ/m²]
Jpl Plastic component of J [kJ/m²]
Kc Critical stress intensity factor [MPa√m]
L Specimen length [mm]
LLD Load Line Displacement [mm]
P Load [N]
T Test temperature [°C]
t Test time [s]
v Displacement [mm]
W Specimen width [mm]
Δa Stable crack growth [mm]
ƞ Geometric correction factor [--]
ν Poisson`s ratio
σTS Ultimate Strength [MPa]
σYS Yield Strength [MPa]
REFERENCES
[MULTIMETAL] P Karjalainen-Roikonen, E.Keim, P.Gilles, S.Blasset “EC FP7 Structural
performance of MULTI-METAL component project overview”, PVP2013-97574
[ASTM] ASTM Standard ASTM E 1820-11
[Wasylyk]A.P Wasylyk “New insights into the competition between ductile tearing and plastic collapse in 304(L) stainless steel components” Universty of Manchester, PhD Thesis, 2012
[Golembiewski ] Golembiewski H. J., G.Vazoukis, Ductility Minimum for Application of Plastic Limit Load Concept to Failure Analysis of Structures with Imperfections, Int. J. Pres. Ves. Piping 24, p. 27 - 36 (1986)