EARTHQUAKE GROUND MOTION GENERATION FOR NUCLEAR
POWER PLANT
U.P. Singh, Varun Mishra, Faisal Dastageer, Rahul Mittal, Anshuman Singh, Santosh Khandve, B. Santosh Kumar, S.M. Ingole, A.G. Chhattre
Nuclear Power Corporation of India Ltd., Anushakti Nagar, Mumbai-400094 E-mail of corresponding author : upsingh@npcil.co.in
ABSTRACT
The Nuclear Power Plant (NPP) in India are designed for two levels of earthquake viz., Operating Basis Earthquake (OBE) (S1) and Safe Shutdown Earthquake (SSE) (S2).For these two levels of earthquake i.e. OBE (S1) & SSE (S2), it is required to specify the Site Specific Ground Motion (SSGM) from which the Design Basis Ground Motions (DBGM) is arrived at.
A detailed study of regional geology and seismotectonic features in the region of 300 km radius from site are required to be conducted to delineate the active/capable faults/lineaments. The field check study is carried out in three ranges viz., Local (5 Km), Intermediate range (50 km) and Regional (300 km). Based on the field check study, the lineaments are given a status of active/capable fault and a maximum earthquake potential (in terms of magnitude, epicenter distance and depth of focus) which is used in deriving the ground motion for SSE (S2) level of earthquake. The ground motion can be determined deterministically by two methods viz. (i.a) in the areas of high seismicity using the recorded time histories at the site or from a site having similar geological and seismological features, (i.b) using attenuation correlations developed for the region using recorded time histories, (ii.a) in the areas of low seismicity using the synthetic time histories, (ii.b) using the attenuation correlation developed for the region using the synthetic time histories.
In the time history based method using actual recorded or synthetic if not many recorded time histories are available, i.e. for stable continental region of India, normalized mean plus one sigma spectral shapes can be determined for controlling level of earthquake. The aim of generating the normalized mean plus one sigma spectra for such a range of S2 level of earthquake time histories is to generate a mean plus one standard deviation spectra i.e. to define Dynamic Amplification Factors (DAF) with 84% non exceedance probability at all the frequencies and not only the maximum DAF. The normalized mean plus one sigma spectral shapes can then be anchored to the weighted mean PGA derived using number of correlations suitable for the geology and tectonics of the region for the controlling earthquakes. The SSGM can also be generated by using the synthetic time histories for all the faults in the vicinity of the plant for their strike, dip, depth of focus and the source, path & local site amplification parameters and then one can take the envelope of these as the SSGM of the plant. The DBGM is obtained from the SSGM by joining the peaks of the SSGM and smoothening. The paper brings out the procedure for conducting field check study, determination of the ground motion by deterministic method and also a case study of field check carried out and generation of ground motion for KAPP-3,4 Nuclear Power Plant site.
Key words: Field check, Active fault, Controlling earthquake, Synthetic time history, Calibration
INTRODUCTION
As safety is a prime concern in nuclear industry, natural phenomenon viz. earthquake, flood, storm and tsunami are considered in the design to ensure the plant safety during and after the events. The Nuclear Power Plants (NPPs) are designed to withstand the two levels of earthquake viz., Operating Basis Earthquake (OBE) (S1) and Safe Shutdown Earthquake (SSE) (S2). The OBE (S1) level ground motion corresponds to the maximum level of ground motion which has been experienced by the site in the past. The Structures, Systems & Equipment (SS&E) in a NPP are designed for OBE level of earthquake so that in case the earthquake level exceeds the OBE level of earthquake, it is required to shut down the plant. It is required to demonstrate that the SS&Es are within the OBE allowable before the restart of the plant. Whereas, the SSE (S2) level ground motion corresponds to the maximum earthquake potential of the (site) region. SSE represents the maximum level of ground motion to be used for design of safety related structures, systems and equipment (SS&E) of NPP. For these two levels of earthquake i.e. OBE (S1) & SSE (S2), it is required to specify the Site Specific Ground Motion (SSGM) from which the Design Basis Ground Motions (DBGM) is arrived at.
delineate the faults/lineaments based on the landsat imageries, as given in Seismotectonic Atlas of India and its environs, gravity anomaly map and also based on Micro Earthquake (MEQ) and Earthquake data (historical as well as recorded) in the region. Based on the field check study, the lineaments are given a status of active/capable fault and a maximum earthquake potential (in terms of magnitude) and depth of focus are assigned. For determining the ground motion, a SSE (S2) level of earthquake is required to be determined in terms of Maximum earthquake potential (in terms of Magnitude, Depth of focus, and Epicentral distance (Closest distance of the active fault) this is referred a controlling earthquake for that site..
There are two basic methods used to estimate ground motion in engineering practice. In the first method, known as Deterministic Seismic Hazard Analysis or DSHA, ground motion is estimated from a given set of seismological parameters, such as earthquake magnitude and the distance from the earthquake rupture zone to the site of interest. In the second method, referred to as Probabilistic Seismic Hazard Analysis or PSHA, ground motion is estimated statistically using all possible earthquake sources and magnitudes together with their expected probabilities of occurrence.
The ground motion can be determined deterministically by two methods viz., (i.a) in the areas of high seismicity by using the recorded time histories at the site or from a site having similar geological and seismological features, (i.b) using attenuation correlations developed for the region using recorded time histories; (ii.a) in the areas with low seismicity where recorded time histories are not available, by using synthetic time histories, (ii.b) using the attenuation correlation developed for the region using the synthetic time histories generated by using ground motion parameters viz. stress drop, geometric attenuation, inelastic attenuation and kappa and site amplification.
Except NAPS, the Indian nuclear plant sites viz. TAPS, RAPS, MAPS, KAPS, Kaiga, Kudankulam are located in the tectonically stable region, however, the earthquake records for these region are very few. The only methods to predict the ground motion is to generate the ground motion using stochastic based synthetic ground motion generation or by using attenuation correlations available for similar geology and seismotectonic conditions as of the site.
The paper describes the application of dynamic corner frequency based stochastic finite fault model and its parameters in detail which is used to generate the ground motion for Indian Nuclear site at Kakrapar, India. The paper covers parameters used for generation of synthetic ground motion for Kakrapar site. The determination of ground motion parameters requires expertise in the field of geology, seismology and engineering as these parameters control the spectral shape, spectral amplitude and the frequency contents. The paper also covers the importance of these parameters on ground motion for a particular site. As there are large uncertainties in the parameters, parametric variation on the critical ground motion parameters has been taken in ground motion generation. The procedure for generating SSGM and DBGM is also discussed in the paper.
FIELD CHECK STUDY TO CONFIRM ACTIVE AND CAPABLE FAULT WITHIN 300KM RADIUS AROUND NUCLEAR FACILITY
For the design of a nuclear power plant, a study of regional geology and seismotectonic features in the region of 300 km radius from site are required to be conducted to delineate the active and capable faults to arrive at Design Basis Ground Motion (DBGM).The lineaments/faults are delineated based on the landsat imageries, Seismotectonic Atlas of India and its environs (GSI, 2000, scale: 1:1,000,000), gravity anomaly map and also based on MEQ and EQ data in the region. The lineaments defined from these sources are taken up for field check to give a status of active/capable fault using the map prepared by Geological Survey of India (GSI) on a 1:50,000 scale. The field check study is carried out at three levels; study of Local site, Intermediate range, and Regional scale. The local site investigation covers an area of radial distance 5 km and the study is carried out at a geological map scale of 1:5,000/1:10,000.The intermediate range investigation covers a radial distance of 50 km from the site and the study is carried out using a map prepared to a scale of 1:25,000/1:50,000. The regional investigation covers a radial distance of 300 km from the site and the study is carried out using a map at scale of 1:250,000/1:100,000.
Active/Capable fault within a radius of 300 km radius
Active fault: The active fault is confirmed on the basis of geological data. A fault or a tectonic structure is
considered active if,
1. It has shown movement at or near the surface, within the past 35,000 years or movement of a recurring nature within the past 500,000 years.
2. It has generated micro and macro-seismicity.
Capable fault: A fault which may not be an active fault i.e. it is a dead fault, but if it has a structural
relationship with an active fault identified by criteria (1) and (2) above, such that movement of the active fault can reasonably be expected to be accompanied by movement of the dead fault is called as capable fault.
The meaning of criteria is that, a fault which is delineated by satellite imagery or by gravity anomaly map, but is confirmed to be a dead fault by field check is required to be studied. If such dead fault is so long that it extend up to an active fault delineated by criteria (1) & (2) above is considered as capable fault.
The fault being active or otherwise is confirmed by
i) Looking at the terraces of the rivers and nallas which are crossing the lineament for any movement in the quaternary deposits (terraces) which are the deposits of 2.0 million of age. The single movement of 35,000 years or recurring movements within 500,000 year are searched during the field check. A fault on which a movement has occurred recently i.e. in last 2 million years is likely to occur in the future
(ii) Apart from studying the movement in quaternary sediments along the nalla/river sections crossing the lineament/fault, other field evidences such as juxtaposition of dissimilar materials & missing or repeated strata, truncation of strata or structures, slickenside, gouge of fault breccias, offset drainages, tilting or changes in elevation of terraces, topographic scarps/triangular facets or ridges, anomalous stream gradients, subsurface information from dug well core with continuity of dykes/veins across lineaments etc. should also be carefully looked at for establishing the fault to be active or otherwise.
Rejection criterion for a plant site
If such an active or a capable fault exists at a plant site within a 5 km radius, the plant is to be rejected, as it can generate an earthquake very close to the plant and may have a surface rupture or surface deformation such as faulting or folding just below the plant for which plant cannot be designed.
ASSIGNING MAXIMUM EARTHQUAKE POTENTIAL, EPICENTER DISTANCE AND DEPTH OF FOCUS
After delineating the active/capable faults within a region of 300 km, for deriving the seismic parameters, it is required to give the maximum earthquake potential in terms of magnitude to each of active/capable faults and the corresponding depth of focus. For this, national experts are consulted who have worked in the region around the plant site to assign the maximum earthquake potential and depth of focus for each of the active/capable fault.
While assigning the maximum earthquake potential to each of the active/capable fault, the general practice is to increase the magnitude of the earthquake which has occurred in the vicinity of the active/capable fault by one intensity equivalent i.e. by 0.43 M and 0.65 M for stable continental region and active tectonic region respectively.
The depth of focus for the earthquake is based on the characteristic of the regional earthquakes which have occurred in the vicinity.
Historical & Recorded earthquake data
The seismotectonic database comprises of a tectonic map showing lineaments of length greater than a few kilometers, which are considered to be surface expressions of identified or suspected, geological faults. It also comprises of the geological information to divide the region into tectonic provinces.
In India, All the historical & the recorded earthquakes in a radius of 300 km are collected from the national and local agencies. Similarly, the Micro Earthquake (MEQ) data are taken from the agency which is operating the seismic stations in the zone of plant site.
An extensive field check study has been carried out to find out any active/capable fault around the Kakrapar site. It is found that Tapi North conjugate fault to the west of Nandurbar and to the north of KAPP site at 20 km epicentral distance is non -neotectonic.This has been seen as a lineament in satellite imagery. As this dead or inactive fault extends over 160 Km and intersects with the Tapi North fault which is active, has been given a category of capable fault with maximum potential of 6 Magnitude with depth of focus of 15 km and epicentral distance of 20 km. It is also refereed as controlling earthquake for design of nuclear facilities at kakarapara site. Faults and their magnitude potential, minimum epicenter distance and depth of focus for KAPP site is brought out in Table-1. Seismotectonic and lineament Map of the area around Kakrapar site within 300 km is shown in Figure 1.
Table1: Design Basis earthquake parameters to be adopted for various faults in the Kakrapar region
Sr. No. Name of lineament
Maximum Magnitude Adopted
Depth
Shortest Distance to
site km
1 Conjugate Tapi North 6 15 20
2 Tapi North (Rift boundary fault) 6.5 30 130
3 Barwani Sukta fault 6.5 30 180
4 Cambay Fault 6 15 80
5 West coast fault 5 10 ~ 100
Controlling Earthquake 6 15 20
Figure 1: Seismotectonic and lineament Map of the area
STOCHASTIC SIMULATION USING FINITE-FAULT MODEL BASED ON A DYNAMIC CORNER FREQUENCY
In the stochastic approach, the seismic signal is represented with a random Gaussian noise superimposed on a known (deterministic) fourier amplitude spectrum of the ground motion. The shear-wave amplitude spectrum in the frequency domain is the product of filter functions representing the source, propagation, and site effects. The simplest approach is to model the earthquake source as a stochastic point source with a ω2 spectrum (Aki, 1967; Brune, 1970; Boore, 1983). However, for large earthquakes, point-source
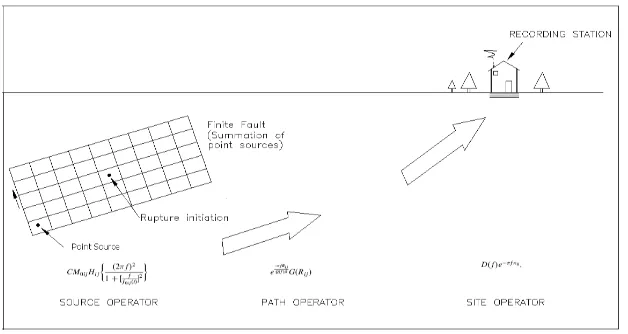
modeling does not include finite-fault effects such as rupture geometry, slip inhomogeneity, and source directivity, which can significantly affect the duration, frequency content, and amplitude of simulated ground motions. As a result, stochastic finite-fault models have been developed to simulate records of large earthquakes (Beresnev and Atkinson, 1997, 1998a [1, 2]). In the finite-fault approach, the rectangular fault plane is divided into small sub-faults, and each sub-fault is considered to be a point source. The rupture starts at the hypocenter and propagates kinematically until each sub-fault is triggered. The regional dependence of duration and amplitude on distance are employed in the simulations to model the propagation effects. Finally the ground motion at a receiver from the entire fault is obtained by summing up the contribution from each sub-fault with a proper time delay. Stochastic finite-fault method has been verified by numerous studies to estimate reliable ground motions of (actual or scenario) earthquakes in various tectonic settings. The schematic of the finite fault model is shown in Figure 2.
One limitation of the traditional finite-fault model is the constraint on the number of sub faults and the dependence of the total radiated energy on the sub fault size. To overcome this drawback, Motazedian and Atkinson [4] introduced the dynamic corner frequency approach to the stochastic finite-fault model of Beresnev and Atkinson [2] where the dynamic corner frequency f0ij of the i,jth sub fault at any time t is defined as a
function of the total number of ruptured sub faults at that time. In the new approach, as the corner frequency of sub faults decreases with time, radiated energy at high frequencies also decreases, thus a factor is applied to scale the high- frequency spectral level of the sub-faults to conserve the total energy. The ground motion of the entire fault is estimated by summing up the contributions of each sub-fault using a relative delay time Δtij for the
wave radiated from the i,jth fault to reach the observation point, where nl and nw are the number of
sub-faults along the length and width of the main fault.
Finite fault model based on dynamic corner frequency is formulated in a computer program EXSIM [4] .This program is used to simulate the ground motions for Kakrapar site. The term EXSIM comes from EXtended fault SIMulation. EXSIM is the new version of FINSIM (FINite fault SIMulation program), which was developed by Beresnev and Atkinson [2]. Simulations based on EXSIM program produce more realistic time series than those based on FINSIM as effect of sub-fault on the Fourier spectra is subsided by adding dynamic corner frequency parameter.
Validation of the EXSIM (Extended fault Simulation) Program
Validation of the EXSIM program used for the generation of synthetic ground motion has been carried out by matching the synthetically generated spectra with the recorded spectra of Bachau & Saguenay earthquake (ENA site in Canada) for frequencies up to 100 Hz. As there is a large uncertainty in evaluating parameters defining source, path and local site effect, random time histories are to be generated keeping all parameters same in the dynamic corner frequency based model (using EXSIM program). Mean plus One Sigma and Mean minus One Sigma of the response spectra of the time histories are computed and compared with spectra of the recorded time history. It is found that four randomly generated synthetic time histories are sufficient for the spectra of recorded time history to fall between M+sigma and Mean–sigma spectra of the simulated time histories. For the purpose of calibration, synthetic ground motions have been generated for Saguenay (Canada ENA site) hard rock site and Bhachau (India) hard rock site. The comparison of spectra of recorded and synthetically generated time histories is shown in Figure 3 & 4.
Figure 3: Comparison of recorded Spectra with
Synthetically generated spectra for Saguenay Figure 4Synthetically generated spectra for Bhachau: Comparison of recorded Spectra with
SSGM & DBGM GENERATION FOR KAPP SITE
The Site Specific Ground motion is defined by a spectral shape and a weighted Peak Ground Acceleration (PGA) for the site.
Calculation of Weighted PGA
Attenuation correlations developed for stable continental region of India or similar regions in the world with appropriate weightage factor have been used for calculation of PGA. In consultation with the national experts, weightage factor were assigned for different correlations after discussion with the national experts. Mean PGA calculated using different attenuation correlations along with their weightage factors are given in Table 4. As the controlling Fault is Tapi North conjugate fault, the weighted PGA has been calculated for this controlling fault for maximum earthquake potential of 6, epicenter distance 20 km & depth of focus 15 km. The calculated weighted mean PGA for Kakarapra site is 0.197g.
Table 4: Weighted Mean PGA calculated from different Attenuation correlation
Sr. No. correlation PGA (Mean) Weightage Weighted PGA (g)
1 Silva (2002) 0.189 0.09 0.017
2 Campbell (2003) 0.257 0.125 0.032
3 Toro-1997 0.169 0.16 0.027
4 Atkinson & Boore (2006) (For 140 bar) 0.143 0.125 0.018
5 Atkinson & Boore (2006) (For 200 bar) 0.187 0.125 0.023
6 Raghukanth & Iyengar (2004) 0.214 0.25 0.053
7 Tavakoli-Pezeshk (2005) 0.212 0.125 0.027
Derivation of Spectral Shape, SSGM and DBGM
The controlling fault for Kakrapar site is Tapi North conjugate fault and the maximum potential of controlling earthquake is magnitude of 6 at 20 km epicenter distance with depth of focus 15 km. Based on this, the synthetic ground motions for KAPP-3&4 were generated using the regional and site specific ground motion parameters viz. stress drop, geometric attenuation, quality factor, crustal amplification factor (CAF), high frequency filter parameter kappa and local site amplification (LSAF)[5]. As there are large uncertainties in defining the ground motion parameters, a parametric variation of these parameters is done to account for the uncertainty in the ground motion. The 216 time histories (54x4) have been generated, with 4 random time histories for each combination of parametric variation of stress drop (140, 170 and 200 bar), Kappa (0.01, 0.013, 0.016), Q (84f0.65, 118f0.65, 152f0.65) and geometric attenuation (R-1 and R-1.3) for the controlling earthquake magnitude.
As the synthetic ground motion time series generated by EXSIM program are not base line corrected inside the EXSIM program, it requires base line correction outside the EXSIM program. Base line corrections have been applied to all the 216 time histories and a normalized mean + one sigma spectral shape was arrived by using the 216 synthetic time histories plus 10 recorded time histories. This spectral shape is then multiplied with weighted mean PGA of 0.197g to arrive at SSGM. After the base line correction of time histories, the SSGM spectrum follows constant acceleration value i.e. peak ground acceleration (PGA) at high frequency and a constant displacement i.e. peak ground displacement (PGD) in low frequency which is the expected behaviour of the response in both high frequency and low frequency regions.
The DBGM is derived by smoothening of the SSGM by joining peaks and is expressed by several straight lines on a log (velocity) vs. log (frequency) plot. The DBGM for 5% damping for SSE is shown in Figure 5. This derived DBGM completely envelops the SSGM at all the frequencies of engineering interest from 0.1 Hz to 100.0 Hz. The spectrum compatible time history has been generated. The compatible time history is shown in Figure 6.it is found that the generated compatible time history is higher than the DBGM in the frequency range of interest (i.e. 0.189 Hz to 100 Hz) and meets the requirement of AERB SG/S-11 [9], ASCE-4(98) [10] and AERB/SG/D23 [11].
KAPP-3&4 : DBGM 5% Damping (SSE, HOR)
0.00 0.10 0.20 0.30 0.40 0.50 0.60
0.1 1.0 10.0 100.0
Frequency(Hz)
A
cc
eler
at
io
n
(g
)
DBGM (5%)KAPP-3&4 : Com parison of Com patibel Tim e History Based Spectrum (THRS) w ith DBGM (5%
Dam ping, SSE, HOR)
0.00 0.10 0.20 0.30 0.40 0.50 0.60
0.1 1.0 10.0 100.0
Frequency(Hz) A c c e le ra ti o n (g ) THRS DBGM
Figure 5: DBGM of 5% damping SSE for Kakrapar site Figure 6: Comparison of Spectrum compatible Time history with DBGM
CONCLUSION
Based on the above study and the extensive work in formulating the procedure for ground motion generation, following conclusion can be made:
1. Field check study is necessary to confirm or delineate the active/capable faults and to define the maximum potential of earthquake.
2. Weighted mean PGA scheme is a correct way to estimate the PGA of the site.
3. Stochastic finite falut model based on dynamic corner frequency model based is good enough to generate the synthetic ground motion for the sites where earthquake records are not available.
5. Base line correction is required for the time history generated by synthetic method. 6. Smoothening of SSGM is required to generate DBGM which is used for NPP design. 7. The generated spectrum compatible time history should envelope the DBGM.
ACKNOWLEGMENT
The authors wish to thank to Dr. J.R. Kayal, Ex. Dy. Director General, Geological Survey of India & Emeritus Professor, CSIR ,Dr. B.K. Rastogi, Director General, Institute of Seismological Research, Gandhi Nagar, Gujarat, Dr. Dhanjay Yedekar, Member, Maharashtra Public Service Commission, Dr. S.K. Biswas, Ex. General Manager, Explorations, ONGC, Shri Y.R. Satyasaradhi, Atomic Minerals Directorate, Hyderabad for field check study and arriving at the maximum potential earthquake for Kakrapar site.
The authors would also wish to thank all the national experts viz. Prof. R.N. Iyengar, Ex. IISC, Bangalore, Dr. B. K. Rastogi, ISR, Gandhinagar, Prof. P. Banerjee, Civil Engg. Dept., IIT, Bombay, Prof. Ashok Kumar, Dept. of Earthquake Engineering, IIT Roorkee, Dr. S.T.G. Raghukanth, Civil Engg. Dept., IIT, Chennai, Dr. Debasish Roy, Civil Engg. Dept., IIT Kharaghpur, Dr. Prantik Mandal, Scientist, NGRI, Hyderabad, Dr. Sumer Chopra, Scientist, ISR, Gandhinagar who helped in deciding the ground motion parameters for generating synthetic ground motion.
REFRENCES
[1] Beresnev, I., and G. M. Atkinson (1997), ―Modeling finite-fault radiation from the ωn spectrum‖, Bull.
Seismo. Soc. Am., Vol. 87, 67–84.
[2] Beresnev, I., and G. M. Atkinson (1998a), ―FINSIM—a FORTRAN program for simulating stochastic
acceleration time histories from finite faults‖, Seism. Res. Lett., 69, 27–32.
[3] Boore, D. M., and W. B. Joyner (1997), ―Site amplifications for generic rock sites‖, Bull. Seismol. Soc.
Am., Vol 87, 327–341.
[4] Motazedian, D., and G. M. Atkinson (2005), ―Stochastic Finite-Fault Modeling Based on a Dynamic
Corner Frequency‖, Bull. Seismol. Soc. Am. , Vol. 95, 995–1010.
[5] Sumer Chopra, Dinesh Kumar& Bal Krishna Rastogi (2010), ―Estimation of strong ground motions
for 2001Bhuj(Mw 7.6) ,India earthquake‖ , Pure and Applied Geophysics.
[6] F.St-Laurent (2000), ―
The Saguenay, Quebec, Earthquake
Lights of November1988-January1989 - A comparative study with reference to the geoatmoshpheric lights classification proposed by Montandon in 1948 and description put forward by Yasui in 1968‖, Seism. Res. Lett., Vol. 71, No. 2, 160-174.
[7] Igor A. Beresnev and Gail M. Atkinson (1999), ―Generic finite fault model for ground motion
prediction in Eastern North America‖, Bull. Seism. Soc.Am., Vol. 89, No. 3, pp, 608-625.
[8] Beliz Ugurhan and Aysegul Askan (2010), ―Stochastic Strong Ground Motion Simulation of the 12
November 1999 Düzce (Turkey) Earthquake Using a Dynamic Corner Frequency Approach‖, Bulletin of the Seismological Society of America, Vol. 100, No. 4, pp. 1498–1512.
[9] AERB SG/S-11 (1990), Atomic Energy Regulatory Board, India: ―Seismic Studies and Design Basis
Ground Motion for Nuclear Power Plant Sites‖.
[10]ASCE-4 (98), American Society of Civil Engineers: ―Seismic Analysis of Safety-Related Nuclear
Structures and Commentary‖.
[11]AERB/SG/D23 (2007), Atomic Energy Regulatory Board, India: ―Seismic Qualification of Structures,