Scholarship at UWindsor
Scholarship at UWindsor
Electronic Theses and Dissertations Theses, Dissertations, and Major Papers
2016
A Comparative Study of Academic Networks in Computer Science
A Comparative Study of Academic Networks in Computer Science
and Physics
and Physics
Junyuan Xiong
University of Windsor
Follow this and additional works at: https://scholar.uwindsor.ca/etd
Recommended Citation Recommended Citation
Xiong, Junyuan, "A Comparative Study of Academic Networks in Computer Science and Physics" (2016). Electronic Theses and Dissertations. 5772.
https://scholar.uwindsor.ca/etd/5772
This online database contains the full-text of PhD dissertations and Masters’ theses of University of Windsor students from 1954 forward. These documents are made available for personal study and research purposes only, in accordance with the Canadian Copyright Act and the Creative Commons license—CC BY-NC-ND (Attribution, Non-Commercial, No Derivative Works). Under this license, works must always be attributed to the copyright holder (original author), cannot be used for any commercial purposes, and may not be altered. Any other use would require the permission of the copyright holder. Students may inquire about withdrawing their dissertation and/or thesis from this database. For additional inquiries, please contact the repository administrator via email
Networks in Computer Science and
Physics
By
Junyuan Xiong
A Thesis
Submitted to the Faculty of Graduate Studies through the School of Computer Science in Partial Fulfillment of the Requirements for
the Degree of Master of Science at the University of Windsor
Windsor, Ontario, Canada
2016
c
by
Junyuan Xiong
APPROVED BY:
Dr. Kevin W Li Odette School of Business
Dr. Alioune Ngom School of Computer Science
Dr. Jianguo Lu, Advisor School of Computer Science
I hereby certify that I am the sole author of this thesis and that no part of this
thesis has been published or submitted for publication.
I certify that, to the best of my knowledge, my thesis does not infringe upon
anyones copyright nor violate any proprietary rights and that any ideas, techniques,
quotations, or any other material from the work of other people included in my
thesis, published or otherwise, are fully acknowledged in accordance with the standard
referencing practices. Furthermore, to the extent that I have included copyrighted
material that surpasses the bounds of fair dealing within the meaning of the Canada
Copyright Act, I certify that I have obtained a written permission from the copyright
owner(s) to include such material(s) in my thesis and have included copies of such
copyright clearances to my appendix.
I declare that this is a true copy of my thesis, including any final revisions, as
approved by my thesis committee and the Graduate Studies office, and that this thesis
Academic networks derived from research papers, in particular citation and
co-author networks, have been studied widely. Although networks in an individual
discipline particularly physics have been studied substantially, the difference across
different disciplines remains unclear. This thesis shows that networks generated in
computer science differ greatly the networks in Physics. The data used in our
exper-iment contain more than two million papers in DBLP and half a million papers in
Physical Review journals. We observe that both citation networks can be classified
as scale-free networks. Papers in DBLP has a shorter life than PR. And physicists
collaborate more closely than computer scientists in both citation and co-author
net-works. Collaborations evolve over time in both disciplines. For the ranking of papers,
we find that the traditional PageRank algorithm is not appropriate for citation
net-works. We investigate the small-world characteristics in both kinds of networks in
I would like to present my gratitude to my supervisor Dr. Jianguo Lu for his
valuable assistance and support during the past two years.
I also would like to express my appreciation to Dr. Kevin W Li, Dr. Alioune
Ngom and Dr. Dan Wu. Thank you all for your valuable comments and suggestions
to this thesis.
I also thank Mark Doyle for providing APS metadata and citation data for Physical
Review Journals, and Jie Tang et.al. for extracting and providing citation data for
DBLP.
Meanwhile, I want to thank my lab-mates for helpful discussions and advice.
Finally, I thank my parents, my boyfriend and my friends who give me consistent
DECLARATION OF ORIGINALITY III
ABSTRACT IV
AKNOWLEDGEMENTS V
LIST OF TABLES VIII
LIST OF FIGURES IX
I Introduction 1
1 Main results in citation networks . . . 2
2 Main results in co-author network . . . 3
II Review of The Literature 5 1 Citation Network . . . 5
1.1 How popular is your paper? An empirical study of the citation distribution . . . 5
1.2 Citation Statistics From More Than a Century of Physical Review 6 2 Co-author Network . . . 7
2.1 Scientific collaboration networks. I. Network construction and fundamental results . . . 7
3 Citation and Co-authorship Network . . . 9
3.1 Co-authorship and citation patterns in the Physical Review . 9 3.2 The structure and analysis of nanotechnology co-author and citation networks . . . 11
4 Summary . . . 12
III Dataset 14 1 DBLP . . . 14
2 Physical Review(PR) . . . 15
3 Comparison of two datasets . . . 16
IV Citation Network 17 1 Degree Distribution . . . 17
1.1 In-degree distribution . . . 18
1.2 Out-degree distribution . . . 21
2 Life Cycle of Papers . . . 24
3 The Large Component . . . 28
3.1 Weakly connected component . . . 29
3.2 Strongly connected component . . . 30
3.3 The largest SCC in PR . . . 31
7 PageRank . . . 39
7.1 PageRank when damping factor is 0.85 . . . 41
7.2 PageRank when damping factor is 0.5 . . . 45
V Co-author Network 49 1 Degree Distribution . . . 49
2 Author and co-author trends over time . . . 52
3 Weakly Connected Component . . . 54
4 Clustering Coefficient . . . 55
5 Small World and Average Shortest Path Length . . . 56
6 Authors and Papers . . . 56
VI Conclusion 61
References 63
1 A collection of 6 papers . . . 2
2 Basic statistics of both networks . . . 11
3 Number of papers in each journal of PR . . . 15
4 Comparison of the two datasets . . . 16
5 Statistics of citation network . . . 17
6 Top10 cited papers in PR . . . 20
7 Top10 cited papers in DBLP . . . 21
8 Papers have top10 citing value of PR . . . 23
9 Papers have top10 citing value of DBLP . . . 24
10 The first two largest WCC . . . 30
11 The fisrt two largest SCC . . . 31
12 The unnormal citing papers in PR . . . 32
13 The papers whose citation year gap is -49 in PR . . . 35
14 The papers whose citation year gap is -19 in DBLP . . . 35
15 The top 10 pagerank publications when 1−β = 0.15 in PR . . . 43
16 The top 10 pagerank publications when 1−β = 0.15 in DBLP . . . . 43
17 Pearson correlation coefficient . . . 46
18 The top 10 pagerank publications when 1−β = 0.5 in PR . . . 47
19 The top 10 pagerank publications when 1−β = 0.5 in DBLP . . . . 48
20 Statistics of co-author network . . . 49
21 Top10 ranked authors in PR and DBLP . . . 51
22 The first two largest WCC . . . 54
1 An example of citation network . . . 2
2 An example of co-author network . . . 2
3 Indegree distribution of PR and DBLP. About 10 percent of papers are cited only once in both DBLP and PR. . . 19
4 Citation count as a function of ranking. The top paper is cited 6291 times in PR and 2785 in DBLP. . . 20
5 Outdegree distribution of PR and DBLP . . . 22
6 Ranking of #citing papers . . . 22
7 Average number of citations received per paper . . . 25
8 Total number of citations received . . . 26
9 Number of papers in every year . . . 26
10 Total number of citations made . . . 27
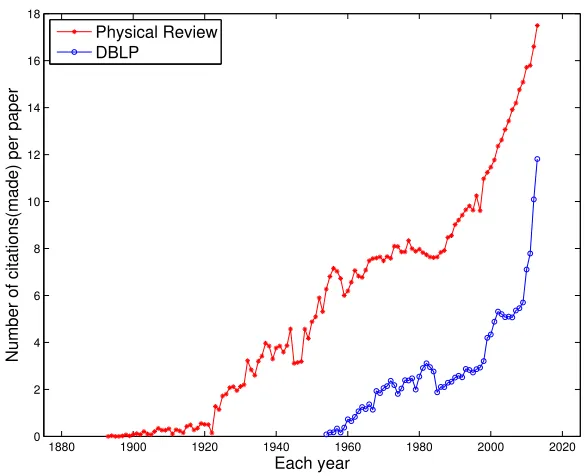
11 Average number of citations made per paper . . . 28
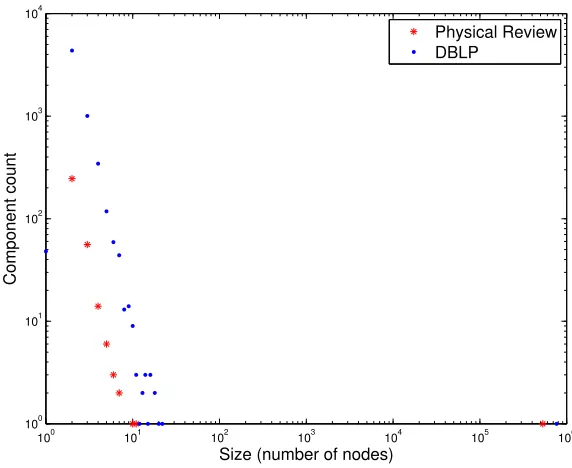
12 Distribution of WCC . . . 29
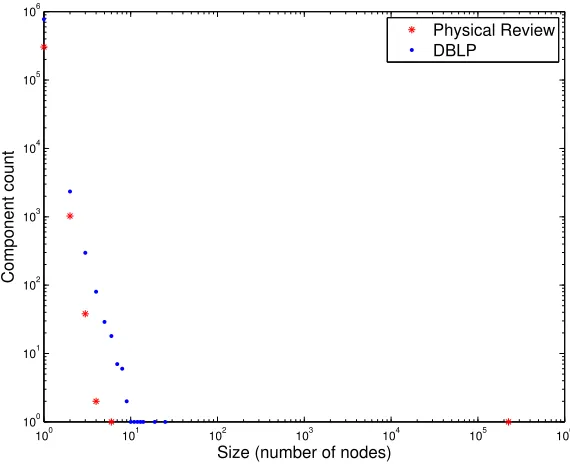
13 Distribution of SCC . . . 31
14 Citation year gap . . . 34
15 Illustration of the definition of CC, Eq.(2)(3)(4). There are 2 tri-angles connected to node P3 and C2 5 triples centered on it, so P3 has local CC: CP3 = 2 C2 5 = 0.2. The average CC of the network: ¯ C = 1 6 ×( 1 1 + 1 1 + 1 5 + 1 1 + 1 1 + 0) = 0.7. The global CC is: C = 3×2 C2 2 +C22+C52+C22+C22+ 0 = 0.43 . . . 37
16 Clustering coeffcient of papers as a function of their degree . . . 37
17 Example . . . 40
18 Average Pagerank versus #citations k . . . 41
21 Average Pagerank versus #citations k . . . 46
22 Individual Pagerank vesus #citations k . . . 47
23 Degree distribution of PR and DBLP . . . 50
24 Ranking of #coauthors . . . 51
25 Number of authors in each year . . . 52
26 Number of papers for each year . . . 53
27 Number of coauthors per author . . . 53
28 Distribution of WCC . . . 54
29 The clustering coeffcient of authors as a function of their degree . . . 55
30 Proportion that an author wrote more than a given number of papers. 57 31 Number of authors who wrote a given number of papers . . . 58
32 The ranking of #papers an author publish . . . 59
Introduction
Large number of academic papers are available through various sources.
Bibliomet-rics is developed to study the papers and their connections. One topic in this area
is the study of citation networks and co-author network. Although networks in an
individual discipline especially physics have been studied widely[29][10][26], the
dif-ference between different areas is still unclear. The goal of this thesis is to analyze
academic networks of citation and co-author in two disciplines, computer science and
physics. We construct these networks based on the data from DBLP and Physical
Review journals. Then, we analyze and compare them by computing network
proper-ties such as the degree distribution, connected component, clustering coefficient and
pagerank. Our goal is to find the commonalities and differences between these two
fields. Considering of the long time period of these two datasets, we also investigate
the trends of citation and collaboration in both disciplines.
Citation network and co-author network are two kinds of social networks that can
be extracted from academic research papers. In a citation network, a node represents
a paper, and a directed edge is a citation link if paper A cites paper B. The citation
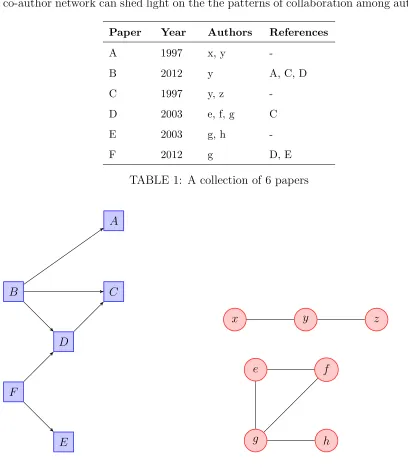
network that is established from a collection of 6 papers(Table 1) is given in Fig. 1.
It is a directed graph, and mostly acyclic because a paper normally cites those papers
that have been published earlier. In a co-author network, nodes are authors and an
undirected edge represents the collaborations between two authors if they co-author
a paper. The co-author network of authors of the collection of 6 papers is shown
is Fig. 2. Compared with citation network, it is undirected. Both kinds of network
instance, citation network can help us understand the connections among papers and
co-author network can shed light on the the patterns of collaboration among authors.
Paper Year Authors References
A 1997 x, y
-B 2012 y A, C, D
C 1997 y, z
-D 2003 e, f, g C
E 2003 g, h
-F 2012 g D, E
TABLE 1: A collection of 6 papers
A
C
D B
F
E
FIGURE 1: An example of citation
net-work
x y z
e f
g h
FIGURE 2: An example of co-author
net-work
1
Main results in citation networks
In citation network of PR and DBLP, we studied their degree distributions, life cycle of
PR and DBLP, their in-degree distributions have a long tail that resembles power
laws with similar exponent that is close to 2.5. The inequality of citations is larger
in DBLP: 28% of the citations in DBLP go to top 1% of the papers, compared with
19%inP R. Out-degrees resemble log-normal distributions in both PR and DBLP.
Papers attract more citations in their young age. The citation count decreases in
an exponential speed. The average life expectancy of a paper is 6.5 years in DBLP
and 8 years in PR, papers in DBLP has a shorter life than PR.
Clustering coefficient is an important metric for social network, and often a criteria
to judge whether a network is a social network. Contrary to the believe that citation
networks have high CC, we find that in both PR and DBLP, their CCs are rather low
(0.023 for PR and 0.012 for DBLP). The higher CC in PR indicates that papers in
PR knit closer than papers in DBLP.
Both DBLP and PR papers form a small world. In both data sets, their degree
of separations are close to six, which is also the degree of separation between people
in real life [21]. Their degree of separations are significantly larger than online
so-cial network such as Twitter(4.12), Facebook(4.7), and Weibo(3.44) from [16]. The
diameter in PR almost doubles that of DBLP.
PageRank algorithms on these two datasets are also explored. We find that the
direct application of the PageRank algorithm with damping factor 0.85 lead the large
bias in favor of old papers. Changing damping factor to 0.5 can ameliorate the
problem.
2
Main results in co-author network
In co-author network, we studied their degree distributions, component distributions,
clustering coefficient, and path length. Unlike citation network, the degree
distribu-tion of co-author network in PR and DBLP are very different. Although networks
have long tail distributions that resemble a power law, their slopes differ greatly. The
average degree in PR is 119.978, which is 15 times higher than that of DBLP (7.807).
(17.5% in DBLP and 11% in PR).
For the distribution of network components, both networks have a single large
component, whose size is 88% for DBLP and 95% for PR. There are some small
isolated components. Notably there are 24,744 isolated pairs in DBLP and 3,258 in
PR, and 11,125 isolated triples in DBLP and 1,523 in PR. CS community has more
isolated small components than PR.
Their CC is also very different in two networks. The average CC of the entire
PR co-author network is 0.738, and 0.718 in DBLP. The higher CC in PR indicates
that authors in PR cluster much tightly than authors in DBLP. Both high CC value
indicates that the co-author networks are social networks.
More collaborations happen in physicists than computer scientists in terms of
the degree distribution and clustering coefficients. However, for both PR and DBLP,
collaborations evolve over time. The number of co-authors per author and the number
of authors per paper has risen significantly over the past century. The productivity
of scientists in physics is higher than computer science, but we should notice that
the author name in PR data contains the last name and the initial of the first name.
Thereby many names with the same initials are aggregated as the same person, while
authors of DBLP have first name. Both co-author networks show the small-world
Review of The Literature
This chapter reviews the existing works of the analysis of citation and co-author
networks. Section 1 reviews two papers that build and analyze the citation network.
Section 2 reviews one paper that address the construction and analysis of co-author
network. Section 3 reviews two papers which combine both kinds of networks together.
1
Citation Network
1.1
How popular is your paper? An empirical study of the
citation distribution
According to Redner [28] states that, the problem is how to analyze the citation
distribution of scientific publications so that people can have the basic insight about
the popularity of publications.
Dataset
Redner used two relatively large data sets, one is the collection of 783,339 papers
published in 1981 that have been cataloged by the Institute for Scientific Information.
This dataset is ranging from 1981 to 1997. The second is the corpus of 24,296 papers,
which have 20 years of publications in volumes 11 to 50 of Physical Review D, from
Experiment
The author plotted the number of papers as a function of x citations, namely, the
citation distribution. The author found that the number of papers is decreasing with
the citations but can not be described by a single function over the whole range of
citations. And Redner found that the asymptotic tail of citation distribution for two
datasets appears to follow the power law, N(x)∼x−α, with α almost equal to 3.
Result and conclusion
The author analyze the citation distribution based on two large datasets, which can
provide a measure of popularity of scientific publications. And the number of papers
with x citations, has a large-x power law decay, with exponent almost 3.
1.2
Citation Statistics From More Than a Century of
Phys-ical Review
Redner [29] studied the statistics of the complete sets of citations of all publications
that published in Physical Review from 1893 to 2003.
Dataset
According to the author, the data was provided by the Physical Review Editorial
Office. There are a total of 353,268 publications and 3,110,839 citations. The number
of publications have at least one citation is 329,847. This dataset is special for its
long time history so that people can examine the time evolution of citations.
Experiment
The author analyzed the citation distribution, the attachment rate, age characteristics
of citations and citation histories of individual publications.
• The citation distribution: the author examined the growth of citations in time,
the citation distribution for entire dataset and the citations from 50 to 300
follows a power law with exponent 2.55.
• The attachment rate: the author found that the attachment rate is a linear
function of the number of citations.
• Age characteristics of citations: the author analyzed the average citation age
versus total citations, the distribution of citation ages from citing and to cited
publications.
• Citation histories of individual publications: the author states that the citation
histories of individual publications show great diversity.
Result and conclusion
The author observed how citations evolve and how individual publication influence
the research in this paper. The author found that the citation distribution can be
described by linear preferential attachment, and the age distribution of citations to a
paper follows a slow power-law decay.
2
Co-author Network
2.1
Scientific collaboration networks. I. Network
construc-tion and fundamental results
Newman [22] studied the co-author network in three disciplines, physics, biomedical
research and computer science.
Dataset
The author used bibliographic data collected from four public databases of papers.
• The physics data from Los Alamos e-Print Archive starting from 1992 to the
present. This database contains subdomains within physics, such as condensed
• A database of articles on biomedical research from Medline, ranging from 1961
to the present.
• A corpus of papers in high-energy physics(theoretical and experimental) from
Stanford Public Information Retrieval System (SPIRES), from 1974 to the
present.
• A database of papers in computer science from Networked Computer Science
Technical Reference Library (NCSTRL).
Since the coverage provided by both the Los Alamos Archive and the NCSTRL
database is relatively poor before 1995, and the author want to make comparison
of collaboration patterns among these different disciplines, the time period should be
the same. Thus the author construction co-author networks using data from 1995 to
1999 inclusive.
Experiment
The author provided some basic measures to compare these co-author networks.
• The number of authors
• The number of papers per author
• The number of authors per paper
• The number of collaborators per author
• Size of the giant component
• Clustering coefficient
Result and conclusion
The author compare and study the co-author networks among three disciplines from
different aspects. And he found that the distribution of the number of papers per
roughly follow a power law. Also for all networks, there exists a giant component in
which any two authors can be connected by a path.
As to the differences, researchers in experimental disciplines have more
collabora-tors on average than those in theoretical disciplines, and high-energy physicists have
the largest number of co-authors. The author also found that the degree of network
clustering in biomedical research is lower than other fields.
3
Citation and Co-authorship Network
Rather than focus solely on either citation or co-authorship networks, as most previous
studies have done, this section reviews two papers that studied both kinds of networks.
3.1
Co-authorship and citation patterns in the Physical
Re-view
Martin et al. [19] constructed citation and co-author networks based on a large dataset
Physical review to explore the temporal changes in citation and collaboration over the
whole time period of the data. The author also studied the correlation and interaction
between the two.
Dataset
The authors states that the Physical Review dataset derived from American
Physi-cal Society(APS), which consists of bibliographic and citation data for the physiPhysi-cal
journals from 1893 to 2009. Besides, the authors preprocessed this dataset, first they
disambiguate the authors’ name, then remove those papers with 50 or more authors.
Experiment
The author made a variety of analyses to this dataset, such as authorship and
co-authorship patterns, citation patterns, interactions between citation and co-co-authorship,
• Authorship patterns: a cumulative distribution function for the number of
pa-pers an author published, the changes in the number of papa-pers, the number of
authors, the number of authors per paper and co-authors per author over time.
• Citation patterns: the average number of citations received and made by a
paper over time, testing the aging of papers.
• Interactions between citation and co-authorship: the author divided citations
into three kinds, self-citation, co-author citation and distant citation and then
plot the fraction of citations (three kinds) as a function of year.
• Self-citation and co-author citation: gave the percentage of papers that make
or receive self-citation and co-author citation.
• Transitivity: calculate the clustering coefficient that the percentage of the pair
of authors have a common co-author but didn’t collaborate previously and write
a paper later together.
Result and conclusion
In this paper, the authors studied both networks together and the changes in citation
and collaboration patterns. And they found that the Physical Review grows
exponen-tially, as well as the number of citations per paper. The percentage of self-citations
and co-author citations are more constant than distant citations over time. Authors is
more likely to cite their own papers than their co-authors’, and who in turn cite more
often than non-coauthors. They also observed a phenomenon that one author cite
another’s paper often receive a citation in return later, especially happens between
co-authors. And two authors who have a common co-author but never collaborated
3.2
The structure and analysis of nanotechnology co-author
and citation networks
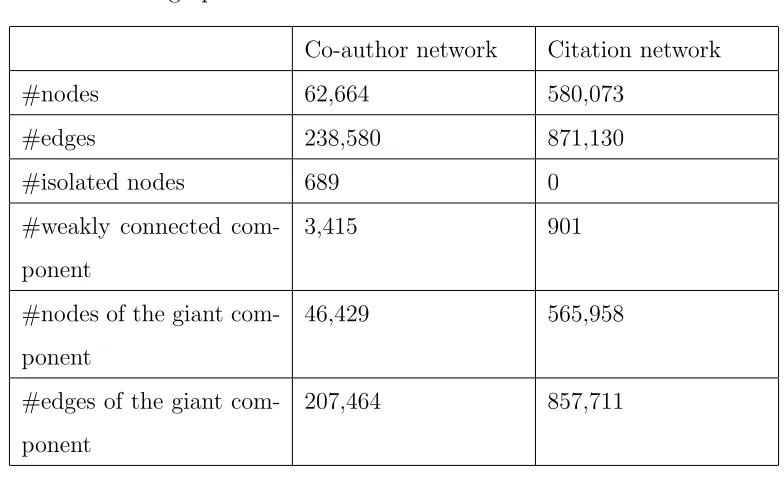
Onel et al. [23] built the co-author network to study the patterns of collaboration
and analyzed the citation network to study the structure of information flow in nano
science.
Dataset
The authors constructed these networks by extracting information from the scientific
literature database, ”Web of Science”. The time spans from year 1993 to 2008. They
collected those papers that contain the word ”nano” in their abstract, keywords or
title to build the citation and co-author network in nano science, the total is 30,550
records of papers.
Experiment
The authors measured some statistics of citation and co-author networks to interpret
their significance in nano science.
• Network demographics:
Co-author network Citation network
#nodes 62,664 580,073
#edges 238,580 871,130
#isolated nodes 689 0
#weakly connected
com-ponent
3,415 901
#nodes of the giant
com-ponent
46,429 565,958
#edges of the giant
com-ponent
207,464 857,711
• Degree distributions: the co-author network has an average degree of 7.7 and
3.004 for citation network.
• Giant component: the giant component of co-author network contains 74% of
all scientists, and 98% for citation network.
• Average shortest path length: 5.92 for co-author network, 7.79 for citation
network.
• Diameter: 21 for co-author network, 23 for citation network.
• clustering coefficient: 0.84 for co-author network, 0.012 for citation network.
Result and conclusion
The authors analyzed the undirected collaboration network and directed citation
network in nano science. And they found that the distribution of degree for both kinds
of networks follow a power law form. Both networks have small-world characteristics,
and co-author network is highly clustered. The citation network has a low clustering
coefficent compared to other real-world networks.
4
Summary
In this chapter, we reviewed five previous works that related to citation and
co-author networks. Previous works [28] and [29] analyzed the citation network by the
same author S. Redner based on the same dataset. Newman [22] built the co-author
network in three different disciplines. Previous works byMartin et al. [19] and Onel
et al. [23] analyze both kinds of networks in single area.
Meanwhile, there are some existing works in Physical Review dataset [26],[25],[10]
and works in DBLP dataset [15],[18],[27],[8],[35]. In this thesis, we use the tool gephi
and igraph to help us analyze the basic properties of networks. And the previous
Some previous works combined citation and co-author network together, however
the dataset just come from a single field. Other previous works did not provide a
complete analysis of network, situations can be summarized as follows, one or more
can met in those previous works.
• just analyze one of citation and co-author networks.
• did not provide a view of citation or co-author patterns over time.
• only focus on a short time window.
Dataset
This thesis analyzes academic networks of citation and co-authorship generated in
computer science and physics. The first dataset refers to computer science called
DBLP, the other data about physics is Physical Review. In this thesis, graph
prop-erties including PageRank, clustering coefficient and connected components are
cal-culated by using Gephi; shortest path and diameter are calcal-culated by using igraph,
a collection of network analysis tools programmed in Python. The experiments are
conducted on iMac machine with Core i5 2.7GHz CPU and 16 GB memory. And all
the figures are plotted using Matlab.
1
DBLP
DBLP is a computer science bibliography provided by University of Trier in Germany
[1]. It contains meta-data for different types of publications, including journal articles,
thesis, and conference papers and so on. The meta-data includes authors, date of
publications, titles, and venues. Unfortunately, DBLP itself does not include citation
data. Since our goal is to study the citation network of computer science, we used
a citation network provided by ArnetMiner[37][34][33][35][36], which covers a subset
of DBLP. They extract the citation relation for DBLP papers from ACM and other
sources. There are progressive developments for the data. The data used in this
thesis is the one released in May, 2014 that consists of 2,146,341 papers and 4,191,677
references. The papers were published in the years ranging from 1936 to 2013. In the
citation network[2].
2
Physical Review(PR)
Physical Review dataset is a repository for physical publications which consists of 12
kinds of journals and is available from APS (American Physical Society)[3]. Table
3 lists the number of papers in each journal and the total number of papers in PR
is 541,447. This dataset contains citation and bibliographic data that covers a long
time period, spanning more than 100 years from 1893 to 2013. Each paper has a
unique numerical label as identification. And data for each paper include title, year,
authors, affiliations of authors and so on.
Journals Papers
Physical Review(PR) 47,939
Physical Review A(PRA) 65,170
Physical Review B(PRB) 161,257
Physical Review C(PRC) 34,443
Physical Review D(PRD) 69,481
Physical Review E (PRE) 46,009
Physical Review X(PRX) 214
Physical Review Series I(PRI) 1,469
Reviews of Modern Physics(RMP) 3,139
Physical Review Letters(PRL) 110,080
Physical Review Special Topics - Physics Education
Re-search(PRSTPER)
251
Physical Review Special Topics - Accelerators and Beams(PRSTAB) 1995
Total 541,447
3
Comparison of two datasets
A comparison between PR dataset and DBLP dataset is listed in Table 4. The DBLP
dataset contains more than 2 million papers, and PR has half a million papers. Both
datasets provide two data, i.e., citation and metadata, and cover a long time period.
The metadata of PR and DBLP includes authors, year, title, venue and citation. Both
PR and DBLP do not contain abstract. DBLP has no data on authors affiliation.
These two datasets are useful for two reasons: the length of time it spans and
it contains citation and co-authorship in the same body of papers which allow us to
study and compare the changes in both citation and collaboration patterns over time.
Physical Review DBLP(ArnetMiner)
#Papers 541,447 2,146,341
#Citations 6,039,994 4,191,677
Time span 1893 - 2013 1936 - 2013
Areas Physics Computer Science
Metadata: authors √ √
year √ √
title √ √
venue √ √
citation √ √
affliation √ X
abstract X √
Citation Network
1
Degree Distribution
In citation network, we remove those isolated nodes that have no citation links. The
number of remaining nodes in PR is 531,480, and 781,108 in DBLP. These two
net-works are of similar size in terms of nodes (see in Table 5). However, the number of
edges are very different: the average degree of PR is almost twice of DBLP. Since the
citation graph is directed, vertices have both an inbound degree, or in-degree and an
outbound degree, or out-degree. That is, the in-degree/out-degree of a node is the
number of incoming/outgoing edges connected to it. For better understanding the
difference between two networks, we will look deep into the basic properties of them
in the following sections.
Physical Review DBLP
Time span 1893 - 2013 1954 - 2013
Number of Edges 6,039,994 4,191,677
Number of Nodes 531,480 781,108
Number of papers that have been cited 459,796 (87%) 528,263(68%)
Number of papers that have citations 516,163(97%) 564,705(72%)
Average Degree 11.364 5.366
TABLE 5: Statistics of citation network
Networks with power-law degree distribution are called scale-free networks. The
they argued that most real networks grow by the addition of new nodes and edges.
Secondly, real-world networks exhibit preferential attachment, that is the probability
of connecting to a node depends on the node’s degree. For instance, a new paper
prefers to cite well-known papers thus have more citations than less cited papers.
Based on this two theories, the Barab´asi-Albert model has been proposed which led
to the power-law distribution.
The algorithm of Barab´asi-Albert model can be described as two steps[5]:
1) Growth: Starting from a small number of nodes N, add a node at each time
step with N0(≤ N) edges link to N0 nodes already in the network.
2) Preferential attachment: We assume that the probability P of a new node
connected to node i depends on the degree ki of node i, the formula is as follows:
Pi = ki
P
j kj
(1)
Here, j presents all pre-existing nodes. The degree distribution resulting from this
model is scale free, the probability of a node has k edges follows a power law with the
exponent 3.
1.1
In-degree distribution
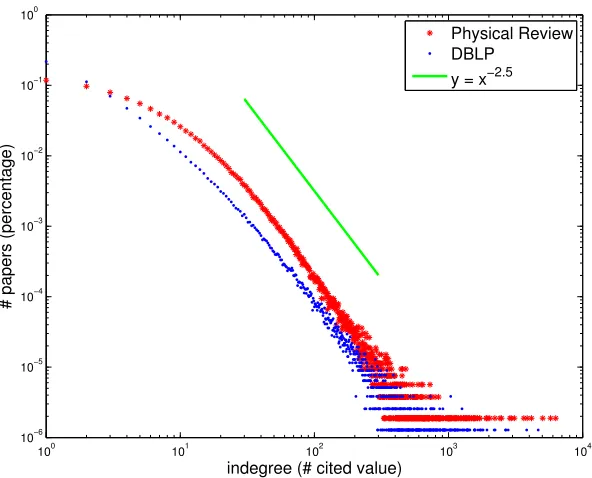
In our citation network, the in-degree of a node can also be seen as the number of
citations this paper received. Figure 3 shows the in-degree distribution, the proportion
of papers as a function of the number of cited values. The middle section of the data
appears to be described by a power law, N(x) ∼ x−α, with α ≈ 2.5(see the green
line). And as S. Redner examined in[28], the citations distribution of 24,296 papers
in Physical Review D has a large-x power law decay, with exponent -3. We can see
from the figure, PR and DBLP have a similar slope. Due to it’s a log-log plot, the
percentage of papers with 0 cited value hasn’t be shown. However, our results show
that 32% papers in DBLP never been cited and 13% in PR. Also around 70% papers
in DBLP have been cited less than 4 times, 40% in PR. These all means that papers
100 101 102 103 104 10−6
10−5 10−4 10−3 10−2 10−1 100
indegree (# cited value)
# papers (percentage)
Physical Review DBLP
y = x−2.5
FIGURE 3: Indegree distribution of PR and DBLP. About 10 percent of papers are
cited only once in both DBLP and PR.
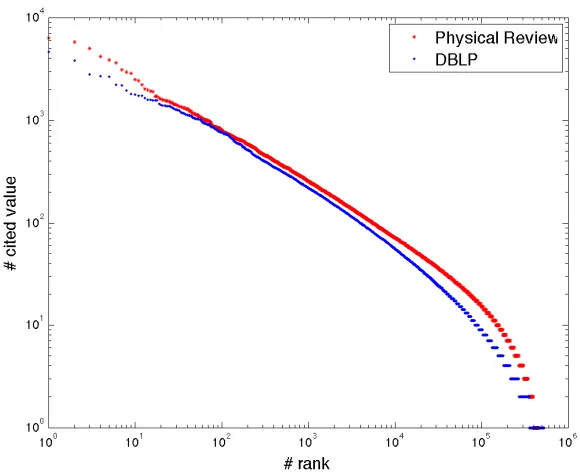
The degree distribution plot in Fig. 3 is good for inspecting low degrees, but the
popular papers with high citations are not discernible. So we plot the degree against
ranking in Fig. 4, where the citation is plotted a function of its rank. The figure
shows that the top cited paper in PR has been cited 6291 times, 2758 in DBLP. We
also list the top10 cited papers of PR and DBLP respectively (Table 6 and Table
7) for reference. The top 1% papers’ citations in DBLP accounts for 28% of the
whole citations, 19% of PR. In both DBLP and PR, citations concentrated in the top
papers. However, in the community of computer science, mega stars attract more
FIGURE 4: Citation count as a function of ranking. The top paper is cited 6291
times in PR and 2785 in DBLP.
Physical Review
Rank # cites Title Author Journal Year
1 6291 Self-Consistent Equations Inclucing Exchange and
Correlation Effects
W. Kohn, L. J. Sham PR 1965
2 5763 Generalized Gradient Approximation Made
Sim-ple
John P. Perdew, Kieron Burke,
Matthias Ernzerhof
PRL 1996
3 5035 Inhomogeneous Electron Gas P. Hohenberg, W. Kohn PR 1964
4 4159 Efficient Iterative Schemes for ab initio
Total-energy Calculations Using a Plane-Wave Basis Set
G. Kresse, J. Furthmuller PRB 1996
5 3860 Self-interaction Correction to Density-functional
Approximations for Many-Electron Systems
J. P. Perdew, Alex Zunger PRB 1981
6 3640 Special Points for Brillouin-zone Integrations Hendrik J. Monkhorst, James
D. Pack
PRB 1976
7 3097 Ground State of the Electron Gas by a Stochastic
Method
D. M. Ceperley, B. J. Alder PRL 1980
8 2940 Projector Augmented-Wave Method P. E. Blochl PRB 1994
9 2868 From Ultrasoft Pseudopotentials to the Projector
Augmented-Wave Method
G. Kresse, D. Joubert PRB 1999
10 2481 Efficient Pseudopotentials for Plane-Wave
Calcu-lations
N. Troullier, Jose Luriaas
Mar-tins
PRB 1991
DBLP
Rank # cites Title Author Journal Year
1 2785 Distinctive Image Features from Scale-Invariant
Keypoints
David G. Lowe International
Journal of
Computer
Vision
2004
2 2678 Fast Algorithms for Mining Association Rules in
Large Databases
Rakesh Agrawal,
Ramakrish-nan Srikant
VLDB 1994
3 2224 Mining Association Rules between Sets of Items in
Large Databases
Rakesh Agrawal, Tomasz
Imielinski, Arun N. Swami
SIGMOD
Conference 1993
4 1935 The Anatomy fo a Large-Scale Hypertextual Web
Search Engine
Sergey Brin, Lawrence Page Computer
Networks
1998
5 1811 Chord: A Scalable Peer-to-Peer Lookup Service
for Internet Applications
Ion Stoica, Robert Morris,
David R. Karger, M. Frans
Kaashoek, Hari Balakrishnan
SIGCOMM 2001
6 1724 A Method for Obtaining Digital Signatures and
Public-Key Cryptosystems
Ronald L. Rivest, Adi Shamir,
Leonard M. Adleman
Commun.
ACM
1978
7 1722 Graph-Based Algorithms for Boolean Function
Manipulation
Randal E. Bryant IEEE Trans.
Computers 1986
8 1656 Bagging Predictors Leo Breiman Machine
Learning
1996
9 1577 Genetic Programming - on the Programming of
Computers by Means of Natural Selection
John R. Koza Complex
adaptive
systems
1993
10 1563 Induction of Decision Trees J. Ross Quinlan Machine
Learning
1986
TABLE 7: Top10 cited papers in DBLP
1.2
Out-degree distribution
The out-degree of a node is the number of papers citing the given paper and the
out-degree distribution is shown in Fig. 5. It plots the proportion of papers as a
function of the number of citing values. Like the in-degree distribution, the
out-degree distribution also shows preferential attachment characteristics in the middle
section of data (green line with slope -3.8), although the initial segment deviates
significantly from power law distribution. Since it’s a log-log plot, it didn’t show the
percentage of papers with 0 citing value. Actually, 28% papers in DBLP never cite
any paper, 3% in PR. And around 17% papers cite more than 10 papers in DBLP,
43% in PR. Papers in DBLP citing less papers than PR in average. Also papers in
than DBLP.
100 101 102 103
10−6 10−5 10−4 10−3 10−2 10−1
outdegree (# citing value)
# papers (percentage)
Physical Review DBLP y = x−3.8
FIGURE 5: Outdegree distribution of PR and DBLP
Figure 6 plots the citing value as a function of its rank to focus on the papers
which citing large number of papers. The top paper cites 607 papers in PR, 339 in
DBLP. And we list the papers that have top10 citing values of PR in Table 8 and of
DBLP in Table 9 respectively for reference.
Physical Review
Rank # cites Title Author Journal Year
1 607 Electrodynamics of Correlated electron materials D.N. basov, Richard D.
Averitt, Dirk van der Marel,
Martin Dressel, Kristjan Haule
RMP 2011
2 582 Metal-insulator Transitions Masatoshi Imada, Atsushi
Fuji-mori, Yoshinori Tokura
RMP 1998
3 530 Table of Isotopes G. T. Seaborg, I. Perlman RMP 1948
4 517 Energy Levels of Light Nuclei. III W. F. Hornyak, T. Lauritsen,
P. Morrison, W. A. Fowler
RMP 1950
5 477 Spintronics: Fundamentals and Applications Igor Zutic, Jaroslav Fabian, S.
Das Sarma
RMP 2004
6 449 Electronic Properties of Two-dimentional Systems Tsuneya Ando, Alan B. Fowler,
Frank Stern
RMP 1982
7 448 Quantum Entanglement Ryszard Horodecki, Pawel
Horodecki, Michal Horodecki,
Karol Horodecki
RMP 2009
8 447 Energy Levels of Light Nuclei. V F. Ajzenberg, T. Lauritsen RMP 1955
9 432 Many-body Physics with Ultracold Gases Immanuel Bloch, Jean
Dal-ibard, Wilhelm Zwerger
RMP 2008
10 419 Energy Levels of Light Nuclei(Z=11 to Z=20) P. M. Endt, J. C. Kluyver RMP 1954
DBLP
Rank # cites Title Author Journal Year
1 339 Algorithm Engineering: Bridging the Gap between
Algorithm Theory and Practice
Matthias Muller-Hannemann,
Stefan Schirra
Algorithm
En-gineering
2010
2 279 A Brief Survey of Program Slicing Baowen Xu, Ju Qian,
Xiao-fang Zhang, Zhongqiang Wu,
Lin Chen ACM SIG-SOFT Software Engineering Notes 2005
3 242 Location-dependent Query Processing: Where we
are and where we are heading
Sergio Ilarri, Eduardo Mena,
Arantza Illarramendi
ACM Comput.
Surv.
2010
4 240 Agent-Oriented Programming, From Prolog to
Guarded Definite Clauses
Matthew M. Huntbach, Graem
A. Ringwood
Lecture Notes
in Computer
Science
1999
5 240 Modern Development Methods and Tools for
Em-bedded Reconfigurable Systems: A Survey
Lech Jozwiak, Nadia Nedjah,
Miguel Figueroa
Integration 2010
6 232 Query Evaluation Techniques for Large Databases Goetz Graefe ACM Comput.
Surv.
1993
7 224 Learning Bayesian Networks: Approaches and
Is-sues
Ronan Daly, Qiang Shen, J.
Stuart Aitken
Knowledge
Eng. Review
2011
8 221 Research Frontiers in Object Technology Salvatore T. March, Charles A.
Wood, Gove N. Allen
Information
Systems
Fron-tiers
1999
9 219 Synopses for Massive Data: Samples, Histograms,
Wavelets, Sketches
Graham Cormode, Minos N.
Garofalakis, Peter J. Haas,
Chris Jermaine
Foundations
and Trends in
Databases
2012
10 218 A Survey on Content-centric Technologies for the
Current Internet: CDN and P2P solutions
Andrea Passarella Computer
Communica-tions
2012
TABLE 9: Papers have top10 citing value of DBLP
2
Life Cycle of Papers
Now we look deep into the time dimension to see the citation received distribution
over the whole time.
Fig. 7 shows the average number of citations received per paper. We can make
several observations that are common for both DBLP and PR. First, recent papers
receive less citations in average. The older the paper is, the more citation it receives.
This trend grows almost linearly for about 13 years from year 2013 to 2000. The
trend does not continue beyond 13 years. When papers are 13 years or older, their
average citation number do not grow. This corroborates the theory that the life cycle
they receive few new citations.
Secondly, the plateau spans almost 40 years from the sixties to the year 2000.
During this time period, papers receives 13 citations on average for PR, and 8 for
DBLP.
Thirdly, for papers that are more than 50 years old, their citation numbers taper
off gradually to zero. It is interesting that the plateau does not extend beyond 50
years. That can be explained by the fact that there are very few papers in that age.
1880 1900 1920 1940 1960 1980 2000 2020
0 5 10 15 20 25 30
Each year
Number of citations(received) per paper
Physical Review DBLP
FIGURE 7: Average number of citations received per paper
Figure 8-9 show for each year the total number of citations and the number of
papers. Fig. 8 illustrates the trends of total citations are consistent for PR and DBLP,
increasing first and dropping then. This maybe related to the productivity of the
entire field of physics and computer science over time. Figure 9 shows the total number
of papers published over the whole time period of PR and DBLP respectively. For
Physical Review, the number of papers are increasing steadily over time and slightly
dropping since year 2012. This accounts for the increasing of citations received, and
the dropping of citations in recent years maybe caused by these papers are too recent
since year 1980, however the growth in number of papers do not continue to the end
of time, since DBLP dataset we obtained does not include so many recent papers.
Hence we expect a drop in the citations as seen in the figure 8. The other reason
should also be that recent papers have less opportunity to be cited. We can also see
that computer science area develop faster than Physics from Fig. 9.
1880 1900 1920 1940 1960 1980 2000 2020
0 0.5 1 1.5 2 2.5
3x 10
5
Each year
Number of citations(received)
Physical Review DBLP
FIGURE 8: Total number of citations received
18800 1900 1920 1940 1960 1980 2000 2020
1 2 3 4 5 6 7 8x 10
4
Each year
Number of papers
Physical Review DBLP
Figure 10 shows the total number of citations made each year. We can see that
the total number of citations of PR is increasing steadily, but there is a dip in around
year 2010 in the blue curve. Combining with the figure 9, it maybe because the total
number of papers decreasing from this year due to the incompletion of DBLP dataset.
We can not tell the citation(made) trends just from this figure, so we plot Fig. 11.
It shows the average number of citations made per paper over the whole time period.
These two curves show steady increase over time, which means that authors used to
cite fewer papers and tend to cite more papers in recent times. Maybe the reason is
the increase in the volume of publications available to be cited.
1880 1900 1920 1940 1960 1980 2000 2020
0 0.5 1 1.5 2 2.5 3 3.5 4 4.5
5x 10 5
Each year
Number of citations(made)
Physical Review DBLP
1880 1900 1920 1940 1960 1980 2000 2020 0
2 4 6 8 10 12 14 16 18
Each year
Number of citations(made) per paper
Physical Review DBLP
FIGURE 11: Average number of citations made per paper
3
The Large Component
In the theory of complex network, most of the nodes in a network tend to be connected
in a large component, regardless of the density of the graph. In citation networks,
papers also form a large component. In PR, 99.8% of the nodes are connected in
one large component. In DBLP, 98.1% are connected despite diverse areas covered
by DBLP and its low average degree. In addition to the large component, we need
to know what are the remaining component. This can be typically described using
the size distribution of all the components. In directed graphs, a distinction is often
made between weakly and strongly connected components. In a weakly connected
component(WCC), determination of connectivity ignores edge direction, whereas in
a strongly connected component(SCC), the direction is considered. An SCC is a
component where every node can reach every other node in the component. A WCC
is a component where each node can reach every other node when the direction is
3.1
Weakly connected component
In this experiment, we treat the citation networks as undirected graphs and find the
size of each weakly connected component. Figure 12 shows the size distribution of
weakly connected components in the citation graph. One can see that for both PR
and DBLP, there is a single large component that dwarfs the other components in
size. The citation network of PR is comprised of 330 WCC; the largest component
consists of 530,681 nodes, which occupy 99.8% of all papers (Table 10). And the
citation network of DBLP contains 6027 WCC, 98.1% of all the papers are in the
largest component of 766,128 nodes. The size of the second largest component in
two networks are 11 and 22 respectively, which are far less than the largest. There
are about four thousands WCC in DBLP that contain two nodes only, two hundreds
WCC in PR.
100 101 102 103 104 105 106
100
101
102
103
104
Size (number of nodes)
Component count
Physical Review DBLP
#nodes(PR) #nodes(DBLP)
Citation network 531,480 781,108
The largest component 530,681(99.8%) 766,128(98.1%)
2nd largest component 11 22
TABLE 10: The first two largest WCC
3.2
Strongly connected component
Now we turn to the strongly connected component of citation networks as directed
graphs. Figure 13 and Table 11 show that the largest SCC of PR citation network
contains 42% of all the papers, which is 225,618 nodes. The second largest connected
component has size 6, four orders of magnitude smaller. Of the remaining vertices
not in this largest component, the majority are completely disconnected because
they contain no edges at all, they default to component sizes of one. In contrast, the
largest SCC in DBLP just occupy 0.003% of all nodes, which can be ignored. And
the disconnected nodes accounts for 99% of all nodes, which is 774,737.
It is a very interesting difference between these two networks. Actually, the
ci-tation network should be acyclic graph, that means the SCC should not exist. One
may now ask: why almost half of nodes in the largest SCC of PR? The answer to this
question reveals some fascinating details in PR dataset; to expose this, we investigate
100 101 102 103 104 105 106
100
101
102
103
104
105
106
Size (number of nodes)
Component count
Physical Review DBLP
FIGURE 13: Distribution of SCC
#nodes(PR) #nodes(DBLP)
Citation network 531,480 781,108
The largest component 225,618(42%) 25(0.003%)
2nd largest component 6 19
TABLE 11: The fisrt two largest SCC
3.3
The largest SCC in PR
The largest strongly connected component in PR contains 225,618 papers, ranging
from 1923 to 2010. There must exist a path between every pair of nodes in the largest
SCC, so we find one path that from the earliest paper to the latest paper to see what
happens. Take one path from 1923 to 2010 for example:
1923: 10.1103/PhysRev.22.333 →
1994: 10.1103/PhysRevLett.72.4129 →
1992: 10.1103/PhysRevB.46.15233 →
1986: 10.1103/RevModPhys.58.323 →
1972: 10.1103/PhysRevB.6.3189 →
1969: 10.1103/PhysRev.179.690 →
1968: 10.1103/PhysRev.171.515 →
1967: 10.1103/Physics.3.27 →
2010: 10.1103/PhysRevLett.104.137001
We can see there is an unnormal citation relation between the second paper(10.1103/
Physics.2.15) and the third paper(10.1103/PhysRevLett.72.4129); the second last
paper(10.1103/Physics.3.27) and the last paper(10.1103/PhysRevLett.104.137001).
Other papers all cite paper backwards in time except these two edges. Then we
ex-tract these papers and the papers citing 10.1103/Physics.2.15 and 10.1103/Physics.
3.27 and list in Table 12.
Journal Title Author Year
PhysRev.22.333 On the Motions of Electrons in Gases K. T. Compton 1923
Physics.2.15 - Hertz 1922
Physics.2.15 A View from the Edge H. Fertig 2009
PhysRevLett.72.4129 Randomness at the edge: Theory of quantum
Hall transport at filling v=2/3
C. L. Kane, Matthew P. A. Fisher,
and J. Polchinski
1994
PhysRev.171.515 Theory ofs−dScattering in Dilute Magnetic Alloys with Spin- Impurities
H. J. Spencer 1968
Physics.3.27 - H. Suhl and D. Wong 1967
Physics.3.27 Viewpoint: Dirac cone in iron-based
supercon-ductors
M. Zahid Hasan and B. Andrei
Bernevig
2010
PhysRevLett.104.
137001
Observation of Dirac Cone Electronic
Disper-sion inBaF e2As2
P. Richard, K. Nakayama, T. Sato, M.
Neupane, Y.-M. Xu, J. H. Bowen, G.
F. Chen, J. L. Luo, N. L. Wang, X.
Dai, Z. Fang, H. Ding, and T.
Taka-hashi
2010
TABLE 12: The unnormal citing papers in PR
Checking with the references of PhysRev.22.333 from website, Physics.2.15 of
1922 is one of the references. Notice that Physics journal is not included in the PR
metadata, but appear in citation graph, that’s why we can not find the title of this
of PhysRev.22.333. Similarly, we check the citing papers of PhysRevLett.72.4129
that citing this paper from website, Physics.2.15 of 2009 cite it. And we can see
that Physics.2.15 of 1922 and Physics.2.15 of 2009 have the same id but different
authors. Maybe these two papers are different papers but the citation graph just
record Physics.2.15 in 1922. And the other possible explanation is PhysRev.22.333
cited Physics.2.15 of 1922, and after many years Physics.2.15 has been republished by
H.Fertig in 2009 and cite PhysRevLett.72.4129 of 1994. As for the other unnormal
citing papers, PhysRev.171.515, Physics.3.27 and PhysRevLett.104.137001, we found
the reason is the same, Physics.3.27 is not the unique id. To understand the citation
graph structure better, let’s take a look at the life cycle of papers in PR in the next
section.
4
Life cycle of papers
People tend to cite recent papers, because recent papers reflect new developments in
the area. Papers have their high probability being cited when they are young. With
time passes by, they are barely cited, become irrelevant, and practically dead. Fig.
14 plots such life cycle of papers for PR and DBLP. Newly born papers are most
energetic, attracting more citations. Their energy drops exponentially over years, as
evidenced by the straight line in fig of the log-scale plot.
Despite the commonalities shared by two disciplines, there is a striking difference
between them as depicted in Panel (d): papers in physics tend to cite more recent
papers. About 13% citations refer to papers published in one year before in Physics,
while in computer science first year citation only accounts for slightly above 10%.
The majority of the citings are made in the second year-about 12%. This is rather
surprising, given that DBLP contains many conference papers, and CS is normally
Citation Year Gap
-50 0 50 100 150
Count (Log10) 0 1 2 3 4 5 6 PR DBLP
Citation Year Gap
-50 0 50 100 150
Count \% -7 -6 -5 -4 -3 -2 -1 0 PR DBLP
Citation Year Gap
-50 0 50 100 150
Count \% 0 0.02 0.04 0.06 0.08 0.1 0.12 0.14 PR DBLP
Citation Year Gap
0 2 4 6 8 10
Count \% 0.02 0.04 0.06 0.08 0.1 0.12 0.14 PR DBLP
FIGURE 14: Citation year gap
Panel (a) also shows the negative citation year gap in X-axis, which represents
the unnormal citation relationship. There are some papers cite the papers have yet
to be written, we extract one citation which citation year gap is -49 for example.
This citation is from PhysRev.91.699(1953) to RevModPhys.74.1(2002). And we
list their metadata in Table 13, searching from the website, we find that the paper
RevModPhys.74.1 of 1951 is in the references list of PhysRev.91.699, but in the
citation graph, the id PevModPhys.74.1 represents the paper that published in 2002.
Journal Title Author Year
PhysRev.91.699 Photoneutron Production
Exci-tation Functions to 320 Mev
Lawrence W. Jones
and Kent M.
Ter-williger
1953
RevModPhys.74.1 - Barschall, Rosen,
Taschek, and
Williams
1951
RevModPhys.74.1 Optical simulations of electron
diffraction by carbon nanotubes
A. A. Lucas, F.
Moreau, and Ph.
Lambin
2002
TABLE 13: The papers whose citation year gap is -49 in PR
We also extract one citation which citation year gap is -19 in figure 14. This
citation is from paper ”1123623”(1980) to paper ”891982”(1999). And we list their
metadata in Table 14, searching from the website, we find that the paper
”Applicabil-ity of Software Validation Techniques to Scientific Programs” of 1980 cite the paper
”Design and Code Inspections to Reduce Errors in Program Development” of 1976.
After 23 years, the author republished the paper ”Design and Code Inspections to
Reduce Errors in Program Development” in 1999. Thus it has been recorded in the
citation graph as ”1123623”(1980) citing ”891982”(1999).
ID Title Author Year
1123623 Applicability of Software Validation
Techniques to Scientific Programs
W. E. Howden 1980
891982 Design and Code Inspections to Reduce
Errors in Program Development
Michael E. Fagan 1999
TABLE 14: The papers whose citation year gap is -19 in DBLP
Conclusions: citation number of a paper decreases exponentially over years. The
average life expectancy of a PR paper is 8 years, and 6.5 years for DBLP paper, that
5
Clustering Coefficient
The clustering coefficient, along with the average shortest path length, can indicate
a ”small-world” effect. Clustering coefficient(CC) is an important measure for the
network connectivity[39]. Three versions of this measure exist: local CC, average CC
of entire network and global CC. The local CC is a measurement of the connectivity
of a specific node, it indicates how nodes are embedded in their neighborhood. And
the formula of local CC of a node is as follows:
Ci =
#triangles connected to i
#triples centered on i (2)
The average CC of entire network is the average local CC of all nodes in the network,
it gives an overall indication of the clustering in the network and the formula is as
follows:
¯
C = 1
n n
X
i=1
Ci (3)
The global CC gives an indication of clustering in the network. The global CC formula
is defined as:
C = 3×#triangles in the network
#connected triples of vertices (4)
Any two edges connected to node i can be seen as a triple centered on i. And the global
CC measures the fraction of triples that have their third edge filled in to complete the
triangle. Each triangle forms three triples, that’s why the factor of three multiplied
in the numerator(see Fig. 15).
Here, we treat the citation networks as undirected graphs, and Fig. 16 plots
the local CC as a function of degree. As we can see, Ci falls off with degree ki
approximately ask−i 1, which has been observed in[32]. They found that the clustering
coefficient as a function of the degree of the nodes often follows a power law: C(k)∝
k−α for scale-free networks. The value of α is close to 1. The average CC of PR
is 0.239 and global CC is 0.023, as for DBLP, the average CC is 0.142 and global
is 0.012. The clustering coefficient value of these two citation networks are rather a
P1 P2
P3 P6
P4 P5
FIGURE 15: Illustration of the definition of CC, Eq.(2)(3)(4). There are 2 triangles
connected to node P3 and C52 triples centered on it, so P3 has local CC:CP3 = 2
C2 5
=
0.2. The average CC of the network: ¯C = 1 6 ×(
1 1+
1 1 +
1 5 +
1 1 +
1
1+ 0) = 0.7. The global CC is: C = 3×2
C2
2 +C22+C52+C22+C22+ 0
= 0.43
100 101 102 103 104
10−4 10−3 10−2 10−1 100
Degree
Average clustering coefficient
Physical Review DBLP
y = x−1
FIGURE 16: Clustering coeffcient of papers as a function of their degree
Conclusions: We find that these two citation networks are not social networks
considering extremely small global CC even when their directions are ignored. The
cluster more loosely than papers in physics, almost half in terms of CC.
6
Small World and Average Shortest Path Length
The small-world network was originally proposed by Duncan Watts and Steven
Stro-gatz in 1998[39]. It’s a class of random graphs in which most of the node-pairs are
connected by a short path, this characteristic is called the small-world effect. The
small-world networks can be highly clustered, yet have small average-shortest path
length. Many real-world networks, such as World Wide Web and neural network, are
shown to be small-world networks. In order to explore our citation network belongs
to small-world network or not, we investigate the average shortest path length of
citation networks.
The average shortest path length of a connected network is defined as the average
of the shortest paths for all possible pairs of nodes in the network. It measures the
efficiency of information transfer in a network. It is given by
l = 1
N(N −1)
X
i6=j
d(vi, vj) (5)
N is the number of nodes in the network, d(vi, vj) denotes the shortest distance
between nodes vi and vj, d(vi, vj) = 0 if vj can not be reached from vi.
We convert the citation networks into undirected networks and calculate the
av-erage shortest path length between all pairs of papers in the citation networks. Here
we ignore the direction-otherwise many nodes can not be reached and the average
path length would be infinitely long.
We found that the average shortest path between all pairs of PR papers is about
5.09, and 5.88 for DBLP. For instance, that means it takes five steps on average
when information transfer from one physical review paper to another physical review
paper, while it needs almost 6 steps between DBLP papers. Thus it proves that the
PR citation network is more tight than DBLP citation network. In the study of Shi
et al.[31], the average shortest path is 7.60 for ACM and 6.29 for CiteSeer citation
The diameter of a network is defined as the longest shortest paths between any
pair of nodes in a network. It is another measurement of network graphs, it represents
the linear size of network. Treating the citation networks as undirected networks, we
calculate the shortest path length from every paper to all other papers, and we find
the diameter of PR citation network is 31 and 18 in DBLP citation network, which
indicates that there is an order of at most 31 links connecting any two PR publications
and 18 links for DBLP respectively.
Conclusion: According to the small average shortest path length of PR and DBLP
citation networks, both networks can be classified as small-world network.
7
PageRank
PageRank was originally used to measure the importance of website pages and
pro-posed by Larry Page[24]. It is a link analysis algorithm that assigns a numerical
weighting to each element/vertex. In our citation network, the vertex is academic
paper and link(directed) is citation relations between papers. So the PageRank
mea-sures the importance of papers based on the citation relations. The basic idea of how
to calculate page rank is to use power iteration to calculate page rank score for each
paper several times. The page rank for the k+ 1th node is defined by the recursion
formula (5):
rk+1 = (βM + (1−β) 1
ne·e
T)r
k (6)
Here, n is the number of papers in the citation graph, rk is n-dimensional vector
represents each paper’s page rank value in kth iteration. Based on the equation, we
iteratively calculate the r until the stop criteria has been met. M is n×n column
stochastic matrix and used to represent the connection probability of each node to
any node. Theith column represent the probability of jumping to all the other papers
from paper i(Random Walk). If there is a directed edge from i to j, then
M[j][i] = 1
#papers that i pointing to (7)
P3 cite or point to. So theM[1][3] and M[4][3] should be equal 1/2. And there is no
link from P3 to P2 and itself, soM[2][3] andM[3][3] are 0, like the 3th column shows
and the M is the following matrix:
M =
0 0 1/2 0
0 0 0 1/2
1 1 0 1/2
0 0 1/2 0
(8) P1 P3 P2 P4
FIGURE 17: Example
However, a trap usually occurs in a citation network (just like the P1 and P3
in Fig. 17), paper can not jump out of the loop. To prevent this situation, we
use 1−β in Eq. (5) to control the probability of randomly restarting the
paper-selecting(random walk). Now the calculation is not based on the citation links, there
is equal probability, 1/n, that jumping to all the other nodes in the graph. So for Fig.
17, the probability of jumping to any of the papers is 1/4 and the 1
ne·e
T matrix is:
1
ne·e
T =
1/4 1/4 1/4 1/4
1/4 1/4 1/4 1/4
1/4 1/4 1/4 1/4
1/4 1/4 1/4 1/4
(9)
• Initialize n-dimensional vector r0 = (1/n,1/n, ...,1/n)T
• Start power iteration: rk+1 = (βM + (1−β) 1
ne·e
T)r
k
• Stop criterion: When |rk+1−rk|<
The first step of PageRank is to initialize the page rank value for each node. Then
start the power iteration, we will gradually get the latest r value, and the r value
tends to become stable if the times of iteration is enough. Finally, the parameter
is used to set the stop criterion, if the differences between r vector in two iterations
smaller than , then output the latestr vector as a page rank for each node.
7.1
PageRank when damping factor is 0.85
Here, we set the parameters damping factor β to be 0.85, 1−β to be 0.15 and to
be 0.001. Fig. 18 shows the average page rank value for papers with k
citations(in-degree) as a function of k. For both dataset, there are many papers have the same
number of citations received when k is small. The average page rank value increases
with k, which means the more citations received, the higher pagerank of this paper.
100 101 102 103 104
10−7 10−6 10−5 10−4 10−3 10−2
Number of citations
Average Pagerank
Physical Review DBLP
However, for large k, there is only one paper with k citations. Thus we plot
the individual pagerank as a function of k citations when k greater than 100(Fig.
19). There are many outliers compared with Fig. 18, and we list the top10 ranked
papers in PR and DBLP based on their page rank value in Table 15 and Table 16
respectively. Also given in these two table are the number of citations, paper title,
author, journal and year. While those papers have high number of citations appear
on this list, several papers have low number of citations have been ranked highly
according to PageRank algorithm, for instance, the articles ”Cohesion in Monovalent
Metals” in PR and ”A Computer System for Inference Execution and Data Retrieval”
in DBLP. The third ranked paper in DBLP just has been cited 13, and we found an
interesting phenomenon that this paper was cited by the second ranked paper ”A
Relational Model of Data for Large Shared Data Banks” with 1170 citations. That
means citations from more important papers make more contribution to the rank of
this cited paper, which way the PageRank algorithm implement in. The PageRank
algorithm is a good measure to rank those papers high although not cited often but
important when 1−β = 0.15.
102
103
104 10−6
10−5 10−4 10−3 10−2
Number of citations
Pagerank
Physical Review
(A) PR
102
103
104
10−6
10−5
10−4
10−3
10−2
Number of citations
Pagerank
DBLP
(B) DBLP
FIGURE 19: Individual PageRank as a function of citation count when damping