User Action Reporting Model for Immersive Environment
Mohammad Reza Khishadeh
Bachelor graduated from Multimedia University (Malaysia)
Email:- [email protected]
Abstract
The term User Action Reporting Model (UARM) is the monitoring of second life (SL) users by
analyzing them through related diagrams. The second life environment which had been point as
Immersive Environment(IE) is the action and behavior of virtual avatars which is in our case is
the company users behavior through virtual offices working area .in this paper , we had made a
different types of filters for diagrams which is useful for analyzing of virtual users to monitor
them through their daily actions in the company immersive environment within web application
tools likes: PHP,HTML,JAVASCRIPT, ANGULAR JS and database management system using
SQL Server .Finally ,as the result we had made a web application with different filter diagrams
which can monitor user actions.
Keywords: User Action Reporting Model, Second Life, Immersive Environment
Introduction
Since the time, Human Beings
understood the collection of data and
analysis could be useful and help them to
improve their actions for reaching their goal
;it was always been a problem to find a good
process of the raw data, to convert it to
useful Information. Nowadays, even though
we have had Many web analytics and visual
statistics services which provided by some
well Known companies like YAHOO and
others; It is still dealing with maximizing the
analysis And visualization output of raw
data. The YAHOO„s former Director "
Dennis R.Mortensen" written in his book:
"you should spend $10 on the web analytics
tool And spend $90 on people(the "the
planet size brains" part of equation)." [1] it
means Human Being‟s creativity to design
an accurate filter of data is even more
important
Than the tools or methods of data filtering to
be used.
The term "Data Science" “(originally used interchangeably with "data logy”) has Exist
substitute for computer science by Peter
Naur in 1960. In 1974, Naur published
Concise Survey of Computer Methods ,
which freely used the term data science in its
survey of the contemporary data processing
methods that are used in a wide range of
applications. Perhaps, information system
management is one of the areas which is
important. In this paper ;Since we are
dealing with Data Science and Statistics
Information . Therefore, any wrong data
flow or assumption would cause wrong
information for users. The system which had
been designed in this paper is a Visual
Statistics and Reporting System to analyses
officer‟s data in virtual office platform.
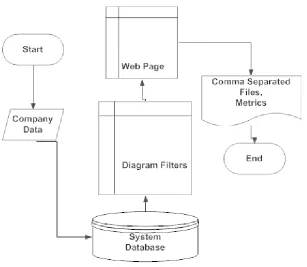
Figure 1-1 User Action Metrics Immersive Environment (UARMIE) Overview
Project Objectives:
The outputs of this project are the
Visual Statistics and Reports which could be
presentable information, or to be such a
form which could be plugged in presentable
software. The target output would be the
behavior of the company Personnel's daily
work. These Outputs could be important
Top Officials to evaluate their user‟s
activities.
Some of the filters which designed as
example:
● Attendance or Logs of users
● Total Time the Clients spend
in the company
● Number of Tasks done by the
users
Constraints :
Since, this system is going to be part of
company platform; it should be compatible
with the company infrastructure which
includes its data storage, security
requirement and business rules. Therefore,
the system designed as web application in
our case.
Project Goals
The goals of this project are:
1. To create a web application to fulfill
the requirements of company which
could be expanded as the number of
company‟s clients increased.
2. To track specific authorized users
which include:
● Individual Users
● Group Users,
● Organizations
● Forums
3. To develop a multi-tenant
infrastructure where there is selective
access of different users‟ data as they
use the End User Metrics Reporting.
4. To develop a data visualization and
reporting system, to be presentable
by users.
One of the output‟s samples should be
saved and documented using a .CSV
(Comma Separated File) which could be
accepted as a reporting output.
Methods and materials
Project Plan
Planning-backlog:
By using this planning method we
determine the most vital part of the project
method. We named and divided the parts of
project as stories, respectively from the
biggest to smallest and toughest to easiest
part had been scheduled.
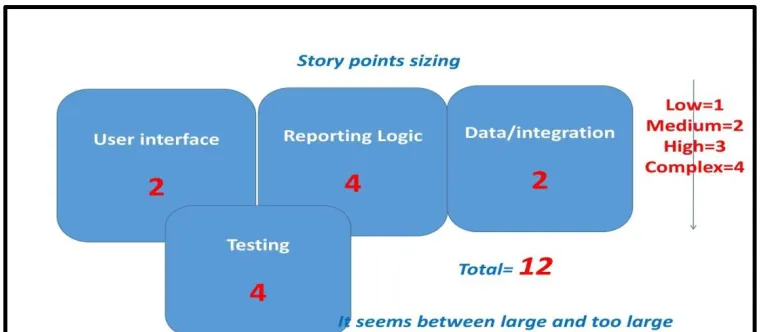
Figure 1.6. Priority of scopes
Literature Survey
We believe that there are some essential
features and elements in web analytics and
reporting which every web analytic service
should provide for their clients. Here are
some of them which might be helpful for
this project:
1. Ad-hoc Reporting:
● Immediate and linear
reporting
● Immediate and linear analysis
● Customer data selection
● Export platform linkage
capabilities
● Simple format
2. Pivot table report:
● Data viewing from multiple
angles
● User‟s choice to analyze their
desire data
● Trend discovering
● Ability to perform desired
data comparison
3. Responsive reporting to client‟s
demands :
● Analysis of a portion of data
● High level business data
● Sorted data representation
4. Dashboards:
● High level data visualization
(graphs, metrics)
● Daily accessibility of data for
decision making among
company management and
executives
● Provide alert and warning of
impending crisis in an
organization
5. Ranking capabilities:
● Multiple way of ranking
companies
● Ranking over multiple times
to keep companies motivated
6. Digging Reports:
● Digging the information as
much as possible
● Collaborative charts
● Responsive data visualization
(responsive graphs)
Functional Requirements
Specific criteria which this system should
track would be counted as follow:
Tracking Targets
The initial functions would be
focused on the system presenting an
authorized user (Administrator) and basic
activity tracking:
● user
● user group
● forum
● organization
Target Activities
In addition to the tracking targets,
there should be an ability to track the use of
specific items such as reporting the metrics
on:
● Clicking on a sign or
item
● Getting a platform to
choose the types of visual
● Reporting the
searched visual statistics
Filters :
The administrator should be able to
utilize the initial filters where applicable
within the Reporting Web Pages.
● Start and stop date
and time for report and
Visual Statistics
● Specific exclusion or
inclusion adjustments to the
target of the report, such as
including the user‟s group
except for specific users
● Set all, organization,
organization/forum or user‟s
filters or a combination of
them.
Performance Capabilities
Report presentation
Max, Min, Average
For most reports, it will make
sense to provide the maximum, minimum
and average of certain data for reporting
purposes.
The Report specifics are as below:
Summary & Visualization
A. 24 hours a day time slot for
filter purposes to be the
selected target and location (
visual statistics representation
)
B. All Possibilities
● Per days, hours, users
and average per day
● Login hours per day
and its daily average
● Per user or group
sections
● All logins over a time
period
● Total time logged in
for all users selected
● Total time used (sum
of all users use time)
organization,
organization/forum
C. Average login time for all
users selected
● Specific on logins per
user (responsive
report)
● Average logged in
hours per user
● Each login time and
location, followed by
each log out and
location of logout
with duration
● Per system,
organization,
organization/forum
D. All of logins over the time
period per system,
organization,
organization/forum specifics
● Average logged in
time per system,
organization,
organization/forum
specifics
● Per activity/item
Artifact usage
● Yes/No selection with
drill down on date and
time per
score if applicable
● Total number of times
used (duration or
clicks, etc.) by all
selected users
● Average times used
per user (duration or
clicks, etc.) by all
selected users
Premium planning Special Reports
For some clients, special
reports might be required which requires
tracking reports that tie an end user in the
Interface Requirements
First Release
The initial release of this system will
support the following interfaces based on
filters mentioned previously:
1. Basic Tracking
Report (Webpage)
2. Admins Activity
Report (Webpage)
3. Artifact/Activity Use
Report (Webpage)
Second Release
Updates to come after the
initial capabilities could be provided by
(Report Layout Concepts):
1. Webpage quadrant
layout style with
filters at upper left,
2. Summary of data at
upper Right,
3. Scroll down date
under bottom left and
4. Visualization of data
at bottom right.
These web pages would consist of:
● Total of unique users who
logged in during duration more than
5 mins
● Total number of logins for
more than 5 mins during a specific
duration
● The total time of all users that
were logged in during a specific
duration
● The average login time of
users during a specific duration
Figure 3.2. specific report output
Results
Survey Conclusion
According to review of different web
analytic systems, it attempts to collect most
effective applications which guarantee a
successful analytic system. Here are some of
them:
1. Easy and Responsive User
Experience, GUI and data
visualization
2. Platform with business
prediction capabilities
3. Printable and representable
report platform linkage to
multiple digital environments
4. Selective presentation of data
as there are a lot of important
elements in virtual world.
System structure
Database /Security methodology
Database methodology
Designing each part of the project should
be carried out well by the developer with
consideration to the project cost and time
which are important criteria for each
business infrastructure. There are two
approaches based on the assumptions for
database design which would be categorized
1. Shared approach: One or shared
database infrastructure /shared
database schemas or separate
schemas.
2. Isolated approach: Many database
infrastructure /Many database
schemas
Since, the important criteria for our
system are secure functionality of the
project; therefore, it is better to separate the
Clients Data Storages. The second approach
had been chosen to have a better
multi-tenant Data Structure which is Isolated
Databases with Many database Schemas.
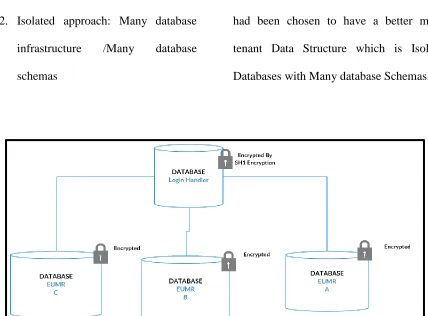
Figure 4.2.Isolated Databases with Encrypted passwords
In this approach, there is only one
database for each company administrator to
serve their customer analytics. There is
another main database (Login Handler) as
seen in Figure 4.1 which would handle all
Signup and Logs.
Security methodology
As we had chosen the data structure to be
physically separated; we have partly secured
the multi-tenancy of the user's data.
However, it is always a good try to rely on
the system‟s vulnerability instead of the
happened, we chose the email authentication
in passing the ID and Password of users by
sending them with PHP Mailer which is the
library made by Google. The reason why
PHP Mailer is used is that many steps are
needed to pass if one is trying to make
his/her own email sender and receiver
application. At the same time, almost all
email service providers had secured
themselves by these kinds of email.
The Security Levels which had been
attempted for this project are:
1. Database physical separation with
different authentication keys.
2. User‟s Authorization based on their
authentication with the company
3. Passing user‟s new authentication of
using End User Metrics by their
email accounts.
4. Authentication checking of users by
using Parameter Binding to avoid
database injection.
5. Using Hash Function 160 bits
encryption for password Encryption
within the database
Figure 4.3.Parameter binding, to check user‟s Authentication
Figure 4.7. Entity Relationship Diagram Schema (Main Db)
Conclusion
From the conclusion which might be
gathered, for designing of the End User
Action Reporting Model for Immersive
Environment would be a set of
functionalities, which had been designed to
help companies for completion of their Data
analytics and virtualization as a service. It
has the capability to compatible with kinds
of data with different kinds requested filters
to meet their clients need. Once they used
this system as the backbone of their analysis,
there might be a continuation in
development and expansion of this system,
has the capability to be used for online or
offline systems.
Since we had developed an expandable
system that is built to meet client‟s
requirement, it is an important matter to
keep the clients and stakeholders updated.
Continuous feedback might be needed to
update the client‟s need and expectation
from the End User Metrics System.
REFERENCES
[1] Dennis.R.Mortensen
(Ed).(May,11,2009). (Yahoo!
Web Analytics: Tracking,
Reporting, and Analyzing for
Data-Driven Insights Paperback)
[2] Forbes-Gil Press (May 2013).(A
Very Short History of Data
Science)
[3] Terf (3DICC)‟S Web
Site-3DICC .(2015).(
http://www.3dicc.com/)
[4] Eetu
Kuneinen(March,27,2014).(http:
//eethuu.com/google-analytics-
10-pros-5-cons/)
[5] Clicky Analytics Company
(http://www.aboutanalytics.com/
roxr-software/clicky) Mocha
Host The Server used
-(https://www.mochahost.com/)
[6] PHPMailer-Email services-
https://github.com/PHPMailer/P HPMailer/blob/master/examples /gmail.phps) [7] JSONP-https://en.wikipedia.org/wiki/JS ONP
[8] Web development-(
https://www.w3school.com)
[9] 17 Proven Website Hacks &
Tricks – By Shock Media Studio
[10] Php Development –
(www.Php.Net)
[11] Web Development –
(www.Stackoverflow.Com)
[12] Pass Date Parameter To
Highchart Line Chart –
(Https://Blueflame-Software.Com/Pass Date-
Parameter-To-Highcharts-Line-Chart/)
[13] Highcharts –
(www.Highcharts.Com)
[14] Intermediate Jquery Tutorial 5 –
Learning Jsonp –
(Https://Www.Youtube.Com/
[15] Database Security Issues –(
Https://Www.Oracle.Com/Data
base/Security/Index.Html)
[16] Big Data – Nathan Marz And
James Waire – Chapter 1 To
Chapter 3
[17] Interactive Data Visualization
For The Web – Book By Scott
Murray
[18] Visualizing Data : Exploring
Data With The Processing
Environment – By Ben Fry
[19] A Project Guide To Ux Design
–By Russ Unger And Carolyn
Chandler
[20] “A Better Way To Learn
Angular 2” Tutorial –