Western University Western University
Scholarship@Western
Scholarship@Western
Electronic Thesis and Dissertation Repository
4-19-2012 12:00 AM
Making Sense of Document Collections with Map-Based
Making Sense of Document Collections with Map-Based
Visualizations
Visualizations
Olga Buchel
The University of Western Ontario
Supervisor Kamran Sedig
The University of Western Ontario
Graduate Program in Library & Information Science
A thesis submitted in partial fulfillment of the requirements for the degree in Doctor of Philosophy
© Olga Buchel 2012
Follow this and additional works at: https://ir.lib.uwo.ca/etd
Part of the Library and Information Science Commons
Recommended Citation Recommended Citation
Buchel, Olga, "Making Sense of Document Collections with Map-Based Visualizations" (2012). Electronic Thesis and Dissertation Repository. 523.
https://ir.lib.uwo.ca/etd/523
This Dissertation/Thesis is brought to you for free and open access by Scholarship@Western. It has been accepted for inclusion in Electronic Thesis and Dissertation Repository by an authorized administrator of
Making Sense of Document Collections with
Map-Based Visualizations
( Thesis format: Integrated-Article )
by
Olga Buchel
Graduate Program in Library and Information Science
A thesis submitted in partial fulfillment
of the requirements for the degree of
Doctor of Philosophy
School of Graduate and Postdoctoral Studies
The University of Western Ontario
London, Ontario, Canada
ii
THE UNIVERSITY OF WESTERN ONTARIO School of Graduate and Postdoctoral Studies
CERTIFICATE OF EXAMINATION
Supervisor Examiners
________________________________
Dr. Kamran Sedig _________________________________ Dr. Paulette Rothbauer
Supervisory Committee
Dr. Victoria Rubin Dr. D. Grant Campbell
________________________________ Dr. Anabel Quan-Haase
________________________________ Dr. Luiz Fernando Capretz
________________________________ Dr. Karyn Moffatt
The thesis by
Olga Buchel
entitled:
Making Sense of Document Collections with Map-Based Visualizations
is accepted in partial fulfillment of the requirements for the degree of
Doctor of Philosophy
________________________________
iii
Abstract
As map-based visualizations of documents become more ubiquitous, there is a greater need for
them to support intellectual and creative high-level cognitive activities with collections of
non-cartographic materials — documents. This dissertation concerns the conceptualization of map-based
visualizations as tools for sensemaking and collection understanding. As such, map-based visualizations
would help people use georeferenced documents to develop understanding, gain insight, discover
knowledge, and construct meaning.
This dissertation explores the role of graphical representations (such as maps, Kohonen maps,
pie charts, and other) and interactions with them for developing map-based visualizations capable of
facilitating sensemaking activities such as collection understanding. While graphical representations
make document collections more perceptually and cognitively accessible, interactions allow users to
adapt representations to users’ contextual needs. By interacting with representations of documents or
collections and being able to construct representations of their own, people are better able to make sense
of information, comprehend complex structures, and integrate new information into their existing mental
models. In sum, representations and interactions may reduce cognitive load and consequently expedite
the overall time necessary for completion of sensemaking activities, which typically take much time to
accomplish.
The dissertation proceeds in three phases. The first phase develops a conceptual framework for
translating ontological properties of collections to representations and for supporting visual tasks by
means of graphical representations. The second phase concerns the cognitive benefits of interaction. It
conceptualizes how interactions can help people during complex sensemaking activities. Although the
iv
of Google Maps and can be applicable to various other technologies. The third phase evaluates the
utility, analytical capabilities and usability of the additional representations when users interact with a
visualization prototype – VIsual COLlection EXplorer. The findings suggest that additional
representations can enhance understanding of map-based visualizations of library collections:
specifically, they can allow users to see trends, gaps, and patterns in ontological properties of
collections.
v
Co
‐
authorship statement
I was primarily responsible for the research presented in this dissertation, including
conceptualization, study design, data collection, analysis, and manuscript preparation. The
conceptualizations presented in Chapters 3 and 4 were written with the guidance and assistance of Dr.
Sedig. They were submitted for publication as co-authored papers, with myself as the primary author.
For the study presented in Chapter 5, I designed the study, collected the data, analyzed the data, and
prepared the manuscript with the help of Dr. Sedig. The study will be submitted for publication as a
vi
Acknowledgements
As with every dissertation there are many people who provided various forms of guidance,
assistance, and encouragement. It is difficult to overstate my gratitude to my supervisor, Dr. Kamran
Sedig, for directing me along this particular line of research, and remaining patient with me throughout.
His editorial advice and precise sense of language was essential to the completion of this dissertation
and clearing the path towards thesis completion in his solution-oriented way. I am also thankful to him
for carefully reading and commenting on countless revisions of this manuscript. He has taught me
innumerable lessons and insights on the workings of academic research in general. I could not have
written this dissertation without his support.
The topic of this dissertation would not have been possible without the research done by the
pioneer in geodigital libraries – Dr.Linda Hill. As someone who once worked in the field, I have deep
respect and fondness for her work on merging text with coordinates, georeferencing, and building one of
the largest gazetteers in the world. I had many energetic and challenging conversations with Dr. Linda
Hill regarding the role of gazetteers in map-based visualizations. These discussions helped me better
understand the gaps in the research on geodigital libraries.
For this dissertation I would also like to thank my reading committee members: Dr. Victoria
Rubin and Dr. Grant Campbell for their time, interest, and helpful comments. I am indebted to Dr.
Victoria Rubin, who as a good friend, was always willing to help, give her best suggestions,
encouragement, support, and her willingness to discuss ideas at their initial stage.
I am grateful to Professor Emeritus Tim Craven and Dr. Grant Campbell for reading my early
writings about geospatial concepts, commenting on my views and helping me understand and enrich my
ideas and help me improve my knowledge of geospatial concepts in library catalogues. This helped me
vii
Jacquie Burkel for her insightful comments about the study; Dr. Diane Neal, for useful discussions about
geospatial concepts and geotagging; and Dr. Lu Xiao, for discussion about human-computer
interactions.
I had many fruitful conversations with fellow graduate students and colleagues. I am grateful to
Paul Parsons, Dr. Margaret Kipp, and Dr. Tatiana Vashchilko for discussions that exposed me to new
ideas, pushed my thinking in useful directions, encouraged me to keep writing, and helped me bypass
the more persistent obstacles to thesis completion.
My students of Geodigital Libraries class were of more help than they may realize. They
provided a stream of useful questions that forced me to clarify and think more carefully about certain
ideas and implementations. My special thanks go to Valentin Kelemen, Eva Fisher, Kristin Bogdan,
Carol Robinson, Francine Berish, and Sarah Simpkin.
I have also been fortunate in that the many members of staff at the libraries with whom I have
had contact have willingly shared their knowledge and skills. It is not possible to list all of these people
here but I would like to acknowledge the work of the librarians at the Graduate Resource Center at The
Faculty of Information and Media Studies, Slavic librarian-emerita Wanda Wawro at Cornell University
Library, reference librarian Regina Frakowiac and collection developer Grant Harris at the Library of
Congress. They helped tremendously with the search for all sorts of materials and understanding user
tasks and activities in Slavic collections. A special thank also goes to Slavic cataloguers and collection
developers at the Library of Congress who build such an outstanding collection of Local History of
Ukraine which I used for visualization in this dissertation.
I am also indebted to the many countless contributors to the “Open Source” programming
community (especially Mike Williams for his unofficial Google Maps API tutorial and countless
viii
used to develop the prototype visualization for this thesis. The entirety of my thesis has been completed
using such technologies and tutorials, and I consider it to have been an enormous benefit. Thank you,
keep up the good work.
I am deeply appreciative to the Faculty of Information & Media Studies for funding me
throughout the years and allowing me take leave of absence to take care of my daughter who was born
midway through this project.
Leaving the personal until last, I would like to thank those closest to me, whose presence helped
make the completion of my graduate work possible. My appreciation goes to my friend Carol
Hempstead for the words of encouragement and for helping me out with proofreading and catching my
typographical errors. I would also like to thank my family for all their love and encouragement. I would
like to express my heart-felt gratitude to my parents and my husband’s parents for their faith in me,
allowing me to be as ambitious as I wanted, helping with kids, and unconditional support. Most of all I
am thankful for my loving, supportive, encouraging, and patient husband Alex who in love and
companionship had, at times, to live with this thesis as much as me. His faithful support during these
years is much appreciated. I am also grateful to him for being my personal computer administrator who
maintained the server so efficiently that I never had to worry about viruses, losing files, creating backups
ix Contents
Abstract ... iii
Co‐authorship statement ... v
Acknowledgements ... vi
Chapter 1: Introduction ... 1
1.1 Motivation ... 1
1.2 Objectives ... 4
1.3 Structure of the Dissertation ... 6
1.4 References ... 9
Chapter 2: Background ... 12
2.1 References ... 22
Chapter 3: Extending Map-Based Visualizations to Support Visual Tasks: The Role of Ontological Properties ... 27
3.1 Introduction ... 28
3.2 Background Information ... 32
3.2.1 Ontological Properties of Documents and Other Objects ... 32
3.2.2 Representations ... 35
3.2.3 Visual Tasks ... 43
3.3 Prototype Map-Based Visualization System ... 45
3.3.1 Selected Document Collection ... 45
3.3.2 Representations of Ontological Properties ... 50
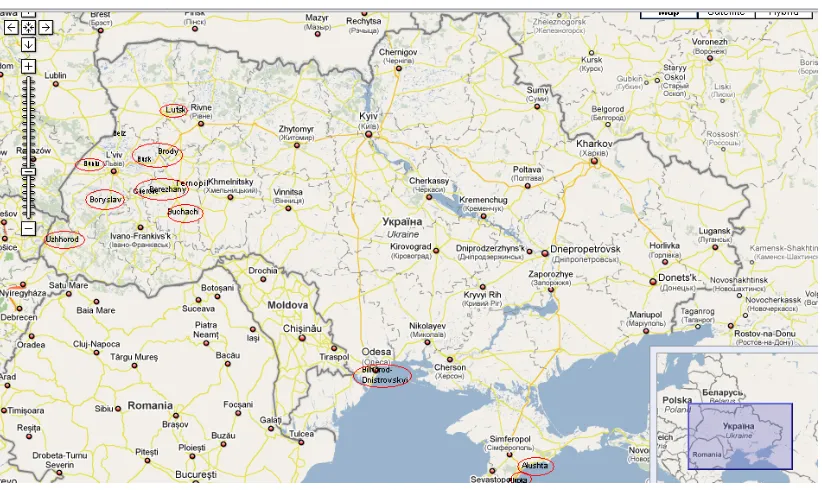
3.3.2.1 Placename Labels ... 50
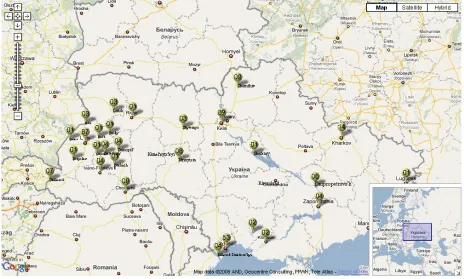
3.3.2.2 Symbols in Map-Based Visualizations ... 52
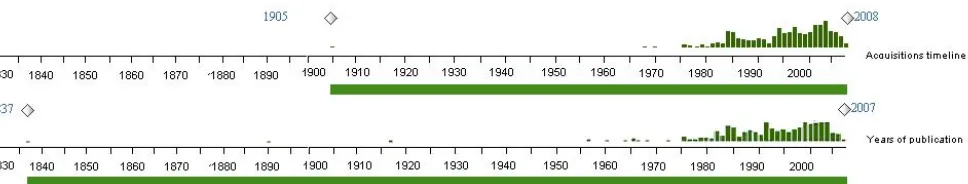
3.3.2.3 Timelines ... 55
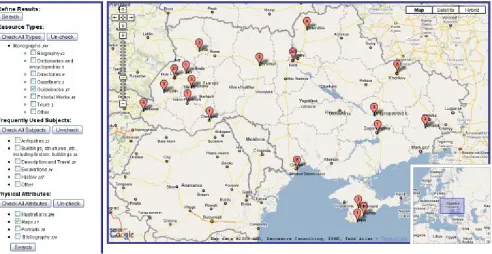
3.3.2.4 Legends ... 57
3.3.2.5 Legends and Graphical Representations ... 60
3.3.2.6 Additional Representations ... 62
3.4 Conclusions and Future Work ... 68
3.5 References ... 70
Chapter 4: Making Sense of Document Collections with Map-Based Visualizations: The Role of Interaction ... 79
x
4.2 Background Information ... 83
4.2.1 Types of MBVs ... 83
4.2.2 Document Collections ... 86
4.2.3 Activities, Tasks, and Interactions ... 89
4.2.4 Sensemaking ... 90
4.2.5 Collection Understanding ... 93
4.2.6 Information Spaces ... 94
4.3 VICOLEX ... 96
4.3.1 Description and Analysis of VICOLEX’s Document Collection ... 97
4.3.2 Systematic Design Using a Taxonomic Interaction Framework ... 100
4.3.3 Implemented Interactions in VICOLEX ... 102
4.3.4 Combining Interactions to Understand Collections ... 121
4.4 Conclusions and Future Work ... 128
4.5 References ... 131
Chapter 5: Can Additional Representations in Map-based Visualizations Enhance Sensemaking Activities Such as Collection Understanding? ... 139
5.1 Introduction ... 140
5.2 Background Information ... 141
5.3 Prototype ... 144
5.4 Methodology ... 147
5.5 Results ... 154
5.5.1 General Findings... 154
5.5.A Pie Charts ... 156
5.5.B Histograms of Years of Publication... 157
5.5.C Kohonen Maps ... 161
5.5.D Scatter Plots ... 167
5.5.E Representations of Places of Publication ... 171
5.5.F Author Representations ... 174
5.6 Summary and Conclusions ... 177
5.7 References ... 180
xi
6.2 Research Contributions and Conclusions ... 184
6.3 Significance for Libraries ... 186
6.4 Future Work ... 186
6.4.1 Evaluation of Interactions ... 186
6.4.2 Other Activities ... 187
6.4.3 Ontological Properties ... 189
6.4.4 Other Dimensions of Interaction ... 190
6.5 Conclusion ... 190
6.5 References ... 192
Appendix A ... 195
Appendix B ... 221
xii
Table of Figures and Tables
Figures
Chapter 3
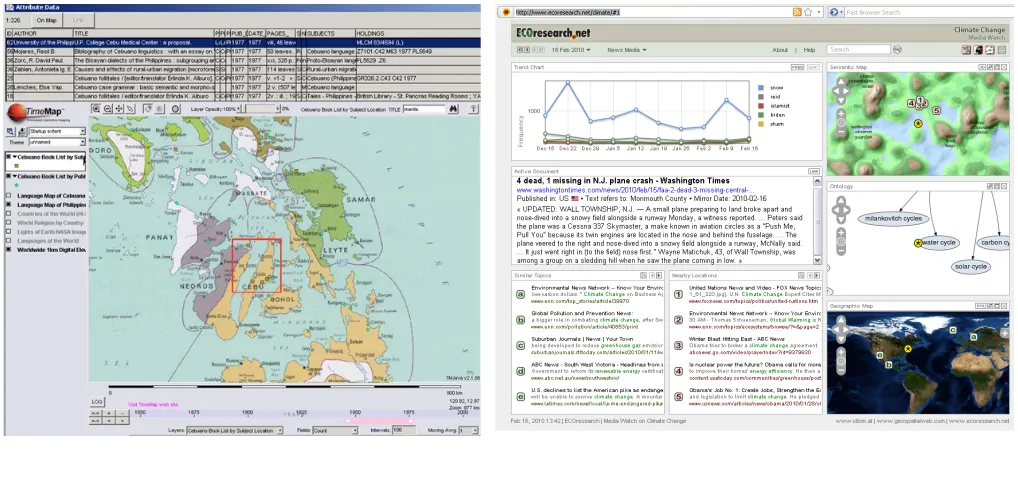
FIGURE 3. 1 EXAMPLES OF SPACE-TIME-AND-TOPIC-CENTRIC MAP-BASED VISUALIZATIONS... 30
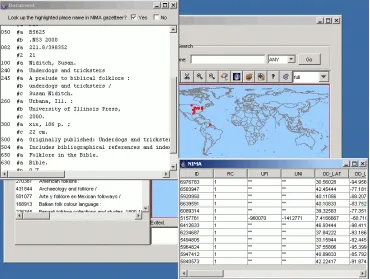
FIGURE 3. 2 A MAP-BASED VISUALIZATION WITH LINKS TO METADATA AND GAZETTEER RECORDS. ... 40
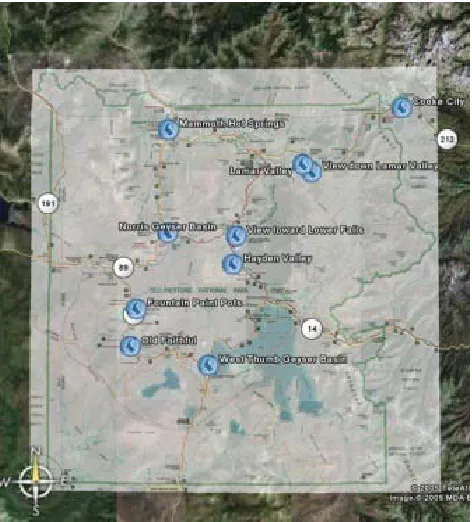
FIGURE 3. 3 A MAP OVERLAY. ... 42
FIGURE 3. 5 A MAP WITH ADDED PLACENAME LABELS. ... 52
FIGURE 3. 6 EXAMPLES OF QUANTITATIVE SYMBOLS. ... 53
FIGURE 3. 7 QUANTITATIVE SYMBOLS ON GOOGLE MAPS. ... 54
FIGURE 3. 8 HIERARCHICAL TIMELINES. ... 56
FIGURE 3. 9 A MAP WITH A LEGEND. ... 58
FIGURE 3. 10 FILTERING KOHONEN MAPS BY LINKING TO INFORMATION WINDOWS IN GM. ... 62
FIGURE 3. 11 A BOOK SIZE SCATTERPLOT. ... 64
FIGURE 3. 12 A COLOUR-CODED SCATTERPLOT... 65
FIGURE 3. 13 ADDITIONAL REPRESENTATIONS. ... 67
Chapter 4 FIGURE 4. 1 COLLECTION CONCEPT MAP ... 104
FIGURE 4.2NAVIGATION IN VICOLEX.. ... 105
FIGURE 4. 3 AN EXAMPLE OF LINKING IN VICOLEX. ... 108
FIGURE 4. 4 AN EXAMPLE OF FILTERING BY RUSSIAN LANGUAGE IN VICOLEX. ... 110
FIGURE 4. 5 ANNOTATING IN VICOLEX ... 115
FIGURE 4. 6 BOUNDING BOX SELECTION IN VICOLEX. ... 118
FIGURE 4.7EXAMPLE OF GATHERING ... 121
FIGURE 4. 8 EXPLORING LOCATIONS TO FIND WHICH LOCATIONS ARE LOCATED ON RIVERS.. ... 123
FIGURE 4. 9 COLLECTIONS PRE- AND POST-SOVIET ERA. ... 124
FIGURE 4. 10 DISTRIBUTION OF BOOKS WITH MAPS ... 125
FIGURE 4. 11 DISTRIBUTION OF POLISH LANGUAGE BOOKS. ... 125
FIGURE 4.12BOOK SIZES OF COLLECTIONS ABOUT SMALL AND LARGE LOCATIONS ... 126
xiii
Chapter 5
FIGURE 5. 1 VICOLEX. ... 146
Tables
Chapter 3
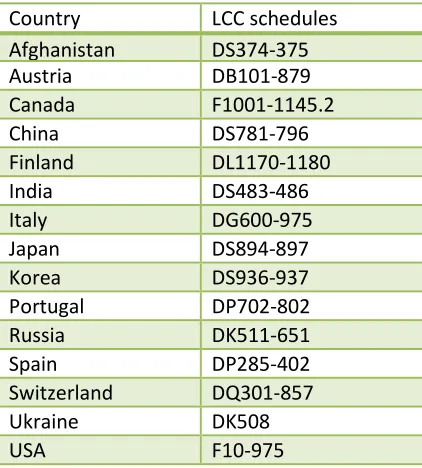
TABLE 3. 1 LCC CLASSES ABOUT LOCAL HISTORY AND DESCRIPTION ... 46
Chapter 4
1
Chapter 1:
Introduction
1.1 Motivation
The topic of this dissertation was inspired primarily by the research exploring the relationship
between graphical representations and text. The relationship between graphical representations and text
has a long history that spans thousands of years. Chronologically graphical representations preceded text
representations. Early forms of representations such as pictograms (or pictographs), ideograms,
petroglyphs, and mandorlas were used in ancient societies to communicate concepts, objects, activities,
places, events, ideas, symbols, or rituals because people did not know how to relay messages in any
other way. These early representations were precursors of writing. With the invention of writing,
however, graphical representations had to yield to writing systems because their communicative power
was considered much weaker. Text representations appeared to be far more superior for “presenting
correlations and for producing arguments based on them” (Neurath, 1996, p. 328), explaining something
in detail. Unlike text, graphical representations could not render smells, noises, and feelings, and often
could not be understood universally, but only in relation to a specific context, cultural background, and
the previous experience of the perceiver (Neurath, 1996), and therefore were considered inferior to
written text.
But nowadays due to unprecedented overproduction of textual information, history makes a
U-turn and re-evaluates the role of graphical representations. Research in various disciplines demonstrates
that despite limitations and shortcomings, different forms of graphical representation such as maps,
images, diagrams, graphs, and symbols can aid cognition to handle large volumes of information more
efficiently than text. For example, geographic maps can scaffold users in cognition of geographic space.
2
folds, tears, and cracks). Users have problems remembering distances and shapes (e.g., short distances
are overestimated and long distances are underestimated; curves are often remembered as straighter than
they actually are) (Tversky, 1981). Maps help users overcome such imperfections. What concerns
images, everyone knows that pictures are worth a thousand words. Otto Neurath, an Austrian educator
and sociologist, saw images as having a longer life and greater impact especially at the first stage of
getting new knowledge (Jansen, 1996). Diagrams help people externalize their problems (DeLeeuw &
Hegarty, 2008), reduce complexity and amplify cognition; they help in understanding causal
relationships, categorizing and organizing information (Burkhard, 2004; Chen, 1996). Graphs provide
excellent aid for making comparisons or visualizing relationships (Scragg, 2000; Peebles & Cheng,
2001; Harris, 1999), enhancing visual and retrieval tasks (Spoerri, 2004), and knowledge construction
(Shah, Mayer, & Hegarty, 1999). Expressing knowledge through symbols may facilitate the transfer of
learned knowledge to novel situations (Sloutsky, Kaminski, & Heckler, 2005). Symbols have been used
for augmenting information retrieval and helping users to discriminate relevant documents from
non-relevant (Hearst, 1995; Korfhage, 1991; Hemmje, Kunkel, & Willett, 1994; Spoerri, 2006).
While there is no doubt that graphical representations can support synthesis of text information,
the translation from text to representations is problematic. The majority of translational mechanisms
have been well-established for quantitative data (see, e.g., Tukey, 1988), not text. History of library and
information science, however, has witnessed several attempts to represent language with representations.
One of the first people who utilized graphical representations for linguistic categories was Otto Neurath.
He designed a method, The Vienna Method of Picture Statistics, which he used to develop an
international visual language the International System of Typographic Picture Education (known as
ISOTYPE) (Chapel, 1996). In 1923 he published nearly two thousand pictographs, which personify
3
pictographs were meant to be used for communication of statistical information between nations and for
education of the illiterate (Breitenstein, 2006; Dalbello & Spoerri, 2006). Later attempts were based on
statistical techniques. Among such techniques are vector-space model, dimension reduction techniques
(e.g., multidimensional scaling, self-organizing maps, latent semantic indexing), layout algorithms (e.g.,
energy minimization/force-feedback models) (Börner, Chen, & Boyack, 2003; Friendly, 2000; Fabrikant
& Buttenfield, 2001). The aim of the majority of these algorithms is to obtain macro views of collections
of text, showing the relative positions and relationships among major topics, and to display large
amounts of data in a limited space. However, many of these approaches have shortcomings. ISOTYPE
pictographs are regarded outdated, old-fashioned, and difficult-to-interpret (Holmes, 2001);
statistically-generated representations are often criticized for not being cognitively-plausible (Fabrikant &
Buttenfield, 2001; Chen & Börner, 2002; Ancona, Freeston, Smith, & Fabricant, 2002; Fabrikant,
Montello, Ruocco, & Middleton, 2004).
The key problem with translating text to graphics is that information in text is multifaceted and
culture-and language-dependent. Text has different ontological properties which can be represented
with different representations. For example, geographic concepts can be best understood in the context
of maps; other subjects, in the context of trees or Kohonen maps; and so on. In addition, text properties
and representations vary from culture to culture and from language to language. For this reason, there
are many unanswered questions regarding representations: How can they work together? How can they
be used to represent different collections of text in different languages?
My interest in representations has later merged with the need to extend the range of tasks and
activities with graphical representations. This research direction was formulated in the early 1990s by
the pioneer in geographic information retrieval Dr. Linda Hill (1990). Despite the fact that the need was
4
the work at the level of a single document (i.e., searching, browsing, navigating, and identifying). Such
tasks are typical for text representations. However, the transition from text to graphical representations
predisposes users to work with large volumes of information and to make sense of large document
collections, not single documents. At this level, people engage in higher-order cognitive activities such
as sensemaking, visual analysis, and other activities. How can these higher-level cognitive activities be
conceptualized and translated to interactions with maps and other graphical representations is the
question that this dissertation aims to answer. Even though the second generation digital maps such as
Google Maps are equipped with rich interactions (zooming, panning, navigation, browsing, and others),
conceptualization of interactions opens up a Pandora’s box of issues associated with choosing the right
interaction techniques for specific tasks: there simply is no good prescription for designing an effective
dialogue between humans, text, Google Maps, and other representations. Moreover, there is a lack of
evaluation proving the efficiency of certain interactions in support of specific tasks and activities. As a
result, we have an opportunity and a need for interdisciplinary research to bridge this gap. I believe that
my background in library and information science, working experience at the Alexandria Digital
Library, one of the first geodigital libraries, and extensive readings in information visualization and
geovisualization have put me in a unique position to undertake research about representations,
interactions, and tasks for defining a framework for visualizing text on Google Maps.
1.2 Objectives
In this dissertation, I am considering a special instance of text - Knowledge Organization
Systems (KOS) such as metadata and classifications and a special instance of graphical representations –
digital maps such as Google Maps. In particular I am investigating the phenomenon of georeferences in
KOS. KOS in library catalogues are imbued with indirect georeferences (Petras, 2004; Buchel, 2006;
Hill, 2006). Indirect georeferences are references to geographic locations in a form of subjects, terms, or
5
Among their advantages is that they can facilitate text retrieval; and they can help with an understanding
of hierarchical relationships among geospatial concepts. But at the same time, linguistic representations
have many shortcomings since they cannot show many spatial locations and relations simultaneously
(Uttal, Fisher, & Taylor, 2006); and therefore cannot help users derive geospatial patterns, trends, and
relationships (Card, Mackinlay, & Shneiderman, 1999; Spence, 2001; Peuquet, 2002). Language by
nature is categorical and is more reliable for conveying categorical spatial relations (e.g., is part of
Ontario) than exact ones (such as metric or coordinates) (Leibowitz, Guzy, Peterson, & Blake, 1993;
Hill, 2006) but which are critical for spatial reasoning and thinking. Besides this, the linear nature of
language is ill-suited for representing higher dimensionality of spatial information which is commonly
characterized by four dimensions: longitude, latitude, altitude, and time (Peuquet, 2002).
To make geospatial locations and relationships more salient and meaningful, georeferences need
to be put in the context of map-based visualizations. This is the primary goal of this dissertation. While
previous research has investigated how to map georeferences (Buckland, Chen, Gey, Larson, Mostern,
& Petras, 2007; Hill, 2006; Zerneke, Buckland, & Carl, 2006) and how to automatically geocode KOS
(Freire, Borbinha, Calado, & Martins, 2011), this dissertation takes a broader approach and investigates
not only how to put georeferences on a map, but how to design maps that can help people think,
understand, and perform higher-order cognitive activities with KOS such as sensemaking, visual
analysis, problem solving, knowledge discovery, and so on. Higher-order cognitive activities are very
difficult to conceptualize, since to date there are no prescriptions on how to disassemble activities with
information into smaller, simpler tasks such as searching or checking out a book at a library, because
besides tasks such activities also include many cognitive processes the support for which is difficult to
provide programmatically. There are some general models of such activities (see, e.g., in Pirolli & Card,
6
Furthermore, putting KOS on a digital map adds a host of issues associated with the granularity of
knowledge represented in KOS. While georeferences alone can be described in four dimensions, the
number of dimensions in KOS is uncertain and can be very large; each of these dimensions can have
representations; whereas different representations can support different tasks.
The investigation in this dissertation took a multidisciplinary approach. Various design
components were drawn from studies on geovisualization, information visualization, and digital
libraries. Ideas about conceptualization of tasks and activities were drawn from studies on cognition,
human computer interaction (HCI), geovisualization, information visualization, and library and
information science (LIS). By taking a multidisciplinary approach, novel ideas were generated that
would otherwise be left out if the investigation was focused on one aspect of the problem (e.g.,
georeferences). According to Monk and Gilbert (1995, p.8) multidisciplinary research can only be
“effective when it involves the creative juxtaposition of different approaches around a specific problem,
so that each can shed its own light on the issues.” This strategy had a significant impact on this
dissertation. Rather than focusing research efforts only on the LIS domain to solve this complex
problem, the research integrated and culminated collaborative efforts involving many disciplines.
1.3 Structure of the Dissertation
Chapter 2 provides background information about the core concepts necessary to understand this
dissertation: ontological properties, georeferences, representations of ontological properties, and
interactions. After the background chapter, the dissertation is organized as a collection of articles, each
presented as a separate chapter. In spite of the dissertation being organized as a collection of articles,
and not as a monograph, the chapters share several theoretical and empirical properties and follow a
logical sequence with each chapter building on the previous one. The findings in the articles, separately
7
and interactions in map-based visualizations, and to the role of interactions and representations in
facilitating sensemaking activities. As a result, each chapter includes its own introduction and
background material, as well as its own list of references. The articles are presented as they appeared at
the date for submission. The article in Chapter 3 was published in May, 2011 issue of the Knowledge
Organization journal. The article in Chapter 4 is under review in Information Research Journal. The
article in Chapter 5 has been submitted to the Journal of Digital Information.
The first two articles present conceptualizations to guide the design of map-based visualizations
as tools for sensemaking. The first conceptualization (Chapter 3) explains the role of additional
graphical representations in facilitating elementary and synoptic visual tasks. This conceptualization
brings together research findings on the utility of additional representations from the research on digital
libraries, geovisualization, and information visualization. The second conceptualization (Chapter 4)
describes a methodology for designing interactions suitable for facilitating higher-order cognitive
activities such as sensemaking. Despite a common view that interactions do not directly contribute to
understanding, this chapter explains how interactions can simplify and augment sensemaking activities
incrementally by helping people prepare documents and information in documents for visual tasks and
ultimately higher-level sensemaking. This conceptualization brings together research findings on
interactions from a wide range of research fields, including digital libraries, human-computer
interaction, information visualization, and to a lesser degree, cognitive science. All examples in both
conceptualizations are illustrated with the prototype - Visual COLlection EXplorer (VICOLEX) –
designed for facilitating an understanding of a Local History collection from the Library of Congress
catalogue. The third article (Chapter 5) assesses the ability of additional representations and selected
8
first, and partially the second conceptualizations. The dissertation concludes with a summary of the
9
1.4 References
Ancona, D., Freeston, M., Smith, T., & Fabricant, S. (2002). Visual explorations for the Alexandria Digital Earh Prototype. In K. Börner, & C. Chen (Eds.), Visual interfaces for digital libraries (pp. 199-213). Berlin: Springer-Verlag.
Börner, K., Chen, C., & Boyack, K. (2003). Visualizing Knowledge Domains. Annual Review of Information Science and Technology, 37.
Breitenstein, M. (2006). Global Unity: Otto Neurath and the International Encyclopedia of Unified Science. In G. Budin, & C. Swertz (Ed.), “Knowledge Organization for a Global Learning Society” Ninth International ISKO Conference. Vienna, Austria.
Buchel, O. (2006). Uncovering Hidden Clues about Geographic Visualization in LCC. In G. Budin, & C. Swertz (Ed.), Proceedings International Society for Knowledge Organization Conference, (pp. 77-84). Vienna, Austria.
Buckland, M., Chen, A., Gey, F. C., Larson, R. R., Mostern, R., & Petras, V. (2007). Geographic search: catalogs, gazetteers, and maps. College and Research Libraries, 68 (5), 376-387.
Burkhard, R. (2004). Learning from Architects: The Difference between Knowledge Visualization and Information Visualization. Eighth International Conference on Information Visualization, (pp. 519 - 524).
Card, S. K., Mackinlay, J. D., & Shneiderman, B. (1999). Readings in Information Visualization: Using Vision to Think. San Francisco, CA: Morgan Kaufman Publishers.
Chapel, E. (1996). Otto Neurath and the CIAM - The International Pictorial Language as a notational system for town planning. In E. Nemeth, & F. Stadler (Eds.), Encyclopedia and Utopia; the life and work of otto Neurath (1882-1945) (pp. 167-182). Boston: Kluwer Academic Publishers.
Chen, C., & Börner, K. (2002). Top ten problems in visual interfaces to digital libraries. In K. Börner, & C. Chen (Eds.), Visual interfaces for digital libraries (pp. 199-213). Berlin: Springer-Verlag.
Chen, P.-H. (1996). Problem solving and learning with diagrammatic representations in physics. In D. Peterson (Ed.), Forms of Representation (pp. 47-66). Intellect, Ltd.
Dalbello, M., & Spoerri, A. (2006). Statistical representations from popular texts for the ordinary citizen, 1889-1914. Library and Information science research (28), 83-109.
DeLeeuw, K., & Hegarty, M. (2008). What Diagrams Reveal about Representations in Linear
10
Fabrikant, S. I., Montello, D., Ruocco, M., & Middleton, R. (2004). The distance similarity metaphor in network display spatializations. Cartography and Geographic Information Science, 31 (4), 237-252.
Fabrikant, S., & Buttenfield, B. (2001). Formalizing Semantic Spaces For Information Access. Annals of the Association of American Geographers, 91 (2), 263–280.
Freire, N., Borbinha, J., Calado, P., & Martins, B. (2011). A Metadata Geoparsing System for Place Name Recognition and Resolution in Metadata Records. JCDL 2011. Ottawa, Canada.
Friendly, M. (2000). Visualizing Categorical Data. Cary, NC: SAS Publishing.
Harris, R. (1999). Information graphics: a comprehensive illustrated reference. Atlanta, GA: Management graphics.
Hearst, M. (1995). TileBars: visualization of term distribution information in full text information access. Proc. of the ACM SIGCHI conference on Human Factors in computing Systems, (pp. 59-66). Denver, CO.
Hemmje, M., Kunkel, C., & Willett, A. (1994). LyberWorld—a visualization user interface supporting fulltext retrieval. Proceedings of the 17th annual international ACM SIGIR conference on Research and development in information retrieval (pp. 249 - 259). New York, NY: Springer-Verlag.
Hill, L. (1990). Access to geographic concepts in online bibliographic files: Effectiveness of current practices and the potential of a graphic interface. Unpublished dissertation, University of Pittsburg. Hill, L. (2006). Georeferencing : The Geographic Associations of Information. Cambridge, MA: MIT Press.
Holmes, N. (2001). Pictograms: A view from the drawing board or, what I have learned from Otto Neurath and Gerd Arntz (and jazz). Information Design Journal, 10 (2), 133-144.
Jansen, A. (1996). Isotype and Infographics. In E. Nemeth, & F. Stadler (Eds.), Encyclopedia and Utopia; the life and work of otto Neurath (1882-1945) (pp. 143-156). Boston: Kluwer Academic Publishers.
Korfhage, R. (1991). To see or not to see - is that the query? Proc. of the 14th Annual Int. ACM SIGIR Conference, (pp. 134-141). Chicago, USA.
Leibowitz, H. W., Guzy, L., Peterson, E., & Blake, P. (1993). Quantitative perceptual estimates: verbal versus nonverbal retrieval techniques. Perception (22), 1051-1060.
Monk, A., & Gilbert, N. (1995). Inter-disciplinary research. In A. Monk, & N. Gilbert (Eds.),
11
Neurath, O. (1996). Visual education: Humanization versus popularization. In E. Nemeth, & F. Stadler (Eds.),
Encyclopedia and Utopia; the life and work of otto Neurath (1882-1945) (pp. 245-335). Boston: Kluwer Academic Publishers.
Peebles, D., & Cheng, P.-H. (2001). Extending Task Analytic Models of Graph-based Reasoning: A Cognitive Model of Problem Solving with cartesian Graphs in ACT-R/PM. In E. Altmann, A.
Cleeremans, C. Schunn, & W. Gray (Ed.), Proceedings of the 2001 Fourth International Conference on Cognitive Modeling, (pp. 169-174).
Petras, V. (2004). Statistical Analysis of Geographic and Language Clues in the MARC Record.
Technical reportfor the "Going Places in the Catalog: Improved Geographical Access" project,
supported by the IMLS National Leadership Grant for Libraries, Award LG-02-02-0035-02, University of California, Berkeley.
Peuquet, D. J. (2002). Representations of space and time. New York, NY: The Guildford Press.
Pirolli, P., & Card, S. (2005). The Sensemaking Process and Leverage Points for Analyst Technology as Identified Through Cognitive Task Analysis. Proceedings of the International Conference of
Intelligence Analysis.
Scragg, G. (2000). Problem Solving with Computers. Jones & Bartlett Publishing Co.
Shah, P., Mayer, R. E., & Hegarty, M. (1999). Graphs as aids to knowledge construction : Signaling techniques for guiding the process of graph comprehension. Journal of Educational Psychology, 91 (4), 690-702.
Sloutsky, V., Kaminski, J., & Heckler, A. (2005). The advantage of simple symbols for learning and transfer. Psychonomic Bulletin & Review, 12 (3), 508-513.
Spence, R. (2001). Information visualization. Harlow, UK: Pearson Education Limited.
Spoerri, A. (2004). Toward Enabling Users to Visually Evaluate the Effectiveness of Different Search Methods. J. Web Eng., 3 (3/4), 297-313.
Spoerri, A. (2006). Visualizing Meta Search Results: Evaluating the MetaCrystal toolset. ASIS&T Annual Meeting. Austin, Texas.
Uttal, D. H., Fisher, J. A., & Taylor, H. A. (2006). Words and maps: Children's mental models of spatial information acquired from maps and from descriptions. Developmental Science, 9 (2), 221-235.
Tukey, J. (1988). Exploratory Data Analysis. University Microfilms International.
Tversky, B. (1981). Distortions in memory for maps. Cognitive Psychology (13), 407-433.
12
Chapter 2:
Background
This chapter provides background information about core concepts necessary to understand the
remaining chapters in this dissertation. Specifically, this chapter introduces such concepts as ontological
properties, knowledge organization systems, representations, interactions, visual tasks, sensemaking
activity, and discusses the limitations of the existing map-based visualizations of library collections.
Libraries deal with many physical and abstract objects. These objects are documents, geographic
placenames, author names, subjects, and so on. Out of all these objects, documents are the most
significant ones; the rest are supplementary and support the organization of the former. Each object has
its own ontological properties. For instance, the ontological properties of a document may include its
author, title, publisher, height, number of pages, illustrative matter, indexical information, publication
language, subject, edition information, and publication date. Libraries differentiate as many as 2000
descriptive properties of published materials, out of which only 70-1071
In this dissertation, the descriptive properties in MARC are referred to as ontological because
they are explicit specifications of document conceptualization that define the vocabulary that describes
the concepts and the relations among them. According to Gruber (1993), such specifications comprise
ontologies. Treating metadata properties as ontological is not uncommon. Other researchers and
practitioners also view metadata standards as ontologies (see, e.g., Jacob 2003, Nogueras-Iso,
Zarazaga-Soria, & Muro-Medrano, 2005; Tsouvaras, 2008).
are regarded as the most
common ones.
Some of the ontological properties of publications are geospatial properties, recorded in metadata
either explicitly (in the form of geospatial coordinates) or implicitly (in the form of placenames,
1 These statistics are based on the recent study of MARC metadata (Moen & Miksa, 2007). The reference is made to Tables 13 and 14 of
13
standard numbers, or geographic codes) (Hill, 2006). These geospatial properties are the focus of this
dissertation, since only they have absolute locations suitable for map-based visualization and provide an
additional type of access to documents. Although not all geospatial properties in MARC have
coordinates which are necessary for map-based visualizations, this dissertation does not limit itself to
assigning coordinates to implicit georeferences, since this problem has been resolved by other
researchers (Freire, Borbinha, Calado, & Martins, 2011), instead it focuses on visualizing ontological
properties of documents.
Properties of various objects are captured in corresponding Knowledge Organization Systems
(hereafter abbreviated as KOS): gazetteers, authority records, and classification schemes (Hill, Buchel,
Janee, & Zeng, 2002; Zeng, 2008). Thus, properties of publications are described in item-level metadata
records (also known as bibliographic records); properties of placenames in gazetteer records; properties
of authors in authority records; and properties of subjects in classifications. Commonly, KOS are
characterized by rich content and reside outside of the collections of objects. They contribute controlled
sets of labels for concepts, authors’ names, etc; definitions; relationships that can be used to translate
between equivalent terms and support navigation using these relationships. This dissertation extends the
notion of KOS to item-level metadata standards such as MARC. Although MARC is distinct from other
content-containing KOS objects, such as the Getty Art & Architecture Thesaurus, which are used to
populate the fields in a particular MARC record, it has rich content and is used to organize knowledge
similar to other KOS schemes. For this reason, MARC is treated as a special form of KOS.
In the context of information systems, KOS can have multiple representations, in the form of
text, call numbers, glyphs, and others. The most common representations of existing KOS, however, are
in a form of text. Although text representations are capable of supporting various searching tasks; they
14
geospatial access to georeferenced collections. For example, text is ill-suited for making sense of
subjects, time periods, languages, book sizes, places of publication, and authors in collections about
various geographic locations. It does not easily give answers to the following types of questions: Which
collection has more books in English or French? Which collection has more books published in 2011:
Toronto or Montreal? Text also precludes users from distinguishing commonalities and idiosyncrasies of
KOS. According to Tufte (1990) text is also unrevealing of complex structures and relationships. As a
result, KOS are often caught up in the endless “flatland” of text. In such a “flatland,” it is difficult to
focus on groups of records, instead records have to be reviewed one at a time (Veerasamy, 1997).
However, there exist many other alternative representations for different ontological properties
of KOS. For example, subjects can be represented as a ThemeScape (Wise, et al., 1995), Kohonen Map
(Kohonen, 1995), Tree Map (Shneiderman, 1992), Topic Map (Weerdt, Pinchuk, & Aked, 2007; Le
Grand & Soto, 2002), Flickr-Style Tag Cloud (Bausch & Bumgardner, 2006), Cartogram (Keim, North,
Panse, & Schneidewind, 2003), Fisheye View (Furnas, 1986), or Hyperbolic Tree (Lamping, Rao, &
Pirolli, 1995).
The best representations for geospatial properties of KOS are digital maps (Hill, 2006). Maps
make the invisible visible, and facilitate understanding of things that are not easy (or sometimes even
impossible) to see in the real world or perceive directly through other senses (Edsall, 2001). Maps make
geospatial locations, spatial clusters, outliers, relationships among geospatial concepts, and geographic
proximity perceptually salient and expedite visual search for relevant information (Peuquet, 2002).
Unlike text, maps can help users understand what locations are represented in collections, what is their
density, how big are geographical distances among collections, how collections are distributed in space
15
The advantage of maps has been well-understood by geodigital libraries. Many of them use
map-based visualizations as interfaces for their collections (Buchel & Hill, 2009). Among the first adopters of
map-based visualizations were map libraries: the Georeferenced Information Network project, the
CARTO-NET project, some projects at the British Library (Hill, 2006), and the Alexandria Digital
Library2
But the early map-based visualizations of library collections have many shortcomings. For
instance, their functionality is often limited to spatial browsing and searching. Spatial browsing allows
users to select documents on a map (Larson, 1996). Spatial searching facilitates retrieval by
geographical location, placename, or subject theme (Panel on Distributed Geolibraries, National
Research Council, 1999). The representations of documents on such maps take forms of footprints or
icons (e.g., image thumbnails, markers, balloons, prisms, graduated circles, 3D spatial histograms of
dataset counts, stacks, and differently-shaped coloured blocks) (Ancona, Freeston, Smith, & Fabricant,
2002; Ahonen-Rainio & Kraak, 2005). As such visualizations encode only documents and their
quantities. The most advanced interfaces allow interacting with documents in space and time (see
Zerneke, Buckland, & Carl, 2006). Perseus Digital Library (ADL) at the University of California, Santa Barbara.
3 at Tufts University and Electronic Cultural
Atlas Initiative4
The literature on geovisualization is replete with suggestions about information visualization
techniques that can make map-based visualizations more engaging, useful, comprehensible, and
cognitively-plausible. Here are just a few examples. Pequet (2002) suggests improving geobrowsing
with images that “spark imagination” and various map interactions that aid users “to see emergent have such interfaces. This dissertation argues that even the most advanced map-based
visualizations of library collections lack proper support for understanding ontological properties.
2
3
16
features.” Fabrikant & Buttenfield (1997) propose to enhance browsing in map-based visualizations with
direct manipulation, coordinated windows with dynamic queries, and sliders. Ahonen-Rainio & Kraak
(2005) report the utility of additional representations in decision making about relevance of datasets.
Moreover, there exists empirical evidence that many of these visualization techniques have
positive effects on activities, tasks, and human cognition. Additional representations that complement
maps in a coordinated multiple view visualizations have been proven to be useful for knowledge
discovery, hypothesis generation, data mining, and visual analysis in different subject domains, contexts,
and spheres of human activities. Improvise visualization, for example, helped users reveal regular and
irregular periodic visitation patterns of guests at two hotels in central Pennsylvania from 1894 to 1900
(Weaver et al., 2007). The visualization approach for cancer data analysis described in (Guo, Gahegan,
MacEachren, & Peuquet, 2003; Guo, Gahegan, MacEachren, & Zhou, 2005) offered insights about
unknown patterns related to cancer. Additional representations such as self-organizing maps enhanced
extraction of properties, clustering, exploration, and knowledge discovery in the visualization prototype
described in (Koua, 2005).
The design of semantically-rich representations has been widely researched in information
visualization, cartography, and geovisualization. For example, Chernoff (1973) suggested using facial
features to represent multiple variables of k-dimensional data. Tufte (2001) developed principles of
graphical excellence. One of his principles is that graphical representations should give the viewer the
greatest number of ideas in the shortest time with the least ink in the smallest space. Spence (2007)
defined principles of design of multidimensional icons. In addition, a sizable body of research exists on
the utility of multiple representations. Combining representations (or multiple views) can support the
performance of specific tasks (Whitby, 1996). For instance, many visualization applications today are
17
packets can include maps, charts, self-organizing maps, and diagrams. According to Tufte (2001),
multiple representations can facilitate quantitative and comparative reasoning and convey information
through repetition by making small changes salient. “[M]ultiples work as efficient and convincing
summaries of data or an argument…” (Tufte, 1990, p. 30).
Another important aspect that should not be ignored in the design of map-based visualizations is
that static, non-interactive representations are not always effective in facilitating tasks and activities
(Spence, 2007). This is especially true for maps, because maps are complex representations that have
multiple layers and encodings. The literature on cognitive psychology shows that in order to deal with
complex imagery such as maps, people often use selective attention, apply spatial filters, suppress the
distracters and unattended information, and select targets (Astle, Scerif, Kuo, & Nobre, 2009; Yang,
Yuan, & Wu, 2007; Mozer, 1991; Luck & Hillyard, 1994; Thorpe, Fize, & Marlot, 1996; Desimone &
Duncan, 1995; Lueschow, Miller, & Desimone, 1994; Van Essen & Deyoe, 1995; Ullman, 1996; Moran
& Desimone, 1985).
To be useful, representations need to afford interactions, otherwise much of their semantic and
relational properties remain hidden and latent (Sedig & Sumner, 2006). In the context of this
dissertation, interactions refer to the actions that are performed on representations, and the subsequent
responses of those representations to those actions (Sedig & Sumner, 2006; Sedig & Liang, 2006). In
other words, interactions refer to “how people physically act on the environment and how the
environment responds” (Fast & Sedig, 2005). Interactions allow users to perform actions such as
arranging, navigating, zooming, chunking, annotating, composing, cutting, filtering, fragmenting, and
probing (Sedig & Sumner, 2006). They enable users to transform data by adding or subtracting
attributes, filtering in and out subsets of the data, and answering what-if questions through
18
Interactions act as extensions of static representations by making them dynamic, allowing their latent
meanings to become visible (Sedig & Liang, 2006), and by allowing users to adapt the visual
information according to their needs (Sedig, 2009) and to offload some of their cognitive processes onto
the computer (Sedig, Rowhani, & Liang, 2005).
Interactions also facilitate the conversion of information into knowledge. Knowledge does not
exist on its own. It is information that has been made sense of through human interaction with that
information; or in other words, information that has been processed (Buckland, 1991; Allen, 1996).
Knowledge is a process by which a user acts upon a body of information, interprets it, and integrates it
into his/her existing knowledge structures and schemata. As such, interaction can be viewed as the
mechanism that facilitates the discovery of latent elements and features of information, allowing users to
form mental models and understanding of the information, and, hence, supporting the knowledge
construction process.
Interactions, here, are narrower in scope than tasks or activities. They refer more to how people
perform low-level actions to carry out those higher-level tasks and activities. Tasks and activities refer
more to what people do with KOS. Consider, for example, the task of browsing books on bookshelves in
library stacks. The activity is browsing. Accomplishing this activity involves many actions such as
walking to the stacks, focusing on the books on the shelves, comparing their sizes, covers, languages of
publications, reading titles and years on the spines of the books, opening interesting books, reading
summaries inside the books, looking at the index or the table of contents, and so forth. However, it is
important to note that interactions with representations should not always be the same as actions
performed on real world objects. For example, the described activity of browsing the bookshelves in a
19
In online catalogues, users are presented with a list of items sorted by call number, where each item can
be probed by clicking on a hyperlink.
Interactions with map-based visualizations of documents are commonly limited to zooming and
panning. Users can zoom into various layers, focus onto geographical locations at different levels of
abstraction, navigate between different layers, and pan the map by dragging it to different locations.
Tasks with KOS5
Sensemaking consists of an interlocking set of different types of subtasks such as searching for
representations, encoding information in them to answer task-specific questions and to reduce the cost of
operations, information seeking, filtering, categorizing, comparing, synthesizing, aggregating and
scaling, identifying a critical subset, assessing, interpreting, and so on (Qu & Furnas, 2005; Russel, encompass finding, identifying, selecting documents, and acquiring or obtaining
access to documents (Svenonius, 2000). To visualize KOS on digital maps, digital library researchers
have merged KOS tasks with map interactions and geographic retrieval. As a result, map-based
visualizations of library collections support two fundamental tasks related to library collections and
geographic information retrieval – searching and browsing. The goal of this dissertation is to understand
how these tasks can be expanded. Some information behaviour models suggest that users’ interactions
with information encompass many other tasks. For example, users monitor, differentiate, extract, and
verify information (Ellis, 1989; 1993), select, explore, and formulate (Kuhlthau, 1991). Each of these
tasks might require a series of interconnected searches. For example, monitoring information might
require searches about the subject in various geospatial locations, analysis and interpretation of results.
These more complicated tasks indicate that interactions with KOS usually facilitate only a single aspect
of a bigger problem, which is sensemaking. Therefore, focusing on these tasks may be short-sighted (Qu
& Furnas, 2005). This dissertation is aimed at understanding sensemaking activities.
20
Stefik, Pirolli, & Card, 1993; O'Day & Jeffries, 1993). The purpose of sensemaking is to establish the
goals of the task and to discover a problem’s structure, “texture” (i.e., vocabulary, and available
documents), questions that should be asked, and how the answers are to be organized (Russel et al.,
1993). Sensemaking takes place when people face ill-defined situations, where their current knowledge
is insufficient (Dervin, 1992). Users’ conceptualizations of a problem and their search strategies
gradually evolve during sensemaking. While users make sense of information, they discover missing
pieces, changes in information, or something interesting which triggers revisions in strategies and
understanding of the problem.
Most of the time in sensemaking is consumed by extraction of information. According to
previous studies (Russell et al., 1993), extraction of information can be optimized by suitable
representations which answer task-specific questions, capture salient features of the data, and help users
discover the topic structure and texture. External representations can help users conceptualize a problem
at hand and form mental models. Qu & Furnas (2005) and O'Day & Jeffries (1993) suggest that external
representations can be derived from the information sources themselves. For example, documents
frequently have tables of content or structured abstracts that reveal their structure and content. Tables of
content and abstracts can be used as external representations.
Besides retrieving, sensemaking, and information extracting, map users also engage in visual
tasks. While retrieval and bibliographic tasks can be delegated to a computer, visual tasks are performed
by users. How well map-based visualizations support visual tasks depends not only on designer’s skills
to represent information, but also on an individual user’s cognition, his or her spatial and visual abilities,
and prior experience with interpreting map schemata. Visual tasks include scanning the visual scene,
detecting patterns, shapes, graphs, edges, discriminating labels, text, color, motion, properties of objects
21
grouping similar objects and regions, focusing on a spotlight, recognizing landmarks (MacEachren,
1995), relating distances and values, identifying clusters (Koua, 2005), reading and comparing values
(Edsall, 2001).
Although some of the visual tasks appear to be similar to interactions with KOS (such as
identifying and locating), they are not the same. In visual tasks, identifying is associated with the
perception of properties of objects encoded on graphical representations. In the context of cartography
and geovisualization, identifying is related to properties of geospatial locations. Identifying in the sense
of KOS interactions is associated with documents. Another distinction is that unlike relationships
between documents that have to be specified explicitly in metadata records, relationships that become
noticeable during visual tasks are not necessarily hard-coded relationships (i.e., such relationships are
not explicitly specified in metadata, rather they emerge from documents or their properties when
document representations are placed next to each other on a map or some other graphical
representation). This distinction suggests that visual tasks may help users reveal many more
relationships among documents than it is possible to discover with the tasks specified in bibliographic
objectives.
This accumulated evidence about ontological properties in KOS, representations, interactions,
sensemaking, and visual tasks suggests that it is time to re-conceptualize the existing map-based
visualizations of document collections that are still limited to searching and browsing. Such a
re-conceptualization should take full advantage of representations and interactions and should connect
22
2.1 References
Ahonen-Rainio, P., & Kraak, M.-J. (2005). Deciding on fitness for use: evaluating the utility of sample maps as an element of geospatial metadata. Cartography and geographic information science, 32 (2), 101.
Allen, B. (1996). Information tasks: Toward a user-centered approach to information systems. . San Diego, CA: Academic Press.
Ancona, D., Freeston, M., Smith, T., & Fabricant, S. (2002). Visual explorations for the Alexandria Digital Earh Prototype. In K. Börner, & C. Chen (Eds.), Visual interfaces for digital libraries (pp. 199-213). Berlin: Springer-Verlag.
Astle, D. E., Scerif, G., Kuo, B.-C., & Nobre, A. C. (2009). Spatial selection of features within perceived and remembered objects. Frontiers in Human Neuroscience, 3, 1-9.
Bausch, P., & Bumgardner, J. (2006). Make a Flickr-Style Tag Cloud. In Flickr Hacks. O'Reilly Press. Buchel, O., & Hill, L. (2009). Treatment of georeferencing in knowledge organization systems.
Pioneering North American Contributions to Knowledge Organization. Syracuse, NY.
Buckland, M. (1991). Information and information systems. New York, NY: Greenwood Publishing Group, Inc.
Buckland, M., & Lancaster, L. (2004, May). Combining Place, Time, and Topic: The Electronic Cultural Atlas Initiative. D-Lib Magazine .
Chernoff, H. (1973). The use of faces to represent points in k-dimensional space graphically. Journal of the American Statistical Association, 68, 361-368.
Dervin, B. (1992). From the Mind’s Eye of the User: the Sense-Making Qualitative-Quantitative Methodology. In J. Glazier, & R. Powell (Eds.), Qualitative Research in Information Management (pp. 61-84).
Desimone, R., & Duncan, J. (1995). Neural mechanisms of selective visual attention. Annual Review Neuroscience (18), 193-222.
Edsall, R. M. (2001). Interacting with space and time: desigining dynamic geovisualization environments. Thesis, The Pennsylvania State University, College of Earth and Mineral Sciences. Ellis, D. (1989). A behavioural approach to information retreival design . Journal of documentation, 45
23
Ellis, D., Cox, D., & Hall, K. (1993). A comparison of the information seeking patterns of researchers in the physical and social sciences. Journal of Documentation, 49 (4), 356-369.
Fabrikant, S. I., & Buttenfield, B. P. (1997). Envisioning User Access to a Large Data Archive.
Proceedings, GIS/LIS '97, (pp. 686-692). Cincinnati, OH.
Fast, K., & Sedig, K. (2005). The INVENT framework: Examining the role of information visualization in the reconceptualization of digital libraries. Journal of Digital Information (JoDI), 6 (3).
Fayyad, U., Grinstein, G., & Wierse, A. (1996). Information visualization in data mining and knowledge discovery. Academic Press.
Freire, N., Borbinha, J., Calado, P., & Martins, B. (2011). A Metadata Geoparsing System for Place Name Recognition and Resolution in Metadata Records. JCDL 2011. Ottawa, Canada.
Furnas, G. (1986). Generalized Fisheye Views. Human Factors in Computing Systems CHI ‘86 Conference Proceedings, (pp. 16-23).
Gruber, T. R. (1993). A translation approach to portable ontology specifications. Knowledge Acquisition, 5 (2), 199-220.
Guo, D., M. Gahegan, M., MacEachren, A., & Zhou, B. (2005). Multivariate Analysis and
Geovisualization with an Integrated Geographic Knowledge Discovery Approach. Cartography and Geographic Information Science, 32 (2), 113-132.
Hill, L. (2006). Georeferencing : The Geographic Associations of Information. Cambridge, MA: MIT Press.
Hill, L. L., Buchel, O., Janee, G., & Zeng, M. L. (2002). Integration of Knowledge Organization Systems into Digital Library Architectures: Position Paper. Thirteenth ASIS&T SIG/CR Workshop on "Reconceptutalizing Classi. Philadelphia, PA.
Jacob, E. (2003, April/May). Ontologies and the Semantic Web. Bulletin of the American Society for Information Science and Technology, 29 (4).
Jones, M. (2007, July/August). Google's geospatial organizing principle. Visualization Viewpoints , 8-13.
Keim, D. A., North, S., Panse, C., & Schneidewind, J. (2003). Visualizing geographic information: VisualPoints vs CartoDraw. Information visualization, 2 (2), 58-67.
Kohonen, T. (1995). Self-organizing maps. Berlin; Heidelberg; New-York: Springer Verlag.
24
Kuhlthau, C. (1991). Inside the search process. Information seeking from the user's perspective. Journal of the American Society of Information Science, 42 (5), 361-171.
Lamping, J., Rao, R., & Pirolli, P. (1995). A Focus+Context Technique Based on Hyperbolic Geometry for Visualizing Large Hierarchies. In I. Katz, R. Mack, L. Marks, M. Rosson, & J. Nielsen (Ed.),
Proceedings of the ACM SIGCHI Conference on Human Factors in Computing Systems (pp. 401-408).
Denver: ACM.
Larson, R. R. (1996). Geographic Information Retrieval and Spatial Browsing. In L. C. Smith, & M. Gluck (Eds.), Geographic Information systems and Libraries: Patrons, Maps, and Spatial Information
(pp. 81-123). Urbana-Champaign: Graduate School of Library and Information Science, University of Illinois at Urbana-Champaign.
Le Grand, B., & Soto, M. (2002). Visualisation of the Semantic Web: Topic Maps Visualisation. IEEE IV 2002. London.
Luck, S. J., & Hillyard, S. A. (1994). Spatial Filtering During Visual Search: Evidence From Human Electrophysiology. Journal of Experimental Psychology, 20 (5), 1000-1014.
Lueschow, A., Miller, E., & Desimone, R. (1994). Inferior temporal mechanisms for invariant object recognition. Cerebral Cortex, 5, 523-531.
Moen, W., & Miksa, S. (2007). Informing the Future of MARC: An Empirical Approach. Retrieved October 10, 2007, from MARC Content Designation Utilization: Inquiry and Analysis:
http://www.mcdu.unt.edu/wp-content/ALA2007ProgramHandout22June2007.pdf.
Moran, J., & Desimone, R. (1985). Selective attention gates visual processing in the extrastriate cortex.
Science, 229 (4715), 782-784.
Mozer, M. (1991). The Perception of Multiple Objects. Cambridge, MA: MIT Press.
Nogueras-Iso, J., Zarazaga-Soria, F., & Muro-Medrano, P. (2005). Geographic information metadata for spatial data infrastructures: resources, interoperability and information retrieval. New York, NY: Springer Verlag.
O'Day, V., & Jeffries, R. (1993). Orienteering in an information landscape: how information seekers get from here to there. ProcEEDINGS of the INTERCHI '93. Amsterdam, Netherlands: IOS Press.
Panel on Distributed Geolibraries, National Research Council. (1999). Distributed Geolibraries: Spatial Information Resources, Summary of a Workshop (0). National Academies Press.
25
Russel, D., Stefik, M., Pirolli, P., & Card, S. (1993). The cost structure of sensemaking. Proceedings of
ACM Conference on Human Factors in Computing Systems, (pp. 269-276).
Sedig, K. (2009). Interactive mathematical visualizations: Frameworks, tools, and studies. In E. Zudilova-Seinstra, & e. al. (Eds.), Trends in Interactive Visualisation: A State-of-the-Art Survey (pp. 112-132). Springer.
Sedig, K., & Liang, H.-N. (2006). Interactivity of visual mathematical representations: Factors affecting learning and cognitive processes. Journal of Interactive Learning Research, 17 (2), 179-212.
Sedig, K., & Sumner, M. (2006). Characterizing interaction with visual mathematical representations.
International Journal of Computers for Mathematical Learning, 11 (1), 1-55.
Sedig, K., Rowhani, S., & Liang, H. (2005). Designing interfaces that support formation of cognitive maps of transitional processes: an empirical study. Interacting with Computers: The Interdisciplinary Journal of Human-Computer Interaction, 17 (4), 419-452.
Shneiderman, B. (1992). Tree visualization with tree-maps: 2-d space-filling approach. ACM Transactions on Graphics, 11 (1), 92-99.
Spence, R. (2007). Information visualization: design for interaction. (2 nd. ed.). Essex, England: Pearson Education Limited.
Svenonius, E. (2000). The intellectual foundation of information organization. Cambridge, Mass.: MIT Press.
Thorpe, S., Fize, D., & Marlot, C. (1996). Speed of processing in the human visual system. Nature, 381, 520-522.
Tsouvaras, V. (2008). D4.2-Report on the translation of EUscreen metadata on a semantic web language. EUScreen.
Tufte, E. (1990). Envisioning information. Cheshire, CT: Graphics Press.
Tufte, E. (2001). The Visual Display of Quantitative Information (2nd ed.). Cheshire, Connecticut: Graphics Press.
Ullman, S. (2000). High-level Vision: Object Recognition and Visual Cognition. MIT Press. Van Essen, D. C., & Deyoe, E. A. (1995). Concurrent Processing in the Primate Visual cortex. In Gazzaniga (Ed.), Cognitive Neuroscience (pp. 383—400). Cambridge, MA: MIT Press.