Prediction by Nonlinear
Programming of Relative Chemical
Composition of Dietary Botanical
Components1
GEORGE M. VAN DYNE2v3
Radiation Ecology Section, Health Physics Division, Oak Ridge National Laboratory,
Oak Ridge, Tennessee.
Highlight
Nonlinear programming and matrix methods of analysis were used to predict relative chemical composition, energy values, and cellulose digestion coefficients for dietary botan- ical components. These methods provided data that would be difficult or impossible to obtain by direct experimental techniques. Estimates of chemical composition are pre- sented for plant groups, plant parts, and individual species in the diets of cattle and sheep grazing together in early, middle, and late summer on annual range. These results illustrate the usefulness of, and the need for, training more resource scientists in systems analysis and computer tech- niques for biological problems.
To make more intensive use of range ecosystems in the future, resource managers will need more detailed information on food-chain relationships between domestic or wild consumers and the plants they consume. The resource manager may want to know not only the plants that are being selected from the many available on the range, but also which plant parts are being consumed. Further- more, he will want to know the chemical composi- tion, energy values, and digestibility of these plants and plant parts.
Objectives
I will show by example in this paper how recently developed, nonstatistical mathematical techniques can be used to develop new nutritional information about range plants from analyses of results of pre- viously published experiments.
The purpose of this paper is to introduce, dem- onstrate, test, and use nonlinear programming tech- niques to predict relative chemical composition and energy values of plants or plant parts in dietary samples obtained from cattle and sheep.
Field and laboratory techniques for collecting, processing, and analyzing samples a re described in
l Research sp onsored by the Atomic Energy Commission under contract with Union Carbide Corporation. Paper presented at the 20th annual meeting, American Society of Range Management, Seattle, Wash. February 13-17, 1967. 2 Present address: Departments of Fishery and Wildlife
Biology and Range Science, College of Forestry and Natural Resources, Colorado State University, Fort Collins. 3 H. F. Heady, D. N. Hyder, and M. J. Morris are thanked
for their constructive criticism of the manuscript.
the papers cited. Only brief descriptions are given here. No attempt will be made to review the mathe- matical technique or other range nutrition studies.
Procedures
Dietary samples can be obtained from freely grazing herbi- vores by using the esophageal fistual technique (Van Dyne and Tore& 1964). Botanical composition can be determined by microscopic methods (Harker et al. 1964; Heady and Van Dyne, 1965), and chemical constituents, gross energy, and microdigestion can be determined by conventional tech- niques (Van Dyne and Heady, 1965b; Van Dyne and Weir, 1964 and 1966). Forage samples obtained from an esopha- geal fistula generally are too extensively masticated, how- ever, to permit economical manual separation of plant species or parts for chemical analyses and digestibility determinations.
Early analytical studies utilized correlation coefficients to illustrate interrelationships between and within dietary chemical and botanical components (Van Dyne, 1963; Van Dyne and Heady, 1965c). However, correlations, whether simple or partial, show only general relationships. They are not useful for predicting chemical composition of individual plants and plant parts in the diets. Nonlinear programming, an operations research technique, was used in exploratory computer studies to predict relative chemical composition of individual plant species or parts, but only one chemical constituent was considered at a time (Van Dyne, 1965a).
Field and Laboratory Technique.-Field studies were con- ducted in northern California in three periods, early July (I), August (II), and September (III) 1961, on a range described by Van Dyne and Heady (1965a). The fistulated animals were five Hereford steers and seven crossbred weth- ers raised on foothill ranges and accustomed to the pasture prior to sampling. Salt, but no supplementary feed, was provided during the summer. Details of handling the ani- mals on the range have been reported (Van Dyne and Heady, 1965a and b). Typically, the animals were corralled at daybreak to remove the esophageal fistula plugs and attach forage collection bags. After a 0.5- to 2.0-hour grazing period, they were recorralled, the sample bags were removed, and the fistula plugs were replaced. The animals grazed the remainder of the day, and sampling was repeated in the evening. The animals were allowed to graze at night.
The esophageal fistulated animals were used for sampling morning and evening for five consecutive days in each sam- pling period. Due to inadequate sample volume or due to contamination by rumen ingesta, only 309 samples were used in chemical or botanical analyses. The 260 samples analyzed for both chemical and botanical constituents provided the results reported herein; individual data are available (Van Dyne, 1965c).
Half of each sample was frozen for botanical analysis. Later samples were thawed, placed in cheesecloth, washed to remove saliva, partially dried, and spread on sampling trays. Botanical analyses involved passing these trays under an 1%power binocular microscope with a crosshair as illustrated by Harker et al. (1964). The species and plant part were recorded for 200 hits on each sample, and the data were converted to point percentages. Except for plant parts, botanical composition data were converted to weight per- centages. Conversion required simple linear regression equa- tions constrained through the origin to predict percent
38 VAN
weight from percent points (Heady and Van Dyne, 1965). Coefficients of determination for these equations generally were greater than 90%. The regression coefficients for im- portant species or plant groups varied from 0.1 to 3.0.
The other half of each sample was dried, ground, and used for duplicate chemical and gross energy determinations (Van Dyne and Heady, 1965b). Six composite period x class of stock samples were used in microdigestion studies (Van Dyne and Weir, 1964 and 1966).
Mathematical Analyses.-Let the following defi- nitions apply:
C = (cik) = the percent concentration of the k’th chemical in the i’th mixed forage sample.
W = (wii) =
the proportion by weight of the i’th sample that is contributed by the j’th plant.P = (&J =
the predicted percent concentration of the k’th chemical in the j’th plant. Then the chemical composition of the plant can be shown asHere m is the number of botanical or plant groups. The predicted percent composition of the k’th chemical in the j’th plant may be determined by use of nonlinear programming to minimize the following function
Q=i +ir: Wij PjS (2)
i=l k=l j=l
I”,
where n is the number of samples and t is the num- ber of chemical constituents. The solution matrix, I?, has the constraints fiirc >, 0 for all i and k, and k$lfijn = 100 for all i.
Energy values were predicted independent of chemical composition using the method of equation (Z), but in which k was 1. The only constraint for predicted energy values was that they must be greater than zero.
Chemical constituents may be determined one at a time as reported earlier in exploratory computer studies (Van Dyne, 1965a), but simultaneous solu- tion for all chemical constituents includes more information about the sample in determining the solution matrix. Some possible errors and the effects of different sources of variation on results were reported in the paper cited. Synthetic data were generated in that study and were used to test the sensitivity and precision of the method. The computational algorithm used in the analyses was reported by Fiacco and McCormick (1964).
It should be emphasized that the mathematical techniques employed herein are nonstatistical in nature. Thus, no measures of variation are avail- able for estimates of chemical composition as deter-
DYNE
mined by nonlinear programming. Similarly, the matrix methods described in the following section are nonstatistical in nature.
Predicting Digestion Coefficients.--If one as- sumes there are no associative effects of one dietary component upon another, nonlinear programming techniques may be used to estimate digestion coeffi- cients for individual plant components. Let S = (sik) = the percent digestibility of the k’th chemical constituent in the i’th mixed forage sample as deter- mined by microdigestion techniques.
D =
(djk) = the predicted digestion coefficient for the k’th chemical constituent in the j’th plant component such thatSik = 2 Wij $jk $jk s (3)
j=l
Wij and ijjk are defined above. The problem now is to minimize the new function
Q” = s i [ !& - $ Wij $jk aj,] 2 9 (4
i=l k=l j=l
subject to 0 < d jk < 100 for all i and k. In applica- tion, the Fiji are first determined by eq. (2) then used in eq. (4).
This procedure requires a relatively large num- ber of microdigestion estimates. Microdigestion data were available for only six period x class of stock dietary samples, so matrix methods of pre- dicting digestion coefficients are used herein uti- lizing cellulose and dry matter microdigestion data reported by Van Dyne and Weir (1964 and 1966). Let aij be the relative amount of cellulose in the i’th sample due to the j’th plant component ob- tained by
A=Wej
(5)
for i = 1, 2, . . .6 period x class of stock diet samples and J’ = 1, 2, . . .6 plant components.
W
is defined above and fij here is the predicted cellulose con- centration in the j’th plant component as deter- mined by the method of equation (2). Let bi be the cellulose microdigestion of the i’th period x class of stock diet sample. Now we will use matrix methods to predict iii, the cellulose digestion co- efficient for the j’th plant component so thatAkT=B.
(6)
This is accomplished if
A-l exists, then
r;rT = A-1 B .r
- --
-_-_-
--- ----
NONLINEAR PROGRAMMING PREDICTIONS 39 Checks on Validity of Results.-Samples wereclipped from the range and analyzed to validate estimates of chemical composition of individual plants or plant parts (Van Dyne 1965b). Further- more, the validity of predicted chemical composi- tion for individual plants or plant parts can be tested analytically by subdividing the data into different groups and comparing predictions for a given species made in each case. Variation due to the following factors is tested herein: (a) com- parison of results for given plants when results were predicted from Z-, 5-, or 1 O-species samples, (b) comparison of estimating chemical composition for one nutrient at a time vs. all nutrients simulta- neously, and (c) comparison of predictions made for a given species based on all samples vs. estimates based only on samples containing that species.
protein, 1% for ether extract, 3% for lignin, 67, for cellulose, and 5% for other carbohydrates (Table 1). With some exceptions, discussed below, these analyses suggest that the number of botanical components utilized in the mathematical analysis has little influence on the estimates of chemical composition of important plants in the diet.
All the estimates of chemical composition for Bromus species, whether based on 2-, 5-, or lo- component analyses, were reasonable values (Table 1). This plant group was selected because it usually composed at least 30% of the weight of the diets, occurred in every dietary sample for both cattle and sheep, and had a relatively low variability among samples (Table 2). The results indicate that plant species can be utilized in such analyses if they are relatively important and consistent in percentage, and if they occur in all the dietary samples.
The results presented herein are most useful on a relative basis because one must judge subjectively the validity of a given estimate. Therefore, chemi- cal composition data are reported only to the nearest percent, and gross energy is reported to the nearest 0.1 kcal/g, both on an organic matter basis to minimize differential influences of salivary contamination.
Results
Comparisons of Analytical Methods
2-, 5-, and IO-Component Influences.--In the 2- species case for equation (2), the weight data were (i) the particular species, and (ii) the sum of other species in the sample. In the 5-species case, the individual plants or groups analyzed were (i) Bromus species, (ii) forbs, (iii) shrubs, (iv) other grasses, and (v) plants unidentifiable to genera. In the lo-species case, the samples were (i) Aria caryophyllea, (ii) Arena barbata, (iii) Bromus species, (iv) Gastridium ventricosum, (v) other grasses, (vi) Erodium botrys, (vii) Trifolium spe- cies, (viii) other forbs, (ix) shrubs, and (x) plants unidentifiable to genera. The same samples and the same chemical analyses were used in each case, but the botanical components were segregated as above. Results are reported here for the com- ponents included in all analyses-Bromus, shrubs, and unidentifiable plants. The results of the non- linear programming analyses for each chemical constituent were subjected to analyses of variance in which number of components, class of stock, and period of grazing were considered fixed effects, and their interactions were evaluated. The three- way interaction was used as the error term.
Generally, the differences in estimates of relative chemical composition for 2-, 5-, and lo-species mixtures were small and not significant (P < 0.05). For example, for Bromus species the maximum ranges in estimates due to number of species in the analyses for six data groups were 3y0 for crude
Chemical composition percentages for shrubs were predicted quite well for most 2-, 5-, and lo- component analyses (Table 1). There was a high degree of between-period variation in predicted chemical composition of shrubs. Probably, the species of shrubs (or plant parts) which were grazed varied widely between periods. An unexplainable exception occurred for samples collected from sheep in period I, especially for the 2-component analysis. Shrubs constituted 4 to 12% of the cattle and sheep diets during the summer. However, the relative variability was much greater than for Bromus, and shrubs were found in only 60 to 95% of the diets (Table 2). For shrubs, the estimates of chemical composition appear valid in about 93% of the cases. Estimates for lignin in sheep diets in period I appear low.
Plants unidentifiable to genera were as impor- tant in the diets as shrubs, but they were much more consistent, being found in all dietary samples. Generally they showed less than half the sample- to-sample variability that shrubs showed (Table 2). In all but one instance the estimates of chemical composition for plants unidentifiable to genera appear reasonable (Table 1) when compared to data for individual plants or plant parts (Van Dyne, 1965b).
These results suggest that in order to obtain valid results with this analytical method it is im- portant that a plant occur in most of the diets; i.e., that there are few 0% values in the matrix
W.
These results agree in general with those of earlier analytical studies in which small mean values for botanical components tended to give poor estimates of chemical composition (Van Dyne, 1965a).40 VAN DYNE
Table 1. Estimates of percent chemical composition of Brornus spp. (B), shrubs (S), and plants unidentifiable to genera (U) grazed by cattle and sheep as determined by analyses of 2, 5-, and lo-component cases.
Crude Ether Other
Data Number of protein extract Lignin Cellulose carbohydrates
group components B s u B S U B S U B S U B S U
Cattle I 2 12 12 9 2 2 3 15 16 17 39 39 41 33 31 30
5 13 10 11 2 2 2 17 15 20 38 40 39 31 33 27
10 13 9 10 2 2 2 18 13 19 39 35 38 28 39 32
Cattle II 2 3 8 14 1 2 <1 8 18 17 50 36 52 39 36 17
5 1 8 19 2 2 <1 10 17 29 45 36 38 42 37 14 10 2 8 20 2 2 <1 10 17 30 44 36 38 42 37 12
Cattle III 2 1 20 10 1 2 1 8 33 18 51 11 41 40 34 31
5 1 15 7 1 2 1 8 28 16 47 14 39 43 41 36
10 1 13 6 1 1 <1 8 30 16 47 16 38 44 39 40 Sheep I 2 12<1 6 3<1 7 12 <l 30 30 54 39 44 47 21 5 13 14 <l 2<1 7 9 7 31 29 48 42 48 32 21 10 10 11 3 2<1 6 12 5 32 31 52 36 46 32 23
Sheep II 2 5 10 6 1 3 1 11 22 14 40 35 42 43 30 37
5 4 11 3 1 2 1 12 22 14 39 36 39 44 28 43
10 6 13 2 2 2 1 12 21 13 35 32 38 45 32 45
Sheep III 2 2 14 7 1 2 1 12 26 13 45 14 46 39 45 33
5 1 18 7 1 2 1 13 24 16 46 11 39 38 45 36
10 1 16 6 1 2 2 12 23 19 41 11 43 43 47 30
multaneously with the constraint that the sum of analysis. Thus, some of the species occurred in as the estimated chemical percentages must total few as 75% of the samples.
100% (equation 2). A lo-component group was In plotted results of these analyses, if the points utilized to test differences in composition estimates fell on the 45” line, then both techniques of due to separate vs. simultaneous minimization. The analysis gave identical estimates of composition. individual botanical components did not have to Points falling below the 45” line indicate estimates be present for the sample to be included in this were higher for simultaneous minimization, and
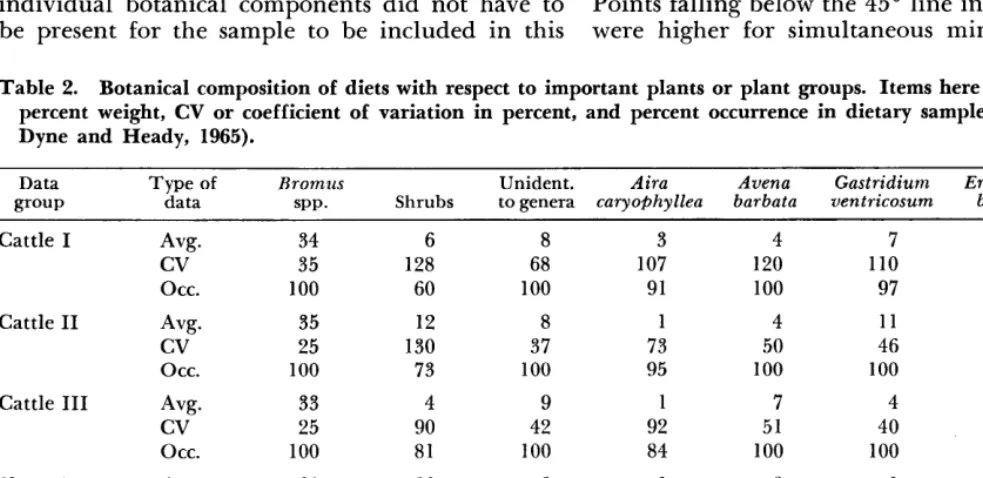
Table 2. Botanical composition of diets with respect to important plants or plant groups. Items here are Avg. or mean percent weight, CV or coefficient of variation in percent, and percent occurrence in dietary samples (data from Van Dyne and Heady, 1965).
Data Type of Bromus Unident. Aira Avena Gastridium Erodium Trifolium
grow data SPP. Shrubs to genera caryophyllea barbata ven tricosum botrys SPP.
Cattle I Avg. 34 6 8 3 4 7 2 5
cv 35 128 68 107 120 110 136 64
occ. 100 60 100 91 100 97 51 100
Cattle II Avg. 35 12 8 1 4 11 3 6
cv 25 130 37 73 50 46 102 44
occ. 100 73 100 95 100 100 83 100
Cattle III Avg. 33 4 9 1 7 4 12 9
cv 25 90 42 92 51 40 67 35
occ. 100 81 100 84 100 100 100 100
Sheep I Avg. 30 10 8 1 3 1 2 5
cv 54 83 56 114 90 75 125 65
occ. 100 95 100 74 95 94 61 97
Sheep II Avg. 37 6 10 2 3 5 3 7
cv 29 112 39 82 101 90 118 63
occ. 100 73 100 93 95 93 71 95
Sheep III Avg. 35 6 10 1 2 10 7 7
cv 22 111 47 69 62 48 66 52
NONLINEAR PROGRAMMING PREDICTIONS 41
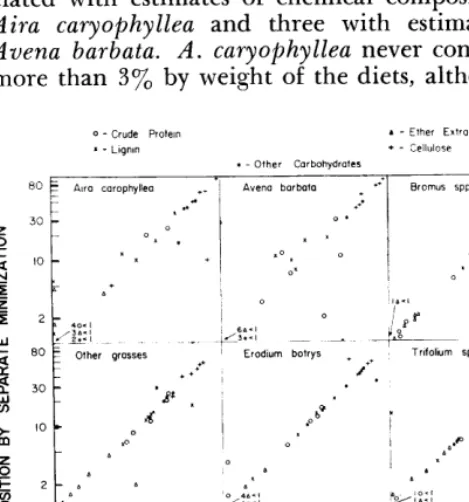
points above the 45” line indicate the estimates were higher for separate minimization (Fig. 1).
Estimates by separate vs. simultaneous minimi- zation differed most for species with low mean per- cent botanical composition, high variability, and low percentage occurrence in diets. Separate mini- mization produced erroneous results for some spe- cies because estimates of chemical composition for individual constituents did not total near 100%. In instances where the data on botanical composi- tion were sufficient for analysis and where composi- tion estimates totaled near loo%, simultaneous and independent minimization produced similar re- sults. However, if estimate totals did not approach lOO%, results differed by the two methods of analy- ses, and both gave invalid data. The restrictions imposed in simultaneous minimization generally forced estimates of chemical composition closer to reality, as based on approximate values for clipped samples (Van Dyne, 1965b). Still, invalid results may be masked by the fact that figures obtained by separate minimization sum to 100% for a given plant.
For separate minimization the sum of estimated chemical constituents varied from 100% by 24% in
10 out of 60 cases. Four of these variants were asso- ciated with estimates of chemical composition of Aira caryophyllea and three with estimates for Arena barbata. A. caryophyllea never constituted more than 3y0 by weight of the diets, although in
0 - Crude Prokw 1 - Llgnln
. - Other Carbohydrates
. - Ether Extract
l - Cellulose
PERCENT COMPOSITION BY SIMULTANEOUS MINIMIZATION
FIG. 1. Relationships of estimates of chemical concentrations in dietary botanical components determined by nonlinear pro- gramming, estimating constituents either independently or simultaneously. Values of concentrations along a 45-degree line show both techniques give the same estimates.
the six period x class of stock samples it occurred in 74 to 98% of the time. Avena barbata composed from 2 to
7yo of the weight and occurred in 95% or
more of the dietary samples (Table 2).In almost every instance where there were differ- ences of more than ‘4% from totals of loo%, simultaneous minimization gave more reasonable answers than separate minimization (Fig. 1). For example, chemical composition of Gastridium ven- tricosum grazed by sheep in Period I estimated by simultaneous minimization appears more reason- able than the estimates given by separate minimi- zation. Similarly, for the “other grasses” category for sheep in Period III, estimates by simultaneous minimization appear valid. In this period sheep primarily grazed basal green leaves of the few perennial plants in the pasture, thus accounting for the relatively high estimate for crude protein. In these two cases estimates of crude protein con- centration by simultaneous minimization, 13% and 24% appear somewhat high but closer to clipped- plant values than the estimates obtained by sepa- rate minimization.
Invalid estimates by separate minimization for Aira caryophyllea and Avena barbata were not greatly improved by simultaneous minimization
(Fig. 1). These results occurred when the mean chemical composition percentage was low and rela- tive variability was high. Also, in six of the seven anomalous cases, less than 100% of the samples con- tained the species (Table 2). The anomalous results by separate minimization for Gastridium uentricosum for sheep in Period I also are based on an average botanical composition of only l%, a coefficient of variation of 75%, and an occurrence in the diets 94% of the time (Table 2).
Further study is needed to explore the response surface being investigated, i.e., that formed in mini- mizing a sum of squares subject to several con- straints. In this case, the surface is in a IO-dimen- sional hyperspace, and it is difficult to visualize the cause of anomalous results. Perhaps further com- puter experimentation would be useful wherein samples of known but complex composition could be used to test this analytical method.
Predicted Dietary Characteristics
Composition of Major Plant Groups.-Estimates of chemical composition of grasses, forbs, shrubs, and plants unidentifiable to genera are based on percent composition and upon samples containing all four of these categories (Table 3). Unfortu- nately, few published data are available for plant parts actually grazed for objectively evaluating the validity of these estimates.
VAN DYNE
was a decrease from early to mid-summer, then an increase in late summer. A divergent pattern was found for shrubs and plants unidentifiable to genera. In early and mid-summer sheep selected shrubs higher in estimated crude protein than shrubs grazed by cattle, but in late summer cattle grazed shrubs higher in estimated crude protein than did sheep. Plants unidentifiable to genera grazed by sheep generally decreased in estimated crude protein content during the summer; whereas, the same plant category grazed by cattle increased from early to late summer in estimated crude pro- tein content. Further study is needed to determine if these trends in dietary chemical composition are real, are due to sampling variability, or are due to the method of calculation.
For both cattle and sheep, plants unidentifiable to genera usually had higher estimated lignin con- centrations than did the major categories-grasses, forbs, or shrubs (Table 3). An unusually low esti- mate of other carbohydrates was found for the plants unidentifiable to genera grazed by sheep in early summer. Estimated energy values ranged from 4.2 to 6.5 kcal/g. Highest estimates of energy content were for shrubs grazed by cattle in middle and late summer.
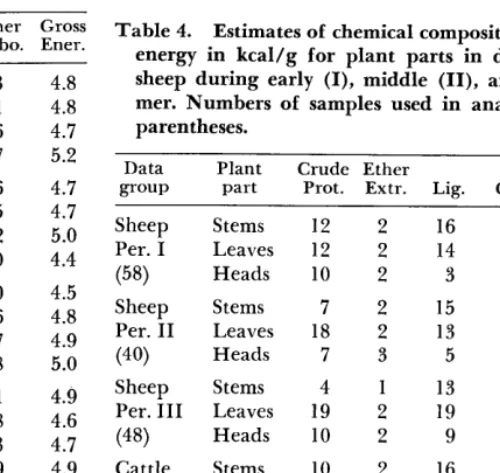
Table 3. Estimates of chemical composition in percent and energy in kcal/g for plant groups in diets of cattle and sheep in early (I), middle (II), and late summer (III). Numbers of samples used in analyses are given in paren- theses.
Composition of Stems, Leaves, and Heads.--Si- multaneous minimization was utilized here, and furthermore, only samples having values of > 0% for each component were included in the analysis. Therefore, a variable number of samples were uti- lized in these analyses. Data for plant parts are based on a W matrix in which the elements are percentages for point composition rather than for weight composition, in contrast to results for indi- vidual species or plant groups. This introduces an unknown amount of error in the results. “Head” refers to the entire inflorescence.
Leaves generally contained more estimated crude protein than stem or heads, but the variations depended upon the class of stock and season of grazing (Table 4). Many of the leaves grazed in late summer were those from perennial plants which were still green and which were sought out by the animals. Estimated crude protein content of leaves in late summer was 4 to 5 times as great as in stems for diets grazed by cattle and sheep (Table 4).
Ether extract was relatively uniform at 1 to 3y0 for all plant parts, for both cattle and sheep during all the summer. Although the estimated concentra- tion of lignin was similar in stems of plants grazed by cattle and sheep, the heads sought out by sheep contained considerably less lignin than those grazed by cattle. Sheep sought stems which contained much more cellulose than found in heads during the summer, but the difference in estimated cellu-
Data group
Plant Crude Ether Other Gross
group Prot. Extr. Lig. Cell. Carbo. Ener.
Sheep Per. I (55)
Sheep Per. II (30)
Sheep Per. III (34) Cattle Per. I (21)
Cattle Per. II (27)
Cattle Per. III (33) Grass Forbs Shrubs Unk. Grass Forbs Shrubs Unk. Grass Forbs Shrubs Unk. Grass Forbs Shrubs Unk. Grass Forbs Shrubs Unk. Grass Forbs Shrubs Unk.
11 2 11 3 10 2 19 1
8 <1 8 4 13 2 8 2 5 1 12 2 14 2 10 1
10 2 9 2 8 2 11 2 6 1 7 2 7 2 14 2 4 1 8 1 19 2 17 3
12 14 17 25 13 13 20 11 10 15 22 22 16 11 11 18 12 13 16 27 11 15 29 23 32 41 44 48 43 39 31 50 44 36 14 49 41 40 37 40 46 44 36 27 47 39 18 35 43 31 26 7 36 35 32 30 40 36 47 18 31 38 43 29 34 34 38 30 37 36 33 22 4.8 4.8 4.7 5.2 4.7 4.7 5.0 4.4 4.5 4.8 4.9 5.0 4.9 4.6 4.7 4.9 4.7 4.7 4.8 5.1 4.7 4.2 6.5 5.9
Table 4. Estimates of chemical composition in percent and energy in kcal/g for plant parts in diets of cattle and sheep during early (I), middle (II), and late (III) sum- mer. Numbers of samples used in analyses are given in parentheses.
Data group
Plant
part Crude Ether Prot. Extr. Lig. Cell. Carbo. Ener. Other Gross
Sheep Per. I (58) Sheep Per. II (40) Sheep Per. III (48) Cattle Per. I (34) Cattle Per. II (38) Cattle Per. III (41) Stems Leaves Heads Stems Leaves Heads Stems Leaves Heads Stems Leaves Heads Stems Leaves Heads Stems Leaves Heads
12 2 16 43 27 4.8 12 2 14 35 37 4.8 10 2 3 19 65 4.6 7 2 15 46 31 4.7 18 2 13 36 31 5.1
7 3 5 26 59 5.7
NONLINEAR PROGRAMMING PREDICTIONS 43
lose concentration in stems and heads was not as great for diets of cattle. Other carbohydrates, for both cattle and sheep diets, were always greater in heads than in stems and leaves, as would be expected.
Energy values did not vary greatly by plant parts. The highest estimated energy values were those in heads grazed by sheep in mid-summer, which would be expected due to the higher estimate of ether extract at that time. However, the lowest estimates of energy content of plant material were obtained also for heads, especially those grazed by cattle. This probably indicates a difference in plant species.
Composition of Important Plants.-Two-compo- nent, simultaneous minimization was used for all samples in which the particular plant in question
was > 0%. Analyses were run for 47 species or genera, but some of these plants were of limited importance in the diets, and results obtained for them were invalid. Estimates of relative chemical composition for several important species or groups are presented in Table 5 for diets grazed by cattle, sheep, or both during the entire summer. The species or groups not included in Table 5 occurred in an average of only 18 dietary samples from both cattle and sheep during the entire summer.
As compared to estimates of dietary chemical composition for sheep or cattle, estimates for both are not necessarily a simple average nor a weighted average. These estimates are obtained indepen- dently by using nonlinear programming to select values of chemical composition which minimize a sum of squares of deviations; see equation (2).
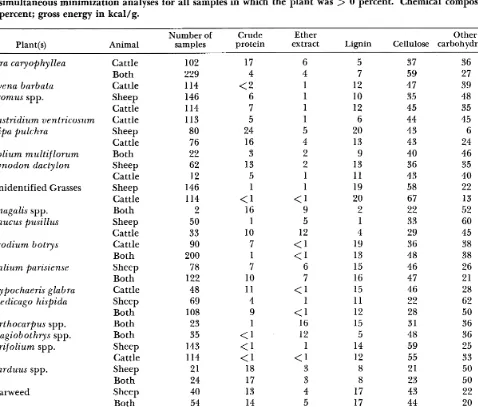
Table 5. Estimates of relative chemical composition of plants grazed by cattle and sheep as determined by Z-component, simultaneous minimization analyses for all samples in which the plant was > 0 percent. Chemical composition data in percent; gross energy in kcal/g.
Plant(s) Animal Number of
Crude Ether
samples protein extract Lignin Cellulose carbohydrates Other energy Gross Airu caryophyllea
Avena barbata Bromus spp.
Gastridium ventricosum Stipa pulchra
Lolium multiflorum Cynodon dactylon
Unidentified Grasses
Anagalis spp. Daucus pusillus
Erodium botrys
Galium parisiense
Hypochaeris glabra Medicago hispida
Orthocarpus spp. Plagiobothrys spp. Trifolium spp.
Carduus spp.
Tarweed
Unidentified forbs
Quercus spp.
Unidentified to group
Cattle 102 17 6 5 37 36
Both 229 4 4 7 59 27
Cattle 114 <2 1 12 47 39
Sheep 146 6 1 10 35 48
Cattle 114 7 1 12 45 35
Cattle 113 5 1 6 44 45
Sheep 80 24 5 20 43 6
Cattle 76 16 4 13 43 24
Both 22 3 2 9 40 46
Sheep 62 13 2 13 36 35
Cattle 12 5 1 11 43 40
Sheep 146 1 1 19 58 22
Cattle 114 <1 <1 20 67 13
Both 2 16 9 2 22 52
Sheep 50 1 5 1 33 60
Cattle 33 10 12 4 29 45
Cattle 90 7 <1 19 36 38
Both 200 1 <1 13 48 38
Sheep 78 7 6 15 46 26
Both 122 10 7 16 47 21
Cattle 48 11 <1 15 46 28
Sheep 69 4 1 11 22 62
Both 108 9 <1 12 28 50
Both 23 1 16 15 31 36
Both 35 <1 12 5 48 36
Sheep 143 <1 1 14 59 25
Cattle 114 <1 <I 12 55 33
Sheep 21 18 3 8 21 50
Both 24 17 3 8 23 50
Sheep 40 13 4 17 43 22
Both 54 14 5 17 44 20
Sheep 145 17 3 17 40 22
Cattle 114 10 2 15 41 31
Sheep 119 17 5 21 40 16
Cattle 81 8 2 16 37 37
Sheep 146 3 1 16 46 34
Cattle 113 12 2 29 39 25
44 VAN DYNE
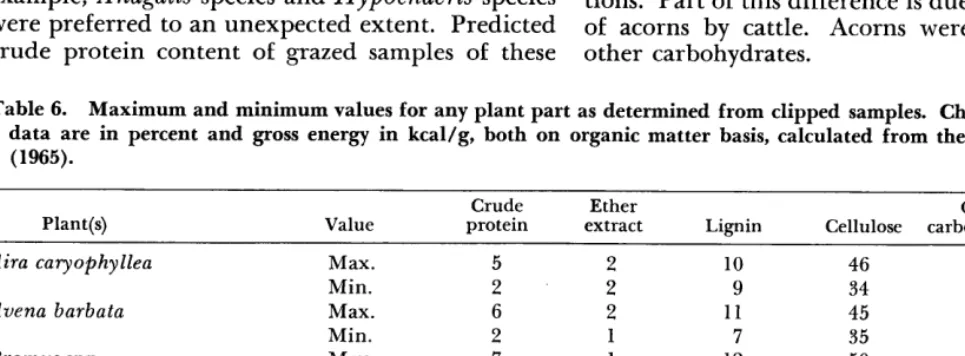
Evaluation of the validity of these results was aided by examining data on maximum and mini- mum values of chemical concentrations for various plant parts for annual grasses and forbs from this range (Table 6). Furthermore, when the predicted chemical composition values were invalid, there were gross abnormalities in relative percentages of various chemical constituents, especially in esti- mates of cellulose and other carbohydrates.
Predicted chemical composition of plants grazed was reasonably near the composition of the clipped plants where the comparison could be made (Ta- bles 5 and 6). If measured in terms of high crude protein content and low lignin contents, the plant parts actually selected by the grazing animals generally were of better nutritive value than the material as clipped from the range. A notable exception was for Trifolium spp., but the clipped Trifolium plants were grown in pure-stand plots and had not shattered like the material on the range (Van Dyne, 1965b).
The energy content of the plants grazed was equal to or higher than that of the clipped plants. Ether extract concentrations were similar, except for Daucus pusillus, where the grazed plants had 2 to 4 times the ether extract content found in the clipped samples. Clipped plants of this species had maximum values almost twice as high as those esti- mated for the grazed plants. Differences were not clear between cellulose and other carbohydrate concentrations of plants clipped from plots and the same species grazed from the range (Tables 5 and 6). These estimates of chemical composition explain in part some of the unexpected preference ratings reported by Van Dyne and Heady (1965a). For example, Anagalis species and Hypochaeris species were preferred to an unexpected extent. Predicted crude protein content of grazed samples of these
species was also high. Avena barbata had a consid- erably lower preference estimate than was expected from previous studies, but this species had a rela- tively low predicted protein content.
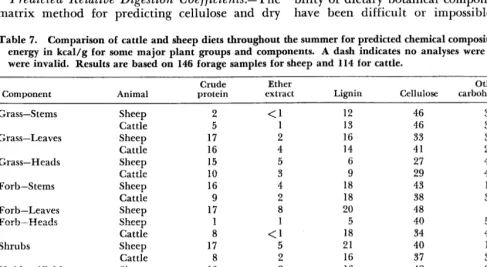
Cattle vs. Sheep Diets.-Considerable difference was reported in chemical composition and botani- cal composition for cattle and sheep diets (Van Dyne and Heady, 1965a and b). Analyses were made to predict relative chemical composition of plant parts or plant groups in dietary samples col- lected throughout the summer from cattle and sheep.
Major differences in chemical composition of cattle and sheep diets were not due to differences in chemical composition of plant-part groups (Table 7). For example, comparing averages over all plant groups, there was seldom more than 1 or 2% differ- ence between cattle and sheep diets in estimated composition for any chemical constituent in stems, leaves, and heads. Averaged over all plant groups, the largest difference in composition of plant parts was that sheep selected plants which had heads somewhat higher in crude protein and lower in lignin than heads selected by cattle.
When averaged over plant parts, there was rela- tively little difference in composition between grasses selected by sheep and cattle, but forbs selected by sheep were somewhat higher in crude protein than forbs selected by cattle (Table
7).
There was, however, a considerable difference in the composition of shrubs selected by sheep and by cattle. Sheep grazed shrubs which were about twice as high in crude protein and ether extract as those grazed by cattle, but shrubs grazed by sheep were about half as high in other carbohydrate concentra- tions. Part of this difference is due to consumption of acorns by cattle. Acorns were above 60% in other carbohydrates.Table 6. Maximum and minimum values for any plant part as determined from clipped samples. Chemical composition data are in percent and gross energy in kcal/g, both on organic matter basis, calculated from the data of Van Dyne (1965).
Plant(s) Value protein Crude extract Ether Lignin Cellulose carbohydrates Other Energy Gross Aira caryophyllea
Avena barbata
Bromus spp.
Gastridium ventricosum
Daucus pusillus
Hypochaeris glabra
Trifolium spp.
Max. Min. Max. Min. Max. Min. Max. Min. Max. Min. Max. Min. Max. Min.
8 2 6 2 3 2 12 9
2 2 2
10 46 51 4.6
9 34 41 4.6
11 45 52 4.7
7 35 39 4.6
12 50 63 4.6
5 26 36 4.4
11 46 48 4.7
9 34 39 4.6
19 57 47 5.6
9 36 21 4.7
13 49 35 4.5
8 37 35 4.5
10 46 40 4.7
NONLINEAR PROGRAMMING PREDICTIONS 45
Spanish moss occurred in only 40 samples grazed by both cattle and sheep. Predictions for this spe- cies indicated that almost all of the chemical com- position comprised other carbohydrates. Chemical analyses of Spanish moss showed that more than 80% of the composition was other carbohydrates, other constituents being relatively negligible. This agrees in general with results predicted by non- 1 inear programming.
Plants unidentifiable to genera grazed by sheep were about 50% higher in crude protein than those grazed by cattle (Table
7).
Legumes grazed by cat- tle had about 6y0 more cellulose than the legumes grazed by sheep. Nonlegumes grazed by sheep were slightly higher in crude protein and lower in cellu- lose than the same plants grazed by cattle. There were no major differences between chemical com- position of annual plants grazed by sheep and cat- tle. Perennial plants selected by sheep were about twice as high in crude protein and ether extract content as those grazed by cattle, but these plants were considerably lower in other carbohydrate composition.As expected, deviations were relatively small in predicted gross energy of cattle and sheep diets. The greatest differences overall were for forb stems, where sheep diets were 0.5 kcal/g higher than cattle diets.
Predicted Relative Digestion Coefficients.-The matrix method for predicting cellulose and dry
matter digestion coefficients does not provide for constraints upon the solution, so digestion coeffi- cients determined in this matter are only relative. Digestibility data for the total diets are for artifi- cial rumen studies in vitro and nylon bag studies in vivo. For the in vivo determinations, both cellu- lose and dry matter digestion data were available (Van Dyne and Weir, 1964 and 1966).
Relative cellulose digestion estimates were made for six important plant groups in the six period x class of stock diet samples. Average ranks for four estimates of cellulose digestion coefficients were: grass heads, 1; grass stems and forbs, both 2.5; plants unidentifiable to genera, 4.8; grass leaves, 5.0; and shrubs, 5.2 (1 represents the highest value). Grass heads had the highest relative digestion esti- mates both in vitro and in vivo, whether the ani- mals were grazing on the range or being fed alfalfa as a base diet.
Relative digestion estimates for dry matter were highly variable and have not been presented. They reflect the nearly singular nature of the W matrix used in this analysis.
Discussion and Conclusions
Use of nonlinear programming and matrix meth- ods of analysis has provided information about chemical composition, energy values, and digesti- bility of dietary botanical components that would have been difficult or impossible to obtain by
Table 7. Comparison of cattle and sheep diets throughout the summer for predicted chemical composition in percent and energy in kcal/g for some major plant groups and components. A dash indicates no analyses were made or estimates were invalid. Results are based on 146 forage samples for sheep and 114 for cattle.
Component Animal protein Crude extract Ether Lignin Cellulose carbohydrates Other
46 VAN
other means. Nonlinear programming estimates of chemical composition and energy values were most useful and valid when simultaneous minimization was undertaken rather than separate minimization. Results were not influenced much by data group- ing, i.e., whether Z-, 5-, or lo-botanical components were included in the analysis. However, it ap- peared important that only samples in which the particular botanical component in question was greater than 0% should be utilized for predictions by nonlinear programming. Independent analyses of such samples for important plant categories yielded similar estimates of chemical composition and energy values for numerous important species, plant groups, and plant parts. Dietary botanical components that occurred in only a few samples yielded invalid estimates of chemical composition and energy values.
Grass heads consistently had higher cellulose di- gestion estimates than other botanical categories. Shrubs often were lowest in estimated digestibil- ity. Similar estimated digestibility rankings were obtained for the various botanical components, whether the data were obtained when the host ani- mals were grazing range forage or when they were fed alfalfa hay.
Predicted chemical composition data for impor- tant plant categories are useful in explaining some previously unexpected preferences by cattle and sheep for certain plant components. Generally, when a plant had received an unexpectedly high preference rating this was associated with relatively high estimates of crude protein concentration.
These techniques of predicting chemical compo- sition and energy values, when used with chemical composition data for individual plants or plant parts, show how resource managers might extend and improve their knowledge about food-chain relationships for grazing herbivores. To do so,
however, requires more familiarity with techniques of computing and systems analysis than most re- source management or range research training now provides. These results, in addition to other recent applications of operations research and sys- tems analysis methods to environmental problems (e.g., Van Dyne, 1965a and 1966a and b), illustrate further the need for modifying the training of resource scientists.
In addition to problems of nonlinear pro- gramming and matrix analysis predictions utilized herein, knowledge of computers was essential in processing the large amount of data involved in this project. For example, microscopic point deter- minations were made on 300 fistula forage and 300 hand-clipped samples. Thus, 120,000 items of botanical composition data alone were required in these analyses in addition to data on chemical analyses, energy values, and digestibility. Without
DYNE
access to computers and knowledge of computer techniques, results reported herein would have been impossible to obtain. Skill in the use of such tools is therefore encouraged in modern range research training.
Summary
Results of earlier published phases of this experi- ment were integrated and utilized in mathematical analyses by applying nonlinear programming and matrix methods to obtain new nutritional informa- tion about range plants. Predictions were made of relative chemical composition, energy values, and digestibility of botanical components in diets of cattle and sheep. The predicted percent concen- tration of the Iz’th chemical in the j’th plant, fijk, was determined from data for the proportion by weight of the i’th sample that is contributed by the j’th plant, wij, and from data on the percent concentration of the Iz’th chemical in the i’th mixed forage sample, cik. Results obtained by this technique were tested for validity by analytical means and by comparisons to chemical analyses of hand-clipped samples from the same range.
Generally, differences in estimates of chemical composition of a given botanical category in Z-, 5-, and lo-component mixtures were small and not significant (P < 0.05). Best results were obtained if only sample data for which wik > 0 for all i and for a given J’ were included in the analysis. Esti- mating Fiji by including all k simultaneously in one analysis was preferable to independent analyses for each k.
Estimates were made for crude protein, ether extract, lignin, cellulose, other carbohydrates, and energy concentrations in samples for major plant groups, plant parts, and individual species in diets of esophageal fistulated animals. These data help explain unexpected variations in relative prefer- ences for annual range plants by cattle and sheep. Relative in vitro and in vivo cellulose digesti- bility of six major dietary botanical components were predicted from data on botanical composi- tion and microdigestion of mixed forage samples. Results obtained by these mathematical analyses would be difficult or impossible to obtain by direct experimentation. These and other recent analyt- ical studies illustrate the need for training more resource scientists in mathematical, statistical, and computer sciences.
LITERATURE CITED
FIACCO, A. W., AND G. P. MCCORMICK. 1964. The sequen- tial unconstrained minimization technique for nonlinear programming: a primal-dual method. Manage. Sci. 10: 360-366.
Letters to the Editor
Dear Sir:
. . . . Let’s face it, the journals are doing at member expense that which the institutions normally do for them- selves: i.e ., publish their data at their own expense.
Most institutions have funds to hire people, entertain politicians, junket all over creation, and use the telephone like it was foreign aid. When it comes to publishing, many “poor-mouth” as though they would have to fire the president to publish another paper. Organizations must publish, no ifs, no ands, no buts. . . . . Media other than mimeographing cost $35.00 or more per page. In addition an editor, clerk, typist, and possibly proofreaders are required, which increase the cost still further.
Attention all ASRM Members!
The New Mexico Section welcomes you to the 21st Annual Convention in Albuquerque, February 12-16, and invites you to come along with us to the oldest capital city in the nation and see places that made history before the Pilgrims landed at Plymouth Rock.
We have arranged a “Chance of a Lifetime” Tour to His- toric old Santa Fe aboard a special train on Wednesday, February 14th. There will be special entertainment on the train and stops at two Pueblos, the Pink Garter Saloon, and a three hour tour of Old Santa Fe.
Time: 8 a.m. to 6 p.m., Wednesday, February 14th. Cost: Approximately $6.00-not including lunch. P.S. If you want reservations, write to James L. Mitchell, 1805 Princeton SE, Albuquerque, N.M. 87106. Tickets will be sold at the registration desk.
We have a Board of Directors who need help in planning, an Editor that needs help to do a job, and a public
that needs serving better. A flat fee, We need help but we are not the such as $25.00 per page of sponsored only ones. . . . Administrators know research would cure a lot of ills: 1) It they need us but I doubt that many might reduce for a short while the num- will volunteer to pay. A little note ber of mss offered; but the number that says, “Your ms has been accepted offered would soon come back; 2) The and a small invoice of $25.00 (sug- quality of material offered would be gested price) per printed page will be improved; 3) The length of mss would sent upon its publication” will draw be reduced; and 4) The institutions groans but the administrators will OK would be getting a bargain. . . . the bills for payment.
LATE NEWS BULLETIN
A research or service organization needs many things but exposure in circles that count is paramount. Let’s count our blessings, come up with sound plans for the future, and move up to greatness.
Sincerely yours,
E. R. Beaty Athens, Georgia
Nonlinear Programming Predictions VAN DYNE, G. M. 1966b. Application and integration of
(Continued from page 46) multiple linear regression and linear programming in
HARKER, K. W., D. T. TORELL, AND G. M. VAN DYNE. 1964. renewable 362. resource analyses. J. Range Manage. 19:356- Botanical examination of forage from esophageal fistulas
in cattle. J. Anim. Sci. 23:465469. VAN DYNE, G. M., AND H. F. HEADY. 1965a. Botanical HEADY, H. F., AND G. M. VAN DYNE. 1965. Prediction of composition of sheep and cattle diets on a mature annual
weight composition from point samples on clipped herb- range. Hilgardia 36:465-492.
age. J. Range Manage. 18:144-148. VAN DYNE, G. M., AND H. F. HEADY. 196513. Dietary VAN DYNE, G. M. 1963. Comparative chemical and bo- chemical composition of cattle and sheep grazing in com-
tanical composition of fistula forage samples. Proc. Ann. mon on a dry annual range. J. Range Manage. 18:78-86. Meeting Amer. Sot. Range Manage. 16:45-46. VAN DYNE, G. M., AND H. F. HEADY. 1965c. Interrelations VAN DYNE, G. M. 1965a. Application of some operations of botanical and chemical dietary components of live-
research techniques to food chain analysis problems. stock on dry annual range. J. Anim. Sci. 24:305-312. Health Physics 11: 1511-1519. VAN DYNE, G. M., AND D. T. TORELL. 1964. Develop- VAN DYNE, G. M. 196513. Chemical composition and di- ment and use of esophageal fistula: a review. J.
gestibility of range plants from annual range and from Range Manage. 17: 7-19.
pure-stand plots. J. Range Manage. 18:332-337. VAN DYNE, G. M., AND W. C. WEIR. 1964. Microdigestion VAN DYNE, G. M. 1965c. Data on chemical and botan- of grazed annual forage, clipped herbages, and standard
ical composition of dietary samples grazed by cattle and samples by cattle and sheep. J. Range Manage. 17:327- sheep. Oak Ridge National Lab. TM-1376. 24 p. 332.
VAN DYNE, G. M. 1966a. Ecosystems, systems ecology, and VAN DYNE, G. M., AND W. C. WEIR. 1966. Comparison of systems ecologists. Oak Ridge National Lab. Report microdigestion techniques under range and drylot con-
ORNL-3957. 31 p. ditions. J. Agr. Sci. 67:381-387.