User Authentication Using Multimodal Biometrics
Prashant Kumar Jain #, Shailja Shukla #, S.S. Thakur *
# Department of Electronics & Communication, Jabalpur Engineering College Jabalpur (M.P)-482011 India
* Department of Applied Mathematics Jabalpur Engineering College, Jabalpur (M.P)-482011 India
Abstract
—
A biometric system which relies only on a single biometric identifier in making a personal identification is often unable to meet the desired performance requirements. Identification based on multiple biometrics represents an emerging trend. This paper presents a multimodal biometric system, which integrates the face verification and finger print verification. Face verification is done using the different methods, similarly finger print verification is done using there different methods. A Fuzzy based decision making system is designed, which takes input from the recognitions made by different face and finger-print identification techniques and gives an identity of recognized person. Preliminary experiment results demonstrate that the identity recognized by this integrated system is more reliable than the identity recognized by the available biometric systems in literature.Keywords— Face Recognition, Finger Print, PCA, ICA, ILDA, Correlation, Minutia matching Ridge Feature analysis, Fuzzy Fusion.
I. INTRODUCTION
In the recent years, biometric authentication has become popular in modern society. Multimodal biometric person authentication systems integrate multiple authentication techniques, and are important for many security applications such as government, defence, surveillance and airport security [1]. Biometrics is defined as the science of recognizing an individual based on his/her physical or behavioural property. A password or PIN can be forgotten or lost, but biometrics cannot be forgotten or lost and requires physical presence of the person to be authenticated. Thus personal authentication systems using biometrics are more reliable, convenient and efficient than the traditional identification methods.
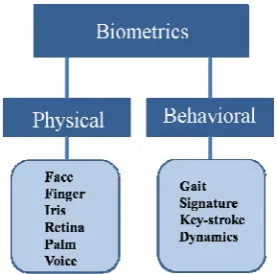
Biometric-based technologies include identification based on physiological characteristics (such as face, fingerprints, finger geometry, hand geometry, hand veins, palm, iris, retina, ear and voice) and behavioral traits (such as gait, signature and keystroke dynamics) [2].
There are two types of biometrics system for authentication: one is physical and other one is behavioural as shown in figure below:
Fig. 1: Types of Biometrics recognition system
A single biometric sometimes fails to be accurate enough for the identification of a large user population. Another disadvantage of using only one biometric is that the physical characteristics of a person for the selected biometric might not be always available or readable. To cater for the problems and limitations of single biometric, the multimodal systems are used, leading to the improvement of the system’s performances and the increase of the number of enlisted population in the systems and discouragement of fraud [2].
II. PROPOSED DESIGN
This paper presents a multimodal biometric system which considers the physical biometrics, Face and Finger Print, for person authentication.
Face recognition appears to offer several advantages over other biometric methods, a few of which are outlined here: Almost all these technologies require some voluntary action by the user, i.e., has to stand in a fixed position in front of a camera for iris or retina identification. However, face recognition can be done passively without any explicit action or participation on the part of the user since face images can be acquired from a distance by a camera. This is particularly beneficial for security and surveillance purposes. The single Face image is processed through Principal component analysis, Independent component analysis and improved linear discriminate analysis separately for recognition.
through Correlation based matching, Minutia based matching and ridge feature analysis separately for recognition.
As stated above one technique may fail due to the some unavoidable errors. Therefore, results for both the techniques are combined together to obtain more reliable authentication. Recognition Results for face and finger are processed through a fuzzy fusion stage separately and two results from this stage are again processed to fuzzy fusion stage for final recognition a shown in figure below:
Fig. 2: Proposed System
III.METHODS
A. Face Recognition:
Facial images can be easily obtained with a couple of inexpensive fixed cameras. Good face recognition algorithms and appropriate preprocessing of the images can compensate for noise and slight variations in orientation, scale and illumination [3].
Face recognition is used for two primary tasks:
1. Verification (one-to-one matching): When presented with a face image of an unknown individual along with a claim of identity, ascertaining whether the individual is who he/she claims to be.
2. Identification (one-to-many matching): Given an image of an unknown individual, determining that person’s identity by comparing (possibly after encoding) that image with a database of (possibly encoded) images of known individuals [3].
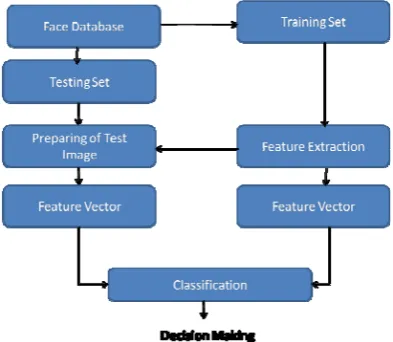
The for the face recognition techniques is shown figure 3.
Fig. 3: The Flow diagram for the face recognition
In the face recognition system the flow must be an important thing to be followed. It defines all the required steps in the face recognition system. Figure 3 defines all the required steps but the most important step is the Feature Extraction which is ultimately used for dimensional reduction as well as for extracting features from input of the system. Extracted features are passed to the last phase that is classification where the identification or verification rate is calculated.
The most popular methods used in the finger print identifications are detailed below:
1) Principal Component Analysis
A 2-D facial image can be represented as 1-D vector by concatenating each row (or column) into a long thin vector [4,5]. Let’s suppose we have M vectors of size N (= rows of image x columns of image) representing a set of sampled images.
p
j represent the pixel values.1 2
[ , ...
]
Ti N
x
p p
p
i
1...
M
(1)The images are mean centered by subtracting the mean image from each image vector. Let
1
1
M i im
x
M
represent the mean image, and letw
i bedefined as mean centered image
w
i
x
im
(2)Our goal is to find a set of
e
i’s which have the largest possible projection onto each of thew
i’s. We wish to find a set of M orthonormal vectorse
ifor which the quantity
2 11
M Ti i n
n
e w
M
is maximized with theorthonormality constraint
T
l k lk
e e
(3)It has been shown that the
e
i’s and
i’s are given by the eigenvectors and eigenvalues of the covariance matrixT
C WW
where W is a matrix composed of the column vectorsw
i placed side by side [4]. The size of C is N x Nwhich could be enormous. For example, images of size 64 x
64 create the covariance matrix of size 4096x4096. It is not practical to solve for the eigenvectors of C directly. A common theorem in linear algebra states that the vectors
i
e
and scalars ¸
i can be obtained by solving for the eigenvectors and eigenvalues of the M xM matrixW W
T . Letd
i and
i be the eigenvectors and eigenvalues ofT
W W
respectively.T
i i i
W Wd
d
(4)By multiplying left to both sides by W
T
i i i
which means that the first
M
1
eigenvectorse
i and eigenvalues
i ofWW
T are given byWd
i andi
respectively.Wd
i needs to be normalized in order to be equal toe
i. Since we only sum up a finite number of image vectors,M
, the rank of the covariance matrix cannot exceedM
1
(The -1 come from the subtraction of the mean vector m).The eigenvectors corresponding to nonzero eigenvalues of the covariance matrix produce an orthonormal basis for the subspace within which most image data can be represented with a small amount of error. The eigenvectors are sorted from high to low according to their corresponding eigenvalues. The eigenvector associated with the largest eigenvalue is one that reflects the greatest variance in the image [5]. That is, the smallest eigenvalue is associated with the eigenvector that finds the least variance. They decrease in exponential fashion, meaning that the roughly 90% of the total variance is contained in the first 5% to 10% of the dimensions. A facial image can be projected onto
M
M
dimensions by computing1 2
[ , ... ]
T Mv v v
(6)where
v
i
e w
iT i.v
i is thei
th coordinate of the facial image in the new space, which came to be the principal component. The vectorse
i are also images, so called,eigenimages, or eigenfaces in our case, which was first named by [5-9]. They can be viewed as images and indeed look like faces. The simplest method for determining which face class provides the best description of an input facial image is to find the face class k that minimizes the Euclidean distance
k k
(7)Where,
k is a vector describing thek
th face class. If
k is less than some predefined threshold,
a face is classified as belonging to the class k.Limitations of PCA
The main limitations of the PCA are as follows:
1. The face image should be normalized and frontal-view 2. The system is an auto-associative memory. It is harmful to be overfitted.
3. Training is very computationally intensive.
4. It is hard to decide suitable thresholds - It is kind of Art ! 5. The suggested methods to deal with unknown faces and non-faces are not good enough to differentiate them from known faces.
2). Independent Component Analysis
Independent component analysis (ICA) is one of the most widely used BSS techniques for revealing hidden factors that underlie sets of random variables, measurements, or signals. ICA is essentially a method for extracting individual signals from mixtures. Its power resides in the physical assumptions that the different physical processes generate unrelated signals.
Blind source separation (BSS)
Consider a situation in which we have a number of sources emitting signals which are interfering with one another. In each of these situations the mixed signals are often incomprehensible and it is of interest to separate the individual signals. This is the goal of Blind Source Separation.
The general model for ICA is that the sources are generated through a linear basis transformation, where additive noise can be present. Suppose we have N statistically independent signals,
s t i
i( ),
1, 2...,
N
. We assume that the sources themselves cannot be directly observed and that each signal,( )
is t
, is a realization of some fixed probability distribution at each time point t. Also, suppose we observe these signals using N sensors, then we obtain a set of N observation signalsx t i
i( ),
1, 2...,
N
.that are mixtures of the sources. A fundamental aspect of the mixing process is that the sensors must be spatially separated (e.g. microphones that are spatially distributed around a room) so that each sensor records a different mixture of the sources. With this spatial separation assumption in mind, we can model the mixing process with matrix multiplication as follows:( )
( )
x t
As t
Where A is an unknown matrix called themixing matrix and
x t
( )
,s t
( )
are the two vectors representing the observed signals and source signals respectively. Incidentally, the justification for the description of this signal processing technique as blind is that we have no information on the mixing matrix, or even on the sources themselves. The objective is to recover the original signals,s t
i( )
from only the observed vectorx t
i( )
. We obtain estimates for the sources by first obtaining the “unmixing matrix” W, where,W
A
1.This enables an estimate,s t
( )
, of the independent sources to be obtained:( )
( )
s t
Wx t
(8)The independent sources are mixed by the matrix A (which
is unknown in this case). We seek to obtain a vector y that approximates s by estimating the un-mixing matrix W. If
the estimate of the un-mixing matrix is accurate, we obtain a good approximation of the sources.
The above described ICA model is the simple model since it ignores all noise components and any time delay in the recordings.
ICA Algorithm Steps: Preprocessing
Before examining specific ICA algorithms, it is instructive to discuss preprocessing steps that are generally carried out before ICA.
Centering:
A simple preprocessing step that is commonly performed is to “center” the observation vector x by subtracting its mean vector
m E x
{ }
. That is then we obtain the centered observation vector,x
cas follows:c
This step simplifies ICA algorithms by allowing us to assume a zero mean. Once the unmixing matrix has been estimated using the centered data, we can obtain the actual estimates of the independent components as follows:
1
ˆ( )
cs t
A
x
m
(10)From this point on, all observation vectors will be assumed centered. The mixing matrix, on the other hand, remains the same after this preprocessing, so we can always do this without affecting the estimation of the mixing matrix.
Whitening:
Another step which is very useful in practice is to prewhiten the observation vector x. Whitening involves linearly transforming the observation vector such that its components
are uncorrelated and have unit variance [11,12]. Let
x
w denote the whitened vector, then it satisfies the following equation:{
T} 1
w wE x x
(11)is the covariance matrix of
x
w. Also, since the ICA framework is insensitive to the variances of the independent components, we can assume without loss of generality that the source vector, s, is white, i.e.{
T}
E ss
I
A simple method to perform the whitening transformation is to use the eigenvalue decomposition (EVD) [12] of x. That is, we decompose the covariance matrix of x as follows:
{
T}
TE xx
VDV
(12)where V is the matrix of eigenvectors of
E xx
{
T}
, and D is the diagonal matrix of eigenvalues, i.e.1 2
{ , ... }
nD diag
. The observation vector can be whitened by the following transformation:1/ 2 T w
x
VD
V x
(13)where the matrix
D
1/ 2is obtained by a simple componentwise operation as
1/ 2 1/ 2 1/ 2 1/ 2
1 2
{
,
,...
n}
D
diag
Whiteningtransforms the mixing matrix into a new one, which is orthogonal
1/ 2 T
w w
x
VD
V As
A s
(14)hence,
T
T T=
T=1
w w w w w w
E x x
A E ss
A
A A
(15)Whitening thus reduces the number of parameters to be estimated. Instead of having to estimate the
n
2elements of the original matrix A, we only need to estimate the new orthogonal mixing matrix, where An orthogonal matrix has(
1) / 2
n n
degrees of freedom. One can say thatwhitening solves half of the ICA problem. This is a very useful step
as whitening is a simple and efficient process that significantly reduces the computational complexity of ICA.
C. Linear Descriminate Analysis
Linear Discriminant analysis explicitly attempts to model the difference between the classes of data. LDA is a powerful face recognition technique that overcomes the limitation of Principle component analysis technique by applying the linear discriminant criterion. This criterion tries to maximize the ratio of the determinant of the between-class scatter matrix of the projected samples to the determinant of the within class scatter matrix of the projected samples. Linear discriminant group images of the same class and separates images of different classes of the images [13].
Consider a C-class problem with each class i consisting of a set of
N
i, d-dimensional samples{ , ...
1i 2i ii}
N
x x
x
}where the superscript
(.)
i represents the class label. Forillustrative purpose, we introduce a grand class which deprives the class labels. Denote the total number of
samples by 1
C
i i
N
N
, the frequency of occurrence ofthe
i
thclass byp
iN
iN
, the sample mean for thei
thclassby
i and the grand sample mean (regardless of class labels) by μ. We compute the above-defined quantities as follows [13]:1
1
;
i i
N C N C
i i i i i
j j
j i i j j i i j i
x
x
P
N
N
(16)LDA first estimates the within-class and between-class scatter matrices of size d × d, denoted by
w
and
B
, respectively, given by
1 1 1
1 1 1
1
1 i
i
N
C i C T
i i i i i
W W j j
i i j
N
C i C T
i i i
B B i
i i j
P x x
N
P N
N
(17)
where i
w
is the covariance matrix estimate for class igiven by
1
1
Ni Ti i i i i
j j
w
j i
x
x
N
(18)and i
B
is the scatter matrix between the class i and the ‘grand class’ given by
Ti i i
B
(19)In other words,
w
is estimated by ‘pooling’ together
det
det
T B
W T
W
W
W
J
W
W
(20)where det{.} denotes matrix determinant. The value of r can not exceed d− 1. Given a test pattern
y
, its class labely
C
is determined as2 i=1,2,..C
arg min
{
T(
i)
}
Y i
C
W
y
D
(21)where
D
i is used to incorporate prior information.B. Fingerprint Identification:
Fingerprint identification is one of the most well-known and publicized biometrics. Because of their uniqueness and consistency over time, fingerprints have been used for identification for over a century, more recently becoming automated (i.e. a biometric) due to advancements in computing capabilities. Fingerprint identification is popular because of the inherent ease in acquisition, the numerous sources (ten fingers) available for collection, and their established use and collections by law enforcement and immigration.
Fingerprint Verification Methods are as follows:
1) Correlation Based Method:
Let Q and T are query and template images of fingerprint respectively. Among the intensities of corresponding pixels the sum of squared differences (SSD) for two images can be employed as the measuring factor of diversity between them.
2
2 2
( , )
(
) (
t)
2
tSSD T Q
T Q
T Q T Q
T
Q
T Q
(22)The subscript “t” in above equation denotes transpose operation on a vector. Between Q and T the cross correlation function is given by,
CC T Q
( , )
T Q
t . If the termsQ
2 andT
2 are constant in above equation, the cross-correlation becomes inversely proportional to diversitySSD T Q
( , )
. In the next step the cross-correlation is the measure for the similarity. A couple of fingerprint impressions for the same finger may differ because of various factors. Thus additional steps are mandatory before the calculation of Q and T.Let the transformation of query image is represented by ( x y, , )
Q
, where
y
and
x
are translation parameters along y and x direction respectively, and
is rotation parameter. The similarity measure would be the function calculated by:( , , ) , ,
( , ) max
( ,
x y)
x y
S T Q
CC T Q
(23)( , )
S T Q
only considers the translation and rotation factors hence cannot result in the accurate measurement for similarity. The method is rendered unsuitable for highly distorted images. In global fingerprint patterns the distortion is profound, thus to some extent the distortion can be minimized considering the local regions. [14] [15] states about the approaches for matching based on localizedcorrelation. Factors like skin conditions, finger pressure and ridge thickness vary with different acquisitions of same finger. The cross-correlation and zero-mean normalized cross-correlation is sophisticated correlations that compensate for brightness and contrast variations and applying the proper proportions of binarization, thinning steps (performed on both Q and T) and enhancement may limit ridge thickness correlation [12]. It is very expensive to compute the maximum correlation
S T Q
( , )
in spatial domain. The reduction of computational complexity and translation invariance can be done by calculating correlation in Fourier domain [16].
1
( )
( )
T
Q F
F T
F Q
(24)
denotes the correlation in spatial domain
denotes the point-by-point multiplication of two vectors
denotes the complex conjugate(.)
F
andF
1 denote the Fourier transform and inverse Fourier transform.In this technique the rotation is dealt separately. Fourier-Mellin transform [17] is employed to gain both translation and rotation invariance.
In nut-shell, correlation based finger print matching is very simple process for finger print recognition. The query image is very first processed to get a feature image as shown in figure 3. This image is then XORed with all database templates. The output xor matrix is summed for every element. The template which gets minimum value is declared a match for query image.
Recognition Score = sum (database template XOR query image)
2.) Ridge Feature Based Matching:
As two fingerprints may share a small overlapped region, in order to evaluate the similarity degree of them, we should consider only the matching status in the over-lapped region. For each of the two fingerprints, compute the convex hull of ridge images. The overlapped region is the intersection of two convex hulls that are aligned according to the initial pairs of ridges. The various involve processes are
Representation of Ridges:
Due to noise in fingerprint images and imperfection of the feature extraction methods, there are complex structures, such as loops and bridges, in the ridge images. In order to make the ridge structure simple and consequently the following matching algorithm easier, a pre-processing step is performed [18]:
(1) Closed ridges are disconnected at an arbitrary point; (2) Ridges associated with bifurcations are split into three ridges;
(3) Short ridges are removed. In the matching stage, it is unnecessary and time-consuming to examine every point on a ridge.
Therefore, each ridge is sampled equidistantly and is represented by the list of sampled points.
Given two aligned ridges,
a
i iM1and
1N j j
b
point strings. Two points are matched if their Euclidean distance is less than a threshold. We created an array
( , ),
1, 2,... ;
1, 2,...
T i j i
M j
N
.T i j
( , ) 1
meansi
a
andb
j are matched.T i j
( , ) 0
meansa
iandb
jare unmatched.A list of index pairs
1,
K i l lP Q
will be found, where,
i l
P Q
are indices of ,
a
i iM1and
1N j j
b
respectively, and
,
i l
P Q
should satisfy the following conditions: (1)T P Q
i,
l
1
(2)
P Q
i,
l monotonously increase or decrease respectively; (3)|
P P
l
l1| 2,|
Q
l1| 2;
l
2...,
K
(25) The last condition means that to make the algorithm more robust to noise, slight dis-continuity in a matched point string is allowed. Such point strings can be found in T using dynamic programming technique [19]. If the longest list consists of more thanK i e K
th( . .,
th
3)
pairs of points, the correspondence between matched points will be recorded.Matching Score:
As two fingerprints may share a small overlapped region, in order to evaluate the similarity degree of them, we should consider only the matching status in the over-lapped region. For each of the two fingerprints, compute the convex hull of ridge images. The overlapped region is the intersection of two convex hulls that are aligned according to the initial pairs of ridges. The matching score
0
1
i i
score
score
of thei
th matching procedure can be computed according to the following formula [18]:2
1
.
2im
i i
N
score
N N
(26)where N
i1 and Ni2 is the number of ridge points of two
fingerprints in overlapped region, and N
im is the number of
matched sampled points. Then the final matching score is equal to the maximum of scorei.
C. Minutia Based Matching:
Let T and Q be the feature vectors, representing minutiae points, from the template and query fingerprint, respectively. Each element of these feature vectors is a minutia point, which may be described by different attributes such as location, orientation, type, quality of the neighbourhood region, etc. The most common representation of a minutia is the triplet
x y
, ,
, where,
x y
is the minutia location an
is the minutia angle. Let the number of minutiae in T and Q be m and n, respectively [22].1 2,..., , 1 2,..., ,
, , , , 1...
' , ' ' ' ' , ' , ' , 1...
m i i i i
m j j j j T m m m m x y i m
Q m m m m x y j n
(27)
A minutia
m
iin T andm
'
j in Q are considered matching, if following conditions are satisfied:
2 2
( ' , )j i 'j i 'j i
sd m m x x y y ro (28)
0( ' ,j i) min | 'j i|,360 | 'j i|
dd m m
(29) Here,r
0and
0are the parameters of the tolerance window which is required to compensate for errors in feature extraction and distortions caused due to skin plasticity. The number of “matching” minutia points can be maximized, if a proper alignment (registration parameters) between query and template fingerprints can be found. Correctly aligning two fingerprints requires finding a complex geometrical transformation function (map()), that maps the two minutia sets (Q and T). The desirable characteristics of map() function are: it should be tolerant to distortion, it should recover rotation, translation and scale1parameters correctly. Let match() be a function defined as:
"
1,
(
, )
0
j i
j i
if m and m
match m m
otherwise
(30)Where, map
m
'j
m
"j.Thus, the minutia matching problem can be formulatedas
( ) 1
maxP m P i , i
i
match map m m
(31)Where P() is the minutia correspondence function that determine the pairing between the minutia points in Q and T.
The minutia-based matching procedure is divided into three stages: coarse matching, fusing and fine matching. Coarse matching is first performed from a number of seeds, and the results are then fused to obtain a constrained corresponding relationship between minutiae in the template and query minutiae sets. By using the support degree of the elements in the constrained relations, the one-to-one correspondence is finally determined by comparison of similarity of local structures. Here, the similarity measure is given as follows: Suppose that only H pairs of matched points have been found during the matching then the score is
min( , )
H
Score
M N
(32)Where, M and N are the number of minutia in query and database image respectively.
IV.FUZZY LOGIC
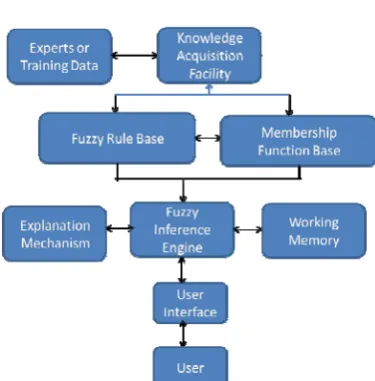
[23]. However, in fuzzy logic these tasks are performed by an expert system as represented in Figure 5.
Fig.4: Human expert system
Fig.5 Basic architecture of a fuzzy expert system
Individual components are illustrated as follows.
User interface: For communication between users and the fuzzy expert system. The interface
should be as friendly as possible.
Membership function base:A mechanism that presents the membership functions of different linguistic terms.
Fuzzy rule base: A mechanism for storing fuzzy rules as expert knowledge.
Fuzzy inference engine: A program that executes the inference cycle of fuzzy matching, fuzzy conflict resolution, and fuzzy rule-firing according to given facts.
Explanation mechanism: A mechanism that explains the inference process to users.
Working memory: A storage facility that saves user inputs and temporary results.
Knowledge-acquisition facility: An effective knowledge-acquisition tool for conventional interviewing or automatically acquiring the expert’s knowledge, or an effective machine-learning approach to deriving rules and membership functions automatically from training instances, or both.
Here the membership functions are stored in a knowledge base (instead of being put in the interface) since by our
method, decision rules and membership functions are acquired by a learning method. When users input facts through the user interface, the fuzzy inference engine automatically reasons using the fuzzy rules and the membership functions, and sends fuzzy or crisp results through the user interface to the users as outputs.
V. DATABASE
Face images for test are taken from AT&T data base. The files are in PGM format. Each image is of 92x112 pixels, with 256 grey levels per pixel. The images are organised in 10 directories (one for each subject), which have names of the form sX, where X indicates the subject number (between 1 and 10). In the proposed system we take the images of fingerprint from a standard database which contains 8 finger print of each person. Each image is 256*256 RGB image saved in bit mapped format.
Face database is created by converting every first image from each class to a column vector and saving it for further processing. While finger prints are in RGB, thus finger print enhancement is applied which includes following step:
1. RGB to gray conversion. 2. Gray to binary conversion.
3. Enhancing image to remove break point in Ridge and adjusting intensity of image.
4. Thinning Ridge Points. 5. Locating Core Point.
6. Locating Terminations and Bifurcations
7. Calculating ROI and Cropping around core point. After all this we get as shown below:
Fig. 6: Input Print to Database Image
VI.EXPERIMENTS AND RESULTS
Experiment is carried out using MATLAB. All the algorithms and methods stated above are implemented to provide recognized ID as output from each function. Three IDs detected for face and three IDs detected for finger are separately processed through a Fuzzy Fusion stage which has 300 rules. One more fuzzy stage is developed which has 100 rules to get final recognized ID from Fuzzy Face Id and Fuzzy Finger ID.
The simulation of the work is performed in MATLAB. In the first part of the work results for PCA, ICA and LDA is generated. For verification rate, the three parameters which can be needs to be considered are:
1) False Rejection Rate (FRR) 2) False Acceptance Rate (FAR) 3) Equal Error Rate (EER)
False Rejection Rate. It is defined in terms of percentage and it can be calculated as no. of FAR divided by total no. of identifications.
False Acceptance Rate (FAR) is defined as, the recognition system is carried out the identification or verification of the unauthorized or unknown person at that instance of the system the error is called Type –II error or False Acceptance Rate. It is also defined as a serious error of the recognition system. It is defined in terms of percentage and it can be calculated as no. of FRR divided by total no. of identifications.
Equal Error Rate (EER) is defined as, in the recognition system with the use of predetermine threshold values for false acceptance rate and false rejection rate, and threshold value where the false acceptance rate and false rejection rate are same then that is considered as Equal Error rate.
A. Fuzzification of Face recognition method
The Fuzzification of the Face recognition techniques is shown in figure. Here, the results of the PCA, ICA, and ILDA are fuzzified to obtain more accurate identification. For the input of the Fuzzifier the selected membership function is
and at the output of the fuzzy system the membership function is chosen to be
.As in the PCA the samples are considered to the normal. Therefore, a truncated Gaussian membership function known as
function is selected. In the function
,
and
defined as minimum, maximum and mean value of the training data set. Thec c
1,
2 defines the 0.5 value of the membership function. 1 1 1 1 1 2 1 2 0 2 1 2 ( ; , , ) 2 1 2 0 m m m m m m m m z z z cz c z
z z z c z c z z (33)
The value of the m can be selected to alter the shape of the
function. In this work the value of m is taken to be 2.Results for above test are as follows:
Table-I: Recognition Rate for different Methods using 100 Input images
B. Fuzzification of Finger print Identification technique
In case of the fingerprint identification three techniques as mentioned above; Correlation based, minutia based and Ridge based marching are used.In this work as input membership function Gaussian is chosen. The Gaussian MF is given by the expression,
2 2
2
( ; , )
x c
f x
c
e
Where the parameter c represents the mean or in other words distance form the origin and
represents the spread or width of the function.Similarly at the output of the fuzzy system the decision has to be made on the basis of the value obtained, over here a Gaussian function is not very suitable, therefore a triangular MF is taken. The triangular MF function is given by
( , , , ) max min
x a c x
,
,0
f x a b c
b a c b
(34)Where the parameters a and c locate the feet of the triangle and the parameter b locate the peak.
The obtained results are shown in Table 2
Table-II: Finger Recognition Rate for different Methods for 80 images Method False Rejection Rate (FRR) % False Acceptance Rate (FAR)% Equal Error Rate (EER)% Percentage of Recognition Correlation based matching
7 5 4 80
Minutia
matching 2 5 3 87.5
Ridge Feature matching
2 2 1 95.75
Fuzzy Fusion of
above three 1 1 0 97.5
Method False Rejection Rate (FRR) % False Acceptance Rate (FAR)% Equal Error Rate (EER)% Percentage of Recognition
PCA 6 4 3 87
ICA 2 2 2 94
ILDA 3 4 4 89
Fuzzy Fusion of
above three
In the final stage results of the fuzzy fusion of face and finger again fuzzfied for the user authentication.
Experiment GUI is as shown below:
Fig.7: Experiment GUI for Multimodal Biometrics
The final obtained results are shown in Table 3 where 160 images (one for finger and one for face ) are considered for 80 users .
Table-III: Final Recognition Result with 160 Images
Method
False Rejection Rate (FRR)
%
False Acceptance Rate (FAR)%
Equal Error Rate (EER)%
Percentage of Recognition Fuzzy
Fusion of Table-1
and Table-2
1 0 0 98.75
VII. CONCLUSIONS
Biometric systems are widely used to overcome the traditional methods of authentication. But the uni-modal biometric system fails in case of biometric data for particular trait. Thus the individual Results are combined using Fuzzy Logic to develop a multimodal Face and Finger print Recognition system .The verification accuracy obtained was 98.89% when performed on 100 Face images and 80 Fingerprint images of 10 persons. This is higher than when only single method is used for recognition. This accuracy can be further increased by adding signature and speech recognition to this multimodal system.
REFERENCES
[1] A. K. Jain, R. Bolle, and S. Pankanti, "Biometrics: Personal Identification in Networked Security,", Eds.: Kluwer Academic Publishers, 1999.
[2] .Rabia Jafri and Hamid R. Arabnia ‘A Survey of Face Recognition Techniques Journal of Information Processing Systems, Vol.5, No.2, June 2009.
[3] Eugen Lupu, Petre G. Pop, “Multimodal Biometric Systems Overview”, Acta Technica Apocensis Electronics and Telecommunications, Volume 49, Number 3, 2008..
[4] N. Surayahani and B. S. Hermila “Classifying Driver Facial Emotions” Proceedings of Muceet 2009..
[5] K. Kim, Face Recognition using Principle Component Analysis, Department of Computer Science University of Maryland, College Park MD 20742, USA.
[6] R. Cendrillon and B. C. Lowell, "Real-Time Face Recognition using Eigenfaces," in Proceedings of the SPIE International Conference on Visual Communications and Image Processing, Vol.4067, 2000, pp.269-276..
[7] M. Turk and A. Pentland, "Face Recognition Using Eigenfaces," in
Proceedings of the IEEE Conferenceon Computer Vision and Pattern Recognition, 1991, pp.586-591.
[8] M. Turk and A. Pentland, "Eigenfaces For Recognition," Journal Of Cognitive Neuroscience, Vol.3, pp.71-86, 1991.
[9] P. N. Belhumeur, J. P. Hespanha, and D. J. Kriegman, "Eigenfaces vs. Fisherfaces: Recognition using class specific linear projection,"
IEEE Transactions on Pattern Analysis and Machine Intelligence, Vol.19,
pp.711-720, 1997
[10] Irshad Ahamad, Ravi Pandit and Parag Parandkar , Separation of Independent Sources in Composite Signal International Journal of Electrical, Electronics and Computer Engineering 2013.
[11] Ganesh R. Naik and Dinesh K Kumar, An Overview of Independent Component Analysis and Its Applications, Informatica (2011) 63– 81.
[12] A. Hyvarinen, J. Karhunen, and E. Oja, Independent Component Analysis, John Wiley and Sons, Inc., 2001.
[13] Shaohua Kevin Zhou and Rama Chellappa, Multiple-Exemplar Discriminant Analysis for Face Recognition Center for Automation Research and Department of Electrical and Computer Engineering University of Maryland, College Park, MD 20742.
[14] A.M. Bazen, G.T.B. Verwaaijen, S.H. Gerez, L.P.J. Veelenturf, and B.J. van der Zwaag. A Correlation-Based Fingerprint Verification System. In Proc. of 11 Annual Workshop on Circuits Systems and Signal Processing (ProRISC), pages 205{213, 2000.
[15] K. Nandakumar and A. K. Jain. Local correlation-based fingerprint matching. In Indian Conference on Computer Vision, Graphics and Image Processing, pages 503-508, 2004.
[16] Louis Coetzee and Elizabeth C. Botha. Fingerprint recognition in low quality images. In Pattern Recognition, volume 26, pages 1441-1460, 1993.
[17] Vivek A. Sujan and Michael P. Mulqueen. Fingerprint identification using space invariant transforms. Pattern Recogn. Lett. 23(5):609-619, 2002.
[18] Jianjiang Feng, Zhengyu Ouyang ,Fei Su and Anni Cai, An Exact Ridge Matching Algorithm for Fingerprint Verification, Beijing University of Posts & Telecommunications, Post Box 111, Beijing 100876, P. R. China.
[19] Cormen, T.H., Leiserson, C.E., Rivest, R.L.: Introduction to Algorithms. McGraw-Hill, New York 1990.
[20] Jain, A.K., Hong, L., Bolle, R.: On-line Fingerprint Verification. IEEE Trans. Pattern Anal. Mach. Intell. 19 (4) (1997) 302-313. [21] Haralick, R., Shapiro, L.: The Consistent Labeling Problem II. IEEE
Trans. Pattern Anal. Mach. Intell. 2 (1980) 193-203.
[22] Abhishek Rawat A Hierarchcal finger print matching system, M.Tech. Thesis IIT Kanpur.