ABSTRACT
MYERS, RACHEL ANNE. Population Genetic Methods for Detecting Genetic
Contributions to Complex Traits. (Under the direction of Jeffrey Thorne and Eric Stone.)
Linking genomic variation to observed differences in phenotype is a major goal in both statistical and population genetics. These two fields have recently been split due to the requirement in population genetics for sequence data while statistical genetics utilizes genome-wide ascertained data. However, more advanced sequencing technologies are now bridging this gap between statistical and population genetics for genome-wide studies by providing faster and more affordable sequencing.
Population Genetic Methods for Detecting Genetic Contributions to Complex Traits
by
Rachel Anne Myers
A dissertation submitted to the Graduate Faculty of North Carolina State University
in partial fulfillment of the requirements for the degree of
Doctor of Philosophy Bioinformatics
Raleigh, North Carolina 2010
APPROVED BY:
__________________________ __________________________
Jeffrey Thorne Eric Stone
Chair of Advisory Committee Co-Chair of Advisory Committee
__________________________ _________________________
Philip Awadalla Ignazio Carbone
DEDICATION
In loving memory of my brother,
David John Myers,
whose short life inspired me to study medical genetics.
~
In loving memory of my grandfather,
John Smith Yates,
who taught me to question everything.
~
In honor of my parents,
Dr. Ronald T. and Linda Y. Myers,
BIOGRAPHY
I was born on November 7, 1982 in DuBois, Pennsylvania, to Ronald and Linda Myers. After the birth of my brother, David, we relocated to northwest Ohio, where we shared eight short years as a family of four. At the age of thirteen, I lost my brother to the genetic disorder called Adrenoleukodystropy (ALD). Witnessing and helping in his battle for life, I was inspired to pursue a career in medical research, hoping to one day improve someone else’s battle for life.
In 2001, I became closer to my career goal by beginning my undergraduate study at The Pennsylvania State University in State College, PA. In 2005, I graduated with Bachelor of Science degree in Biochemistry and Molecular Biology, a minor in
Chemistry, and many lessons learned along the way. During my undergrad, I held many lab assistant positions but the most influential was at The Plant Science Research Center at University of Toledo. Under the direction of Dr. Parani and Dr. Siram, I studied the effect of nitric oxide on gene expression in plants. During this experience, I quickly learned that wet lab work was not my strength; rather, my strength was in analyzing the results of the gene expression study. Drs. Parani and Siram noticed the affinity to data mining and sat down with me to discuss my future as a researcher; recommending I pursue a graduate program in bioinformatics.
ACKNOWLEDGEMENTS
I thank my advisor, Philip Awadalla, for the invitation to join his lab and for embracing gchat and skype for our long distance communication. Philip, it has been a great joy to watch the lab expand and you grow as a PI. I thank my ‘advisor pro-tempe’, Eric Stone, for being available when I needed a face-to-face advisor chat or when I didn’t understand Philip’s marching orders. I thank Jeffrey Thorne for his thoughtful and critical questions, always ensuring we came to a solution, even if it required a few days for both of us to think. To Jung-Ying Tzeng, I am grateful for your time answering my statistical questions, and to Ignazio Carbone, I enjoyed our discussions and your perspective.
To the former and current Awadalla lab members, Kate, Jon, Julie, Jacki, Martine, Ferran, and Youssef, thank you for the many edits of my manuscripts, your assistance with my research, making my Montreal visits enjoyable, and the moral support I needed from time to time. I wish you all the very best in your future endeavors and hope our paths cross again. To Lisa, Jon, Ben, and Shengdar, while this journey has been rocky from time to time, it has been much easier experiencing it with you. To the remaining BRC students and faculty, thank you for lending me an ear when I had a quick question. To JB, Karen, Tina, and Dr. Zeng, thank you for taking care me administratively, without you I would be lost in a maze of paperwork.
TABLE OF CONTENTS
LIST OF TABLES... ix!
LIST OF FIGURES... xi!
Chapter 1 Complex Trait Models in the Age of Resequencing ... 1!
Introduction...2!
The Common Disease - Common Variant Hypothesis ...3!
Overview...3!
Experimental Design ...4!
Examples...6!
Limitations...7!
The Common Disease - Rare Variant Hypothesis ...9!
Overview...9!
Experimental Design ...10!
Examples...11!
Limitations...13!
Natural Selection ...15!
Overview...15!
Tests of Natural Selection...15!
Examples...18!
Complex Disease Model Predictions...19!
References ...21!
Chapter 2 Global Genome-wide Variation is Shaped by Selection and Drug Resistance in the Agent of Malaria, Plasmodium falciparum... 27!
Abstract...28!
Author Summary ...29!
Introduction...30!
Results and Discussion...33!
Population Mutation Rates and Inferences of Selection...33!
Geographic selection ...36!
Population Structure and Associations with Drug Resistance...38!
Power and Type 1 Error of Association Methods for P. falciparum Drug Response ...39!
Population Structure in Global Samples of P. falciparum ...41!
Drug Response Association...42!
Selection at Drug Associated Loci ...45!
Conclusions ...47!
Acknowledgements ...48!
Methods...49!
SNP and SSR Population Structure ...49!
SNP Association ...50!
SSR Power Analysis ...53!
Maximum Likelihood Hudson Kreitman and Aguade (MLHKA) test ...53!
Proportion of Positively Selected Amino Acids...54!
Calculation of M and U. ...54!
Estimating Genetic Drift...56!
References ...57!
Chapter 3 Genome-wide Positive Selection, Recombination Hotspots, and Loci Associated with Plasmodium falciparum Resistance to Antimalarial Drugs ... 77!
Abstract...79!
Introduction...79!
Results ...80!
Conclusions ...86!
Methods...87!
Parasite collection...87!
DNA extraction and SNP genotyping using MIP array...87!
Drug assays and IC50 calculation ...88!
Structure, Fst and principal component analysis ...88!
Estimate of recombination events...89!
Detection of recent positive selection...89!
Genome-wide association analysis ...90!
Web Resources ...91!
Acknowledgements ...91!
Author Contributions ...92!
References ...93!
Chapter 4 Direct Measure of the de novo Mutation Rate in Autism and Schizophrenia Cohorts ... 109!
Summary...111!
Introduction...112!
Subjects and Methods...113!
Diagnostic screening and selection of patients...113!
Selection of candidate genes...115!
DNA preparation, sequencing and variant identification ...117!
Estimation of base-pairs screened ...118!
Evaluation of false negative mutation calls ...119!
Prediction of missense severity ...120!
Statistical Analysis...120!
Results ...120!
Identification of de novo mutations...120!
Estimates of the Neutral Human Mutation Rate...122!
Excess of functional DNMs in ASD and SCZ cohorts...123!
Comparing DNMs and segregating variant ratios ...125!
Discussion...126!
Acknowledgments ...129!
References ...131!
Chapter 5 A Population Genetic Approach to Mapping Neurological Disorder Genes using Deep Resequencing... 142!
Abstract...144!
Author Summary ...145!
Introduction...146!
Results ...148!
Variants Discovered from Deep Resequencing...148!
Individual Genes with Excess of Missense and Rare Missense Variants...150!
Excess of Rare Deleterious Variants at Autosomal Loci Among ASD and Schizophrenia Individuals...153!
Discussion...155!
Materials and Methods...160!
Candidate gene selection ...160!
Samples...161!
DNA preparation, Sequencing and SNP calling...164!
Population Structure ...165!
Computational Inferences of Mutation Severity...166!
Statistical Analysis...166!
Acknowledgements ...168!
References ...169!
Chapter 6 Conclusions... 187!
Summary of Main Results...189!
LIST OF TABLES
Table 2-1. McDonald-Kreitman Tests for Departures from Neutrality for the Length of
Chromosome 3. ... 67!
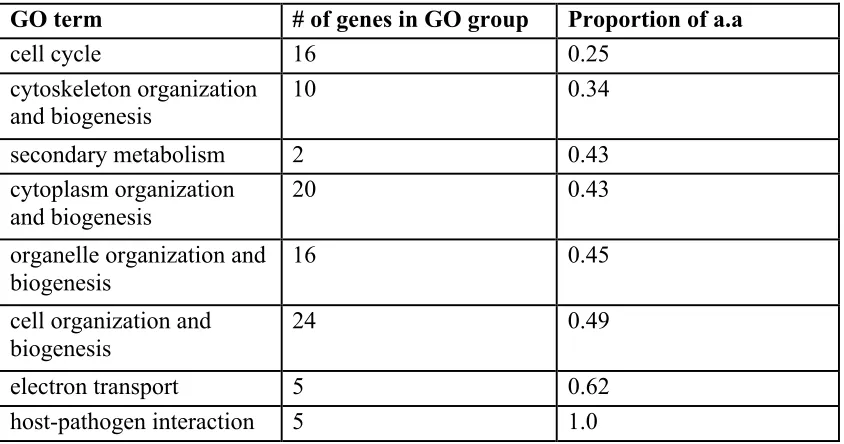
Table 2-2. Frequency of Positively Selected Amino Acids per Gene Ontology Group. .. 67!
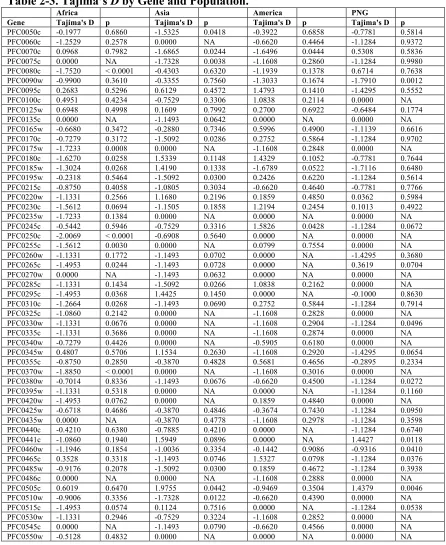
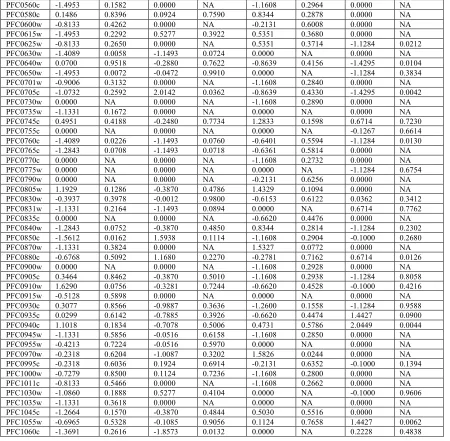
Table 2-3. Tajima’s D by Gene and Population. ... 68!
Table 2-4. Tajima’s D Across Loci... 70!
Table 2-5. Estimates of Genetic Drift. ... 70!
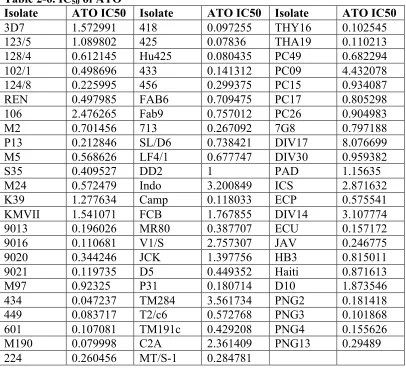
Table 2-6. IC50 of ATO... 71!
Table 2-7. Significant SNP Associations... 72!
Table 2-8. Significant SSR Associations. ... 73!
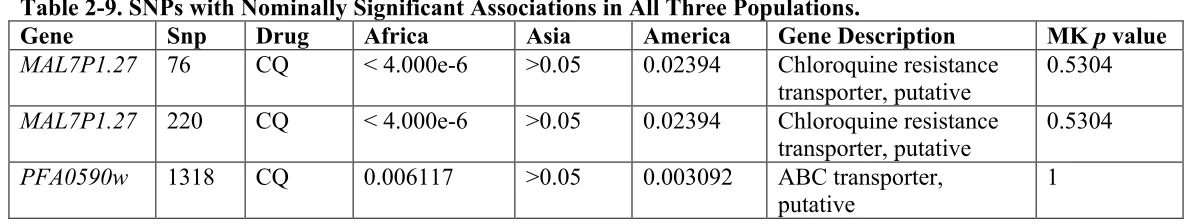
Table 2-9. SNPs with Nominally Significant Associations in All Three Populations... 73!
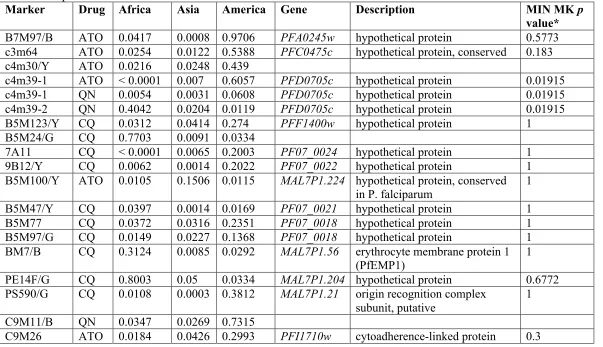
Table 2-10. SSR with Nominally Significant Associations in Two or More Populations. ... 74!
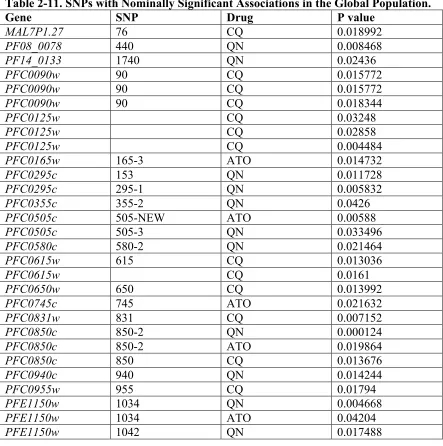
Table 2-11. SNPs with Nominally Significant Associations in the Global Population.... 76!
Table 3-1. Genes under significant selection detected by all the three haplotype tests.. 106!
Table 3-2. Genes/SNPs significantly associated with drug responses within Asian and African parasite populations*. ... 107!
Table 4-1. De novo mutations discovered by re-sequencing. ... 136!
Table 4-2. Cell line mutations not observed in the blood sample of patients... 138!
Table 4-3. Base-pairs and DNMs surveyed among ASD and SCZ trios with no-family history. ... 139!
Table 4-4. Clinical Information for ASD and SCZ Individuals where DNMs were confirmed. ... 140!
Table 5-1. Segregating Sites and Diversity in the Disease Cohorts. ... 183!
Table 5-2. Nonsense Mutations in Disease Cohorts ... 184!
Table 5-3. Counts for Silent to Missense Ratios in MAP1A... 184!
Table 5-4. Counts for Collapsing Method for Significant Results ... 184!
Table 5-5. Prfeq Maximum Likelihood Estimates of Demographic and Selective Models. ... 185!
LIST OF FIGURES
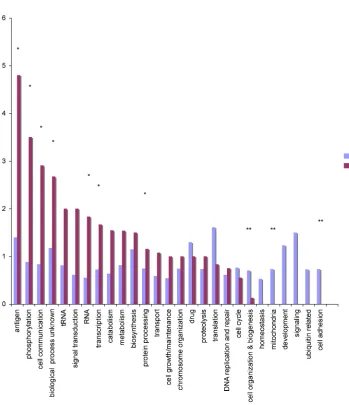
Figure 2-1. The ratios of nonsynonymous and synonymous polymorphisms (pn/ps) and
divergence (dn/ds) for genes grouped by Gene Ontology. ... 63!
Figure 2-2. Global Population Structure in P. falciparum... 64!
Figure 2-3. EIGENSOFT inferences of population structure. ... 66!
Figure 3-1. Population structure and principal component analysis (PCA) of Plasmodium falciparum parasite populations. ... 96!
Figure 3-2. Recombination events and hotspots on the 14 chromosomes of parasites... 97!
Figure 3-3. Loci subject to positive selection in Plasmodium falciparum populations from Africa, Asia and America. ... 101!
Figure 3-4. In vitro parasite responses (IC50) to seven antimalarial drugs. ... 103!
Figure 3-5. Genome-wide scan for SNPs associated with responses to antimalarial drugs in the Asian population. ... 104!
Figure 3-6. Quantile-Quantile plots of P-values before and after principal component analysis (PCA) correction for genome-wide scans... 105!
Figure 4-1. MAPP P values by Minor Allele Frequency... 135!
Figure 5-1. Principal Component Analysis (PCA) of Disease Cohorts... 175!
Figure 5-2. MAPP values in common versus rare variants. ... 176!
Figure 5-3. Excess of Missense Variants by Gene. ... 177!
Figure 5-4. Distributions of Individual Locus Selection Coefficients... 178!
Figure 5-5. Distribution of per Gene Tajima’s D. ... 180!
Figure 5-6. Observed and Expected Site Frequency Spectrum. ... 181!
Introduction
Understanding the genetic etiology of complex traits or diseases in natural
populations of both humans and human pathogens is an important focus in medical and
statistical genomics because understanding the genetic causes of complex disease leads to
early diagnosis and personalized treatments. One of the main issues concerning this
relationship is determining the link between causal allele frequencies and their effects on
phenotypic variation. The Common Disease – Common Variant (CDCV) hypothesis
proposes that this relationship can be best described by a limited set of common alleles
individually contributing to a smaller portion of phenotypic variation in complex disease.
In contrast, the Common Disease – Rare Variant (CDRV) hypothesis argues that this
relationship is better modeled through a larger set of rare alleles each contributing to a
larger portion of phenotypic variation in complex disease. Each hypothesis has relative
strengths and weaknesses depending on the complex disease that they are trying to
model. For example, diseases that do not affect reproductive fitness are better described
by the CDCV while diseases that have a detrimental impact on reproduction are better
modeled by the CDRV. The following sections will describe both of these hypotheses in
detail, discussing their experimental designs, practical applications, and limitations. This
chapter will conclude with an overview of natural selection and its role in both the CDCV
The Common Disease - Common Variant Hypothesis
Overview
The common disease – common variant (CDCV) hypothesis proposes that
common or complex diseases having an inherited component are caused by alleles at
moderate frequency (minor allele frequency > 0.05). This hypothesis was derived from
observations of Mendelian diseases, where genetic markers showed a strong association
with phenotype status. For example, the apoliopotien E type 4 allele (APOE-epsilon 4) is
associated with increased risk of Alzheimer’s Disease [1]. Expanding on these
observations, Collins and Lander proposed creating a catalogue of common variants and
using those variants to search for susceptibility genes by testing allele frequency
differences in affected versus unaffected cohorts [2].
The human leukocyte antigen (HLA) system became the first genomic region to
be thoroughly mapped and used to test for autoimmune disease associations [3]. As the
catalogue of common variants grew with the HapMap project [4,5], coupled with
technologies capable of parallelized genotyping of hundreds of thousands of variants in a
single sample [6], systematic genome-wide association studies became a popular tool for
studying human complex diseases and traits. Additionally, this strategy of cataloguing
common variants and systematically testing associations with different traits and diseases
were adapted for model organisms and human pathogens (e.g. Plasmodium falciparum
Experimental Design
CDCV is primarily tested using genome-wide association studies (GWAS). The
two main types of GWAS are dictated by phenotype; discrete (case-control) and
quantitative. A case-control design consists of a cohort of affected samples (cases) and a
cohort of unaffected samples (controls). A quantitative trait design consists of a random
collection of samples for which a continuous trait is measured (e.g. blood pressure or
drug response). For both designs, the ideal sample selection would have a homogenous
population; however, this is rarely the case. Typically samples are drawn from multiple
populations, which creates population structure in theses study cohorts because allele
frequency varies between populations. However, this population structure can result in
false positive associations due to variance in allele frequencies within populations and
between populations. To address such false positives, several methods for controlling
population structure have been devised. For example, one method pairs cases and
controls based on ethnicity or sampling location to standardize population representation
in each cohort. Such a methodology can mitigate the effects of false positive associations
since standardizing population representation also standardizes allele frequency variance
between cohorts. Alternatively, evidence of population structure from either principal
component analysis [9] or software programs such as structure [10] can be incorporated
as cofactors in association tests. This correction is important since researchers have
proposed using “common controls” [11], or a group of normal individuals that have been
The genotype data collected from the cohorts in GWAS are extracted utilizing microarray technologies like Affimetrix’s SNPchip and Illumina’s BeadChip. These tools are commonly used to genotype thousands to millions of previously ascertained single nucleotide polymorphisms (SNPs) in each sample. One of the primary criticisms of these aforementioned tools is that the collection of SNPs for these tools has been ascertained by resequencing a limited set of samples. For example, SNPs ascertained using the HapMap European samples could be detrimental to a study focusing on African-American
populations. Also, testing every known common variant is beyond the scope of current array-based technologies. Due to this limitation, a smaller, informative set of SNPs that have strong correlations with their neighbors (r2 ! 0.8) can be used [12]. These SNPs, called tagSNPs, can capture most of the common variation by utilizing the linkage disequilibrium (LD) patterns observed in HapMap samples [13]. Quality control filters including Hardy Weinberg Equilibrium, call rate, minor allele frequency, and Mendelian error are then applied to the genotype calls to minimize error in the resulting genotype data.
Tests of genotype – phenotype association range from a !2 to likelihood ratio tests. The !2, extensions of !2 like the Armitage-Cochran trend test [14], and logistic regression are used to test in case-control studies. Linear regressions, correlation tests, and likelihood tests are used to evaluate genotype – phenotype associations for
regression-based testing. SNPs with P values meeting a cutoff (e.g. P value > 0.05) after multiple testing correction (e.g. Bonferroni) or a False Discovery Rate (FDR) [15] cutoff (e.g. 0.01) are considered candidate variants. Follow-up studies aim to either replicate these associations in a second and larger population, resequence the candidate region to find causal SNPs, or conduct functional studies in model organisms. While P values indicate the statistical significance of a SNP association with phenotype, the impact of the allele on the phenotype is summarized in one of three ways: an odds ratio (OR), an effect size, or a relative risk (RR).
Examples
independent samples of similar ethnicity confirmed 4 of the 7 loci [27]. This study-to-study variability in association results and limited replication is a common occurrence in human GWAS.
In addition to humans, GWAS has been used to map variants involved in plants to identify genetic determinates of pathogen response [28] and response to environmental stressors [29]. As efforts to catalogue common variants in human pathogens are
completed (e.g. Plasmodium falciparum [7,8]), researchers aim to apply lessons learned from human GWAS to human pathogens.
Limitations
While the CDCV hypothesis has been somewhat successful, researchers have found both technical and theoretical limitations with using GWAS to study complex diseases. Technical limitations include sample size requirements, variation ascertainment, and the narrow focus of current genotyping technology, while the primary theoretical limitation is the assumption the phenotypes are selectively neutral.
inverse exponential relationship between the required sample size and effect size [30], some larger studies may be under-powered and those associations found in larger studies maybe of strong effect rather than moderate effect.
Another technical limitation in GWAS is due to the genotyping technology; most microarrays are biased towards European ancestry populations and reduced coverage for other populations, particularly African populations. For example, genome coverage may range from 64-93% for the Caucasian (CEU) HapMap samples and 29-68% for the Yoruba (YRI) HapMap samples when r2 ! 0.8 between included SNPs and neighboring SNPs [31]. This bias arises from the populations selected for the ascertainment SNPs. Coverage for non-European populations will improve with ongoing efforts to catalogue common variation and LD structure in other populations.
The major theoretical limitation of the CDCV hypothesis is the assumption that phenotypes are selectively neutral. The basis of this assumption is that the complex diseases and traits studied tend to be late onset and/or do not affect reproduction. Additionally, due to the complex nature of a disease and its genetic components, selection is assumed to be negligible at causal sites. This neutrality assumption is often violated, for example, individuals affected with autism are less likely to reproduce. The resulting selection reduces the frequency of susceptibility alleles [32], which decreases power to detect causal variants.
spurious, or that the follow-up studies may be under powered. Some of these issues have convinced researchers to consider alternative genetic models such as CDRV for
describing the genetic components of phenotype variability.
The Common Disease - Rare Variant Hypothesis
Overview
For several human traits, the CDCV hypothesis has explained a small proportion of genetic etiology. This came as a surprise when these traits (e.g. neurological disorders) were highly heritable. However, complex disease studies focused on small families showed rare inherited and/or de novo variants associated with disease [33,34]. These findings altered how researchers viewed the cause of genetic diseases, emphasizing the role of rare variation in common disease. The common disease – rare variant (CDRV) hypothesis proposes that the genetic etiology of complex disease is heterogeneous; many different variants found at low frequency can be causal.
Experimental Design
Like CDCV, testing the CDRV hypothesis begins by utilizing case/control design or quantitative design. Ideally, all cases and controls should be sampled from a
homogenous population. Similar to testing the CDCV hypothesis, population structure is an issue for CDRV but for an entirely different reason. In CDCV, population structure is tested for and controlled. In CDRV, however, population structure is eliminated through removing outlier samples until a homogenous population remains. Outlier samples host variants that are private to the source population, but not present in the population being studied. Their removal is necessary because samples from different populations will inflate the number of rare variants detected.
The types of rare variants studied will determine the technology used to interrogate the samples. Rare structural variants have been interrogated using comparative genome hybridization (CGH) genotyping and tiling arrays [35], while resequencing can better interrogate rare SNPs and small insertions and deletions (indels) [36]. For studying a limited set of candidate genes, technologies like Sanger sequencing and Pyrosequencing are suitable; however, to study rare variants, genome-wide, cost-effective massively parallelized or “next gen(eration) sequencing” is required.
individuals not carrying rare alleles in cases compared to controls. Significance is
assessed using Fishers Exact test for one rare variant per gene or the Mantel-Haenszel test for multiple rare variants at a given gene [37]. Li and Leal proposed that for any given gene, one method for testing association is to collapse all rare variants into a single variant and then to test this collapsed variant for association with the phenotype [38]. Another commonly used method utilizes Fisher’s Exact Test to evaluate the ratio of rare missense mutations to silent mutations in cases and controls [39]. This method is used since rare protein-altering (nonsynonymous) mutations are more likely to be deleterious than silent (synonymous) mutations and be more prevalent in disease-associated genes in the affected cohort. A common extension of both methods is to use mutation severity predictors (e.g. MAPP [40], SIFT [41] and Polyphen [42]) to classify the rare missense mutations as protein damaging or benign, and test for excess of rare damaging variants within a gene.
Like GWAS, similar multiple testing corrections are applied and P values are used to determine significance. While summary statistics describing the impact of the variant association like odds ratio and relative risk are used, it is unclear what these measures indicate and whether they can accurately predict the risk of disease.
Examples
or intermediate phenotypes (e.g. high density lipoprotein cholesterol ‘HDL-C’ levels, blood pressure) to uncover their genetic factors. Studies include Cohen et al.’s
investigation of rare allelic contributions to HDL-C levels in Canadians and participants of the Dallas Heart Study. An excess of nonsynonymous mutations private to the low HDL-C group was found in three candidate genes, adenosine triophosphate binding cassette transporter A1 ‘ABC1’, apolipoprotein A1 ‘APOA1’, and lecithin cholesterol acyltransferase ‘LCAT’, when compared to private nonsynonymous mutations found in the high HDL-C or nonsynonymous variants found common to both low HDL-C and high HDL-C groups [39]. In a related study, Cohen et al. link low absorption of
cholesterol to rare nonsynonymous variants in the candidate gene Niemann-Pick Type C1 Like 1 (NPC1L1) [43].
As analysis of whole genomes becomes tractable in both the sequencing
technology and bioinformatics arenas, rare variant detection and analysis will expand to genome-wide scans rather than candidate gene resequencing. For example, a recent whole-genome sequencing of a single quartet, with both offspring affected with Miller’s syndrome and primary ciliary dyskinesia, implicated a handful of SNPs and genes likely to cause the diseases based on observed inheritance [45]. An earlier study of Miller’s syndrome demonstrated resequencing could be used to find causal variants in rare, Mendelian disorders. Ng et al [46] used exome resequencing of two siblings and two unrelated individuals affected with Miller’s syndrome. Using just the two siblings, only nine genes showed mutational patterns that matched the recessive disease model, adding just one more affected individual reduced the number of genes to a single gene, DHODH, as associated with Miller’s syndrome. As these whole genome studies expand to multiple families, candidate regions will become further refined without the limitation of only resequencing candidate genes.
Limitations
The major technological limitation for genome-wide testing of the CDRV
from experimental and alignment error. Even if experimental error is eliminated, the ability to detect rare variants remains limited, but improves with increased sample size. Li and Leal report that in a random sample of 100 individuals, 18.1% of variants with a population frequency of 0.001 will be detected genome-wide. However, when the sample size is increased to 1000 individuals, 86.5% of variants with frequency 0.0001 will be detected. When focusing on detecting all variants within a gene for diseased vs. control cohorts, there is a positive correlation in probability of detecting all rare variants and relative risk [48].
Methods for testing rare CDRV are also limited and one of the current areas of research. Historically, the genomic unit for detecting excess of rare variants has been defined as a gene or groups of candidate genes. As full genome sequencing becomes more popular, defining the physical unit to test CDRV will become more involved. For example, gene definitions could be extended to include up and down stream regions, tests could be completed in sliding window fashion, or genes could be grouped by gene
Natural Selection
Overview
Natural selection affects genomic variation, from altering the distribution of allele frequencies to shaping haplotype structure in a population. The premise of natural
selection is alleles that enhance survival and reproduction will increase in frequency [49]. The major types of natural selection include positive, negative or deleterious, and
balancing selection. Mutations conferring increased fitness will increase in frequency or undergo positive selection. Negative selection occurs when mutations that decrease reproductive fitness are removed from the population. Finally, balancing selection, sometimes known as heterozygote advantage, occurs when allelic heterogeneity has increased reproductive fitness. Several tests of neutral evolution have been developed based on neutral theory and population genetic expectations.
Tests of Natural Selection
Model-based and qualitative tests have been developed to detect different types of selection which each leave different signatures in the genome. Tests of selection include site frequency based tests (e.g. Tajima’s D), divergence based tests (e.g. McDonald Kreitman), or haplotype sharing tests (e.g. Long Range Haplotype).
In resequenced genomic regions, the distribution of allele frequencies is
spectrum (SFS) from neutral expectations and Tajima’s D. The site frequency spectrum provides information about the history of a population, including selection. However, demography and selection can have similar effects on the SFS: population growth can look like negative selection, and bottlenecks can look like balancing selection. SFS-based inferences of selection must also account for demography, typically by estimating
demographic parameters from an SFS derived from non-functional sites and estimating selection parameters (") from functional sites [50,51]. Like the SFS, demography and
selection both affect Tajima’s D. Tajima’s D [52] is the contrast of two population
mutation rate (4Nµ) estimators: #W based on the number of segregating sites detected and
$ based on the number of pair-wise differences. Under neutral theory of evolution, the two mutation rate estimators are equal and Tajima’s D is zero. A positive Tajima’s D indicates balancing selection or population bottlenecks, while negative Tajima’s D can arise from positive selection or population growth [53]. Since demographic forces affect the whole genome and selection is locus specific, contrasting gene specific Tajima’s D to genome-wide estimates is a method of isolating selection effects from demographic effects.
Pn, respectively) make up a two by two contingency table. Under neutrality, the expected value of the expected value of the ratio Ps to Ds equals Pn to Dn and departures from neutrality are detected using a !2 test with 1 degree of freedom. Departures from neutrality can be assigned as diversifying positive selection when Dn/Ds > Pn/Ps and as balancing selection when Dn/Ds < Pn/Ps [55]. The MK test has been expanded to estimate the fraction of nonsynonymous divergent sites driven by positive selection (%) [56], the
proportion of nonsynonymous polymorphisms that are deleterious [57], and the selection coefficient (") [58,59]. Unlike Tajima’s D, the MK test is robust to demography, as demography affects both nonsynonymous and synonymous sites.
Qualitative based tests of positive selection evaluate haplotype sharing for each allele of a segregating variant. Selective sweeps leave a unique signature in the genome, as a specific allele rises in frequency due to positive selection, the haplotype the allele resides on will also increase in frequency, leaving a region in the genome with elevated LD surrounding the selected allele. This effect is known as the hitchhiking effect [60]. Partial selective sweeps, or selective sweeps that have not reached fixation, can be detected using the Long Range Haplotype (LRH) test. Haplotype homozygosity of an allele is measured using the extended haplotype homozygosity (EHH) statistic, defined as: given a core SNP allele and distance x, the probability two randomly chosen
control for variation in recombination rates. The LRH test tests for haplotypes with high frequency (>0.1) and high EHH relative to the genome-wide distributions and/or
coalescent simulations are putative targets of positive selection. Extensions of this test include the iHS test [62] in which evaluates the log ratio of integrated EHH for each allele of the core SNP, and the XP-EHH [63] which contrasts haplotype homozygousity between populations to identify selective sweeps that have reached fixation in one population but not the other.
At the genome-wide level, EHH-based tests have an advantage over the MK test and Tajima’s D since EHH can be used with ascertained data. Now that genome-wide resequencing is feasible, this advantage is no longer key. EHH-based tests also allow detection of very recent selective sweeps (less than 400 generations ago) with more power than Tajima’s D or the MK test [61]. Tajima’s D can be used to detect selection that has occurred 40,000 to 280,000 generations ago [64], and the MK test can be used to detect older selective events that have occurred since speciation.
Examples
10%), including alleles associated with reduced activity [66]. However, the LRH test showed a significant signal of positive selection for a G6PD haplotype found in the African populations and not the European-American or Asian populations [61]. The G6PD haplotype that showed extended haplotype homozygosity is one with reduced enzymatic activity and causes acute hemolytic anemia. In malaria endemic regions, the same reduced activity G6PD A- alleles confer a reduced risk (50%) for severe malaria [67], likely due to the anemic red blood cells being toxic to the parasite. This suggests in malaria endemic regions, carrying deficient G6PD alleles is more advantageous than carrying the normal G6PD allele. Meanwhile, in non-malaria endemic regions, the reduced activity G6PD alleles have been removed from the populations due to its reduction in fitness.
Complex Disease Model Predictions
References
1. Corder EH, Saunders AM, Strittmatter WJ, Schmechel DE, Gaskell PC, et al. (1993) Gene dose of apolipoprotein E type 4 allele and the risk of Alzheimer's disease in late onset families. Science 261: 921-923.
2. Lander ES (1996) The new genomics: global views of biology. Science 274: 536-539. 3. Tomlinson IP, Bodmer WF (1995) The HLA system and the analysis of multifactorial
genetic disease. Trends Genet 11: 493-498.
4. Consortium IH (2003) The International HapMap Project. Nature 426: 789-796. 5. Consortium IH, Frazer KA, Ballinger DG, Cox DR, Hinds DA, et al. (2007) A second
generation human haplotype map of over 3.1 million SNPs. Nature 449: 851-861. 6. Chee M, Yang R, Hubbell E, Berno A, Huang XC, et al. (1996) Accessing genetic
information with high-density DNA arrays. Science 274: 610-614.
7. Jeffares DC, Pain A, Berry A, Cox AV, Stalker J, et al. (2007) Genome variation and evolution of the malaria parasite Plasmodium falciparum. Nat Genet 39: 120-125. 8. Mu J, Awadalla P, Duan J, McGee KM, Keebler J, et al. (2007) Genome-wide
variation and identification of vaccine targets in the Plasmodium falciparum genome. Nat Genet 39: 126-130.
9. Price AL, Patterson NJ, Plenge RM, Weinblatt ME, Shadick NA, et al. (2006) Principal components analysis corrects for stratification in genome-wide association studies. Nat Genet 38: 904-909.
10. Pritchard JK, Stephens M, Donnelly P (2000) Inference of population structure using multilocus genotype data. Genetics 155: 945-959.
11. Consortium WTCC (2007) Genome-wide association study of 14,000 cases of seven common diseases and 3,000 shared controls. Nature 447: 661-678.
12. Carlson CS, Eberle MA, Rieder MJ, Yi Q, Kruglyak L, et al. (2004) Selecting a maximally informative set of single-nucleotide polymorphisms for association analyses using linkage disequilibrium. Am J Hum Genet 74: 106-120.
14. Armitage P (1955) Tests for Linear Trends in Proportions and Frequencies. Biometrics 11: 375-386.
15. Storey JD, Tibshirani R (2003) Statistical significance for genomewide studies. Proc Natl Acad Sci USA 100: 9440-9445.
16. Gold B, Kirchhoff T, Stefanov S, Lautenberger J, Viale A, et al. (2008) Genome-wide association study provides evidence for a breast cancer risk locus at 6q22.33. Proc Natl Acad Sci USA 105: 4340-4345.
17. Hunter DJ, Kraft P, Jacobs KB, Cox DG, Yeager M, et al. (2007) A genome-wide association study identifies alleles in FGFR2 associated with risk of sporadic postmenopausal breast cancer. Nat Genet 39: 870-874.
18. Easton DF, Pooley KA, Dunning AM, Pharoah PD, Thompson D, et al. (2007) Genome-wide association study identifies novel breast cancer susceptibility loci. Nature 447: 1087-1093.
19. Thomas G, Jacobs KB, Kraft P, Yeager M, Wacholder S, et al. (2009) A multistage genome-wide association study in breast cancer identifies two new risk alleles at 1p11.2 and 14q24.1 (RAD51L1). Nat Genet 41: 579-584.
20. Wang K, Zhang H, Ma D, Bucan M, Glessner JT, et al. (2009) Common genetic variants on 5p14.1 associate with autism spectrum disorders. Nature 459: 528-533.
21. Weiss LA, Arking DE, Consortium GDPoJHtA, Daly MJ, Chakravarti A (2009) A genome-wide linkage and association scan reveals novel loci for autism. Nature 461: 802-808.
22. Shi J, Levinson DF, Duan J, Sanders AR, Zheng Y, et al. (2009) Common variants on chromosome 6p22.1 are associated with schizophrenia. Nature 460: 753-757. 23. Stefansson H, Ophoff RA, Steinberg S, Andreassen OA, Cichon S, et al. (2009)
Common variants conferring risk of schizophrenia. Nature 460: 744-747.
24. Consortium IS, Purcell SM, Wray NR, Stone JL, Visscher PM, et al. (2009) Common polygenic variation contributes to risk of schizophrenia and bipolar disorder. Nature 460: 748-752.
26. Jallow M, Teo Y, Small K, Rockett K, Deloukas P, et al. (2009) Genome-wide and fine-resolution association analysis of malaria in West Africa. Nat Genet. 27. Todd JA, Walker NM, Cooper JD, Smyth DJ, Downes K, et al. (2007) Robust
associations of four new chromosome regions from genome-wide analyses of type 1 diabetes. Nat Genet 39: 857-864.
28. Aranzana MaJ, Kim S, Zhao K, Bakker E, Horton M, et al. (2005) Genome-wide association mapping in Arabidopsis identifies previously known flowering time and pathogen resistance genes. PLoS Genet 1: e60.
29. Rostoks N, Mudie S, Cardle L, Russell J, Ramsay L, et al. (2005) Genome-wide SNP discovery and linkage analysis in barley based on genes responsive to abiotic stress. Mol Genet Genomics 274: 515-527.
30. Spencer CCA, Su Z, Donnelly P, Marchini J (2009) Designing genome-wide
association studies: sample size, power, imputation, and the choice of genotyping chip. PLoS Genet 5: e1000477.
31. Li M, Li C, Guan W (2008) Evaluation of coverage variation of SNP chips for genome-wide association studies. Eur J Hum Genet 16: 635-643.
32. Pritchard JK (2001) Are rare variants responsible for susceptibility to complex diseases? Am J Hum Genet 69: 124-137.
33. Xu B, Woodroffe A, Rodriguez-Murillo L, Roos JL, van Rensburg EJ, et al. (2009) Elucidating the genetic architecture of familial schizophrenia using rare copy number variant and linkage scans. Proc Natl Acad Sci U S A 106: 16746-16751. 34. Xu B, Roos JL, Levy S, Van Rensburg EJ, Gogos JA, et al. (2008) Strong association
of de novo copy number mutations with sporadic schizophrenia. Nat Genet 40: 880-885.
35. Feuk L, Carson AR, Scherer SW (2006) Structural variation in the human genome. Nat Rev Genet 7: 85-97.
36. Ahn SM, Kim TH, Lee S, Kim D, Ghang H, et al. (2009) The first Korean genome sequence and analysis: full genome sequencing for a socio-ethnic group. Genome Res 19: 1622-1629.
38. Li B, Leal SM (2008) Methods for detecting associations with rare variants for common diseases: application to analysis of sequence data. Am J Hum Genet 83: 311-321.
39. Cohen JC, Kiss RS, Pertsemlidis A, Marcel YL, McPherson R, et al. (2004) Multiple rare alleles contribute to low plasma levels of HDL cholesterol. Science 305: 869-872.
40. Stone EA, Sidow A (2005) Physicochemical constraint violation by missense substitutions mediates impairment of protein function and disease severity. Genome Res 15: 978-986.
41. Ng PC, Henikoff S (2001) Predicting deleterious amino acid substitutions. Genome Res 11: 863-874.
42. Ramensky V, Bork P, Sunyaev S (2002) Human non-synonymous SNPs: server and survey. Nucleic Acids Res 30: 3894-3900.
43. Cohen JC, Pertsemlidis A, Fahmi S, Esmail S, Vega GL, et al. (2006) Multiple rare variants in NPC1L1 associated with reduced sterol absorption and plasma low-density lipoprotein levels. Proc Natl Acad Sci U S A 103: 1810-1815.
44. Ji W, Foo JN, O'Roak BJ, Zhao H, Larson MG, et al. (2008) Rare independent mutations in renal salt handling genes contribute to blood pressure variation. Nat Genet 40: 592-599.
45. Roach JC, Glusman G, Smit AF, Huff CD, Hubley R, et al. (2010) Analysis of genetic inheritance in a family quartet by whole-genome sequencing. Science 328: 636-639.
46. Ng SB, Buckingham KJ, Lee C, Bigham AW, Tabor HK, et al. (2010) Exome sequencing identifies the cause of a mendelian disorder. Nat Genet 42: 30-35. 47. Mcpherson JD (2009) Next-generation gap. Nat Meth 6: S2-5.
48. Li B, Leal SM (2009) Discovery of rare variants via sequencing: implications for the design of complex trait association studies. PLoS Genet 5: e1000481.
49. Hartl DL, Clark AG (1997) Principles of population genetics. Sunderland, MA: Sinauer Associates. xiii, 542 p. p.
virus evolution within infected patients. Molecular Biology and Evolution 22: 456-468.
51. Boyko AR, Williamson SH, Indap AR, Degenhardt JD, Hernandez RD, et al. (2008) Assessing the evolutionary impact of amino acid mutations in the human genome. PLoS Genet 4: e1000083.
52. Tajima F (1989) Statistical method for testing the neutral mutation hypothesis by DNA polymorphism. Genetics 123: 585-595.
53. Stajich JE, Hahn MW (2005) Disentangling the effects of demography and selection in human history. Mol Biol Evol 22: 63-73.
54. McDonald JH, Kreitman M (1991) Adaptive protein evolution at the Adh locus in Drosophila. Nature 351: 652-654.
55. Parsch J, Zhang Z, Baines JF (2009) The influence of demography and weak
selection on the McDonald-Kreitman test: an empirical study in Drosophila. Mol Biol Evol 26: 691-698.
56. Smith NG, Eyre-Walker A (2002) Adaptive protein evolution in Drosophila. Nature 415: 1022-1024.
57. Fay JC, Wyckoff GJ, Wu CI (2001) Positive and negative selection on the human genome. Genetics 158: 1227-1234.
58. Bustamante CD, Nielsen R, Sawyer SA, Olsen KM, Purugganan MD, et al. (2002) The cost of inbreeding in Arabidopsis. Nature 416: 531-534.
59. Bustamante CD, Fledel-Alon A, Williamson S, Nielsen R, Hubisz MT, et al. (2005) Natural selection on protein-coding genes in the human genome. Nature 437: 1153-1157.
60. Barton NH (2000) Genetic hitchhiking. Philos Trans R Soc Lond B Biol Sci 355: 1553-1562.
61. Sabeti PC, Reich DE, Higgins JM, Levine HZP, Richter DJ, et al. (2002) Detecting recent positive selection in the human genome from haplotype structure. Nature 419: 832-837.
63. Sabeti PC, Varilly P, Fry B, Lohmueller J, Hostetter E, et al. (2007) Genome-wide detection and characterization of positive selection in human populations. Nature 449: 913-918.
64. Simonsen KL, Churchill GA, Aquadro CF (1995) Properties of statistical tests of neutrality for DNA polymorphism data. Genetics 141: 413-429.
65. Ruwende C, Hill A (1998) Glucose-6-phosphate dehydrogenase deficiency and malaria. J Mol Med 76: 581-588.
66. Verrelli BC, McDonald JH, Argyropoulos G, Destro-Bisol G, Froment A, et al. (2002) Evidence for balancing selection from nucleotide sequence analyses of human G6PD. Am J Hum Genet 71: 1112-1128.
67. Ruwende C, Khoo SC, Snow RW, Yates SN, Kwiatkowski D, et al. (1995) Natural selection of hemi- and heterozygotes for G6PD deficiency in Africa by resistance to severe malaria. Nature 376: 246-249.
68. Bassett AS, Bury A, Hodgkinson KA, Honer WG (1996) Reproductive fitness in familial schizophrenia. Schizophr Res 21: 151-160.
Chapter 2 Global Genome-wide Variation is Shaped by
Selection and Drug Resistance in the Agent of Malaria,
Plasmodium falciparum
Rachel A. Myers1,2, Kate M. McGee3, Jon Keebler1, Martine Zilversmit1, Gilean A. T. McVean4, Jianbing Mu5, Junhui Duan5, Xin-zhuan Su5,and Philip Awadalla1
1Ste. Justine Research Centre, Department of Pediatrics, University of Montreal, Montreal, CA, H3T 1C5. 2Bioinformatics Research Center, North Carolina State University, Raleigh, NC 27695-7614, USA. 3Laboratory of Experimental Immunology, National Cancer Institute-Frederick, Frederick, MD 21702, USA, 4Deparment of Statistics, University of Oxford, Oxford OX1 3TG, UK. 5Department of Biology, Laboratory of Malaria and Vector Research, National Institute of Allergy and Infectious Diseases, National Institutes of Health, 12735 Twinbrook Parkway, Rockville, MD 20850, USA.
Abstract
Plasmodium falciparum, the etiological agent of the most severe form of human malaria, kills more people than all inherited diseases combined. Little is known, however, about the distribution and diversity of mutations in the P. falciparum genome, either among populations or in specific regions of the genome. Here we show the extent to which immunity and/or drug associated selective pressures shapes these parasite genomes. Analyses of a resequencing and microsatellite survey of 99 parasite genomes from 3 continents reveals that the genome-wide rate of mutation for P. falciparum is low relative to other eukaryotes, however, a number of mutations and genes, particularly those associated with drug resistance, are contributing to local adaptation among continents. For example, almost all amino acid changes in genes involved in
genome, suggesting that these genes were subject to a form of balancing selection previous to the introduction of drugs and drug selective sweeps.
Author Summary
Many investigations of drug resistance and selection in malaria parasites have adopted candidate loci approaches with limited geographical sampling. Here we use a global sample of parasites with genome-wide variation to make inferences of selection and drug resistance association in P. falciparum, a causative agent of malaria. By
examining population structure, we evaluate the relationship of genotype and geography, make global and regional inferences of selection, and observe how response to selective pressures varies by continent using a wide range of population genetic tools. We observe a collection of haplotypes that have undergone continent specific selective sweeps.
Additionally, the population structure results were used as corrections in a drug resistance association study of cultured parasites to eliminate spurious associations caused by
population structure. The power of the association methods was evaluated in depth with simulated structured populations and experimental phenotypes. We also used two
Introduction
The deadly relationship between humans and Plasmodium falciparum has been a driving evolutionary force shaping genome composition in both species. Among
populations, this antagonistic evolutionary process is predicted to increase rates of local adaptation of the parasite to different host populations or environments [1]. Global parasite populations are exposed to varying levels of immune system or drug pressures and therefore may use a number of deterministic mechanisms to adapt to these new environments. Natural or artificial selection leaves signatures in genomes that may contribute to population specific adaptations and is useful for identifying new candidate targets for vaccines [2,3]. Allelic variation at alternative loci may be responsible for differences in susceptibility to different host environments. Identifying the extent to which distinct populations of parasites use differing means to evade immunity is critical to identifying new potential targets for vaccines or drugs, and in understanding how these populations may respond to drugs or vaccines.
unlikely to be the target of selection. Genotyping single nucleotide polymorphisms (SNPs) [for example 10,11] or probing single feature polymorphisms (SFPs) [3] are useful in capturing a genome-wide picture of variation. Ultimately, re-sequencing surveys of genomic variation is critical for capturing the fine-scale information necessary for making inferences about selection and demographic processes [11,12,13].
Determining the influence of selection on the evolution of the P. falciparum genome requires global approaches to analyzing patterns of coding variation. Currently, it is not known to what extent recent selection events, such as those associated with drug or immune evasion, are geographically restricted. For example, P. falciparum may evolve
differently among populations due either to, varying levels of drug exposure or variable transmission rates in different regions. Selection due to the evolution of drug resistance in parasites is of particular importance to medical science, and is a worldwide problem; reported failure rates for the historically effective treatment chloroquine in South America are 80%, 50% in East and Central Africa, and 40% in South-East Asia (World Malaria Report 2005).
resequencing results in conjunction with the previously published resequencing survey of transporter genes [14,15], a wide microsatellite survey [16], and the genome-wide resequencing survey of five isolates [13] in this analysis.
Results and Discussion
Population Mutation Rates and Inferences of Selection
A recent genome-wide SNP survey revealed the overall population mutation rate at coding regions for P. falciparum is small (2Nµ(2-s) = 0.0005 per nucleotide, where N
is the effective population size, µ is the per base mutation rate, and s is the fraction of the population produced by selfing [17]) relative to other organisms [13]. The high AT base composition (~80%) of P. falciparum has clearly played a significant role in limiting overall level of silent polymorphisms [18]. However, through surveys of polymorphism over large genomic regions from large numbers of parasites, we can draw some general and specific conclusions about the stochastic and deterministic forces shaping variation in P. falciparum.
segregating at < 5%. Other GO groups showed an excess of nonsynonymous substitutions between species consistent with adaptive evolution (Figure 2-1).
We inferred the genome-wide mutation rate and the deleterious mutation rate in coding regions, and asked what proportion of mutations is subject to positive selection [20,21]. All methods used to make these inferences make an assumption that silent mutations are neutral. The method of Bierne and Eyre-Walker [22] used the frequencies of silent and replacement polymorphisms within species, and similar counts between species (P. falciparum and P. reichenowi), to infer the proportion of amino acid
substitutions (%) that were adaptive. For P. falciparum chromosome 3 data, this quantity was not significantly different from zero (not shown), similar to calculations made for humans [23]. However, using polymorphisms discovered genome-wide by Mu et al. [13] and Jeffares et al. [12], which were well-validated and were grouped according to gene ontology, specific functional categories showed a significant signature of positive selection (Table 2-2). These categories included genes associated with host-pathogen interactions and electron transport. Genes coding for transporter proteins were of
particular interest because these proteins are known to be associated with drug resistance in a number of species including P. falciparum.
Simulations were conducted of the coalescent to assess significance using demographic parameters inferred by Joy et al. [6]. Specifically, p values for the Tajima’s D statistics for loci of parasites from Africa and South America were estimated based on 10,000 coalescent simulations of stationary population sizes conditioned on the number of segregating sites. Simulations of a population growth model were performed for comparisons to PNG and Asia Tajima’s D statistics [6].
The distribution of Tajima’s D values on the 3rd chromosome per gene varied spatially among populations (Table 2-3). Relative to other populations, Africa had a greater mean negative Tajima’s D across genes (Table 2-4), suggesting a higher proportion of rare or singleton SNPs, possibly due to population expansion. PNG had more heterogenous distribution, a number of genes showed the signature of either recent population-specific selective sweeps or balancing selection (Table 2-3). For example, a number of contiguous coding regions on chromosome 3 among African parasites (regions included loci PFC0175w to PFC0185w and PFC250c to PFC310c) had significantly negative Tajima’s D values, as would be expected for a local selective sweep in the region. Similarly, among Asian samples, a region at the 5’ end of the chromosome consisting of 3 loci (PFC0050c, PFC0060c, and PFC0075c) also had significantly negative Tajima’s D values. One locus was significantly positive in both Asia and PNG (PFC0505w).
increases in frequency very fast, and as a result is associated with an unusually long haplotype of low diversity. We have previously showed that LD and recombination rates vary among populations [10]. Therefore, a haplotype that is unusually long will standout
as a region subject to recent selection. To identify haplotypes that were unusually long, we calculated the integrated Haplotye Homozyougisty (iHH) for each SNP along
chromosome 3 [25]. Simulations were performed to identify outliers. We computed these statistics for all populations combined as well as separate. Haplotypes near the sub-telomeric regions stood out as having an excess iHH relative to the rest of the
chromosome where a number of potential antigen encoding genes reside [26]. The only other potential signature of a partial selective sweep was in Africa in a region spanning 197313 to 318121 bp that included loci PFC0185w through to PFC0310c. Interestingly, loci PFC0185w, PFC0195w, PFC0245c, PFC0295c, and PFC0310c also showed nominal associations with chloroquine and quinine resistance among African parasites (see below).
Geographic selection
differentiation (e.g. geographically restricted directional selection relative to neutrally evolving loci throughout the genome) [27,28,29,30]. To measure population
differentiation among sites for all four populations, we used a Bayesian method [31,32] that fits a statistical model of population structure related to FST, the coefficient of population differentiation. The model defined the difference of each population from a hypothetical average, or ancestral, population by a variance parameter cj for each
population j [31] (Table 2-5). This parameter was analogous to FST values, but instead of being limited to a single estimate of differentiation for a pair or group of populations, we have an estimate of the variance parameter for each population.
Synonymous, nonsynonymous, and transporter gene SNPs exhibited significantly different patterns of differentiation among populations. In Africa and in America (South and Central), nonsynonymous sites were significantly more differentiated than
to anti-malarial drugs, and we tested the assertion by examining genotype - drug response associations.
Population Structure and Associations with Drug Resistance
Previous association studies conducted in P. falciparum have used geographic locations as indicators of population structure and correct for the structure by conducting within continent or sampling location association tests [14]. This approach is sensitive to spurious associations due to recent migrants, admixed isolates, mislabeling, and other instances where geography is an inaccurate indicator of the population structure. We improved on these population structure corrections by using a new but widely used [for example 34,35,36,37,38,39] principal component analysis (PCA) approach. PCA was both a test for population structure and also a correction method, permitting isolates to have continuous mixtures of ancestry that are defined genetically, rather than having discrete populations defined by collection location. The power and Type 1 error of the PCA implementation EIGENSOFT [40,41] and a simple sequence repeat (SSR)
correction in the SNP data, and structure results for the SSR data, to detect statistical associations with in vitro drug resistance, measured as the concentration required for 50% inhibition of parasites (IC50).
revealed the method had sufficient power to detect associations and a conservative Type 1 error.
SSR polymorphism data traditionally has not been used in the association
framework and has the drawback of too much allelic diversity (relative to the number of samples), yet because SSRs were already available [16], we used them to also test for associations. We evaluated the performance of the SSR association test by examining the power and Type 1 error. The power to detect associations and Type 1 error of the SSR association method was estimated by simulating the largest sub-population, Africa, using the demographic parameters reported by Joy et al. [6]. Simcoal2 [45], a coalescent
genetic diversity simulator, was used to generate samples (40) of completely linked SSRs and SNPs. A single SNP was removed and used to assign resistant or susceptible
(EMMA) [46] differed from EIGENSOFT by modeling population structure as a random effect, meaning the observed population structure in the samples is a subset of the
naturally existing population structure. Conversely, EIGENSOFT modeled population structure as a fixed effect meaning the observed structure is a complete sampling of the naturally existing population structure. The resulting population structure correction used in EMMA was larger due the larger variance estimator of the random effect and yielded a more conservative test of genotype-phenotype association.
Population Structure in Global Samples of P. falciparum
proportion of Asian samples, genome-wide “mixing” or recombination was evident
among African (in red) and Asian (in yellow) samples. Also clear, was the assignment of
PNG samples to Africa. In this case, the PCA population structure correction provided an
advantage over using continental groupings for association studies; the admixed samples
having corrections according to all axes of ancestry, rather than a single population
assignment.
Drug Response Association
Drug resistance, a continuous trait, was measured as the concentration required
for 50% inhibition of the pathogens (IC50) for atovaquone-proguanil (Table 2-6),
chloroquine, and quinine. The latter two are described in Mu et al [14]. The SNP data
was analyzed using an implementation of PCA (EIGENSOFT [40,41]) for detecting and
controlling for population structure. The PCA revealed a clustering of chloroquine
susceptible (IC50 13.6-76.1 nM [14]) isolates (Figure 2-4) suggesting the population
structure may reflect differences in drug tolerance. To avoid population structure
corrections that were related to phenotype, the significant axes of variation were
evaluated for correlations with the drug phenotypes. Each population class (Global,
Africa, Asia, and America) was evaluated individually for population structure and
associations. The five significant axes of variation discussed in the population structure
analysis were used for corrections in the Global population; two significant axes of
structure correction in the Asian population, while the African and American populations had no principal component corrections due to phenotypic correlations. We detected 8 SNPs in two genes (Table 2-7), and 6 different SSR loci (Table 2-8), with significant
drug resistance associations after Bonferroni multiple testing corrections (% = 0.05). SNP and SSR drug resistance associations that were population specific may have evolved before or after population differentiation, perhaps in response to geographic differences in drug treatments over the past few decades.
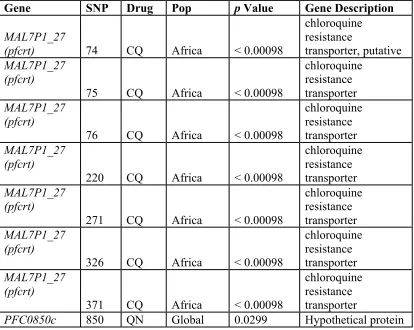
Two genes having SNPs in association with drug phenotypes using both EIGENSOFT (Table 2-7) and EMMA were MAL7P1.27, or the putative chloroquine
transporter (pfcrt), and a novel association with PFC0850c, a hypothetical protein. Polymorphisms in pfcrt have a well-documented role in chloroquine resistance
[14,48,49,50] and served as positive controls for the PCA association method. PFC0850c
was associated with quinine resistance at the global level and had nominal associations with both chloroquine and quinine in the AsiaPNG population. PFC0850c is orthologous
to an endonuclease/exonuclease/phosphatase of the rodent malaria parasite P. yoelii and other Plasmodium species. PFC0850c has not been previously reported to be involved in drug resistance. The previous analysis of variance of the transporter genes revealed
several significant associations [14]; only one gene was detected at the experiment-wide significance level in this study. This suggested the PCA and the EMMA correction
A population specific SSR association (Table 2-6) was found at marker C13M30
(p value = 0.034) on chromosome 7 (599.7-.9 kb, 40.3 cM), overlapping MAL7P1.50
encoding the erythrocyte membrane protein 1 (pfemp1), a cytoadherence protein expressed on the surface of infected red blood cells. Two novel associations included a
chromosome 7 marker, 7A11 (332.87 kb, 23.1 cM), within the gene PF07_0024,
(putatitive inositol phophatase) associated with chloroquine response (p value< 0.019). Also, two novel markers were identified on chromosome 4 to be in association with
atovaquone-proguanil resistance in Africa.
The Bonferroni multiple testing correction tends to be conservative, therefore we
also reported SNPs and SSRs with nominal p value< 0.05 in at least 2 of the 3
populations, or at the global level (Tables 2-9, 2-10, and 2-11 respectively). We observed
chloroquine resistance associated with multiple pfcrt SNPs in both the African and American populations, reflecting differences in chloroquine resistance segregation
between populations. The ABC transporter also showed a similar pattern of nominal
associations with chloroquine in Asia and America. SSR marker C4M39 on chromosome
4 (666.2 kb, 31.6 cM) had associations with quinine and atovaquone-proguanil in at least
2 populations. We also saw a collection of SNPs, including those in pfcrt and PFA0590w
(putative ABC transporter), had nominal associations with multiple drugs (chloroquine
and quinine). Sites that were associated with different drugs acting in opposing directions
(different alleles favorable for different drug resistances) may act to maintain variation
Selection at Drug Associated Loci
In the case of non-neutral phenotypes, association results may be considered jointly with selection. Selective sweeps can remove polymorphism, thus decrease the ability to detect associations. In contrast, balancing selection, which maintains
polymorphisms within or among populations, resulting in alleles with higher frequencies, increases power to detect associations with phenotypes. Genes that have SNPs in
association with drug phenotypes were tested for departure from neutrality using MLHKA [51], a maximum likelihood multi-locus extension of the HKA [52] test. Two models were tested; the alternative (selection) model that included two genes with SNP associations and pfmdr1 as targets of selection and the null (neutral) model where all genes were selectively neutral. The maximum likelihoods of both models were
P. falciparum exposure to drug treatment, and that the use of drugs caused a selective sweep in some populations. Even if different mutations or haplotypes confer resistance,
that variation had to be present for selection to act upon it. Similarly, hypothetical protein
PFC0850c had k values ranging from 6.9 to 20.8 suggesting variation was maintained. Conversely, previously identified pfmdr1 had k values that are all < 1, suggesting
diversity has been decreased, which is consistent with the reported selective sweep.
Linkage disequilibrium (LD) block (regions where D’ > 0.80) averaged range
from 11.2 kb in Africa to 53 kb in PNG [10]. Therefore non-neutrally evolving loci
within a 40 kb window of associated SSR loci were also of interest. Two such loci were
PFD0720w close to SSR marker C4M39 and PF14_0325 close to C14M115. PFD0720w
appeared to have a deficit of fixed nonsynonymous sites (inferred from the MK test),
suggesting selective constraint. The PF14_0325 gene had a surplus of fixed differences
suggesting positive selection.
Selective sweeps have previously been reported at pfcrt and dhfr (dihydrofolate
reductase), with varying strengths, at different geographical locations [16,53]. Nash et al.
[53] genotyped the pfcrt and dhfr loci in 130 parasites and showed losses of
heterozygosity in strains resistant to chloroquine, consistent with loci subject to selective
sweeps in a Southeast Asian population. Wootton et al. [16] evaluated genome-wide
allelic diversity in the SSR dataset, noting high allele sharing along chromosome 7 and
suggested that positive selection has occurred at pfcrt as separate events in the
selection in chloroquine resistance parasites. Similarly, we observed chromosome 7 SSR associations ~ 100 and ~ 130 kb from pfcrt. As well, we saw SSR associations ~90 kb from dhfr, comparable to the 98 kb hitchhiking range in the Laos population reported by Nash et al., and an MK signal of non-neutrality at PFD0720w, 20 kb from dhfr. This suggested the SSR associations were reflections of drug induced selective sweeps and linkage disequilibrium rather than functional associations.
Conclusions
We have shown that P. falciparum has been subject to multiple forms of selection. Widespread anti-malarial drug-treatment has had a strong impact on the P. falciparum genome as noted by high differentiation of transporters SNPs and SNPs associated with drugs [26,54,55,56]. We showed that with even limited sample size, we could detect both known and novel associations. The sample sizes for our association were no doubt small relative to other studies in humans due to the laborious nature of testing for drug associations in the laboratory. However, our laboratory IC50 measures were fairly reliable compared to tests in the field [57], where starting and ending estimates of parasite numbers could be more accurately characterized. Finally, another novel finding in this study was the high degree of variation observed at previously
Finally, from our analysis of just one chromosome, we have identified a number of genes potentially subject to alternative forms of recent and ancient selection and a novel drug resistance association. The genome was fairly conserved relative to other genomes. No doubt, there were a number of constraints due to the complex life history of this particular pathogen. However, analysis of this one chromosome suggested that potentially 5% of loci genome-wide were subject to some form of adaptive selection. Although mutation rates appeared to be low in malaria, estimates were consistent with similar calculations made for other eukaryotes with short generation times. Regardless, a small proportion of amino-acid substitutions allowed the parasite to adapt to the ever-changing host environments.
Acknowledgements
We thank Tim Anderson for comments on an earlier version of this manuscript and M. Ferdig for the work on atovaquone-proguanil IC50 at the NIAID. This work was