ABSTRACT
LOMBARDO, STEVEN MICHAEL. Phenological Characterization and Effects of
Environmental Attributes on River Herring Spawning Migrations within the Albemarle Sound Watershed. (Under the direction of Dr. Jeffrey A. Buckel).
River herring, the collective name for alewife (Alosa pseudoharengus) and blueback herring (Alosa aestivalis), are anadromous fishes that are at or near historically low levels of abundance throughout their distributions. Historically, river herring supported one of the largest fisheries in North America. A combination of commercial pressure directly on the spawning grounds, offshore bycatch, and habitat degradation contributed to the collapse of river herring populations. Despite efforts to recover river herring stocks, which includes moratoria, bycatch caps, dam removal, and habitat restoration, stocks still have yet to rebound. We identified the spawning migration process as a potential bottleneck for recovery as it is particularly sensitive to environmental conditions. Our study objectives were to 1) characterize variation in the timing and duration of river herring spawning migrations within the Albemarle Sound watershed over a four-decade period and 2) elucidate whether agriculture/silviculture and development within the riparian zone impede the ability of river herring to migrate upstream, identify which habitat attributes are the most important for determining the suitability of habitat, and explore whether culverts are acting as a barrier for upstream migration.
the migration in the 2010s, blueback herring are arriving 5 d earlier, the peak of the migration is 13 d earlier, the egress occurs 23 d earlier, and 18 d less are spent on the spawning grounds. We hypothesized age structure, abundance, or vernal warming to be potential drivers of the observed change in phenology. Water temperature data suggest that an increased vernal warming rate in recent decades (2000s & 2010s vs 1970s & 1980s), specifically in April and May, is driving earlier egress times for both species.
In order to look at the effects of agriculture/silviculture, urbanization, and water quality on the ability of river herring to migrate upstream, we again used NCDMF river herring
Phenological Characterization and Effects of Environmental Attributes on River Herring Spawning Migrations within the Albemarle Sound Watershed.
by
Steven Michael Lombardo
A thesis submitted to the Graduate Faculty of North Carolina State University
in partial fulfilment of the requirements for the degree of
Master of Science
Fisheries, Wildlife, and Conservation Biology
Raleigh, North Carolina 2018
APPROVED BY:
_______________________________ Dr. Jeffrey Buckel
Committee Chair
_______________________________ Dr. Ernest F. Hain
BIOGRAPHY
Steven Michael Lombardo was born on February 28, 1989 in Garfield Heights, Ohio. As a child, he was innately curious about nature and science in general; a trait his parents nurtured and urged him to pursue avidly. He attended Medina High School where he excelled in AP Biology and Chemistry. In 2007 he started working towards his bachelor’s degree at Cuyahoga Community College in Parma, Ohio. He transferred to the University of Akron in 2009 as a biology major. While at the University of Akron, he began to focus his studies on aquatic biology. He pursued coursework in freshwater ecology (Lavrentyev), wetlands ecology
While in Elizabeth City, he would take a full course load while collecting data that would be used in the two studies described below. After his field seasons, he would move to Morehead City, NC where he would continue coursework, work on analyses, presentations, and writing. The research and coursework completed throughout his time at NC State University has
ACKNOWLEDGEMENTS
First and foremost, I’d like to thank my parents and sisters, Steve, Ellen, Andrea and Marie, for supporting me and motivating me to pursue my dreams. Without you I wouldn’t be who I am today and wouldn’t have had the courage to dive into the unknown. You four mean the world to me.
Thank you to Dr. Jeff Buckel, for giving me a chance to work with you. I am forever grateful that you took a chance on me and have helped me through all of the uncertainty and challenges that have come along throughout this project. To Dr. Ernie Hain and Dr. Emily Griffith, thank you both for your guidance, support, and wisdom. You were integral in navigating the nuances of such a large dataset and determining the best ways to answer the questions laid out before us.
Thank you to Milo Page, Eugene Cheung, and Elsita Kiekebusch, who were there for my first days at NC State University. We struggled together, we grew together, and we succeeded together. I am proud to call you friends for life.
To Brendan Runde, Paul Rudershausen, and Jacob Krause. I can’t find the words to show my gratitude for all of the help and guidance you all have given me over the years. While that means a lot to me, your friendship has meant the world. Whether it’s school, work, fishing, or family, you guys are always there to help, give advice, and share your experiences. You three have helped me grow so much as a professional and an individual. I cherish all the memories we shared together and will tell those stories for the rest of my life.
have met you all. Thank you Holly White, Cynthia Roundtree, Christina Carter, Chris Kelly, Greg Reger, Amanda Adams, Tracy McMillan, Robert Corbett, Mike Loeffler, Corrin Flora, Sean Darsee, Ted Rieman, Charlton Godwin, Ms. Kim, and all of the NCDMF employees that participated in river herring sampling since the inception of the program. Also, thank you to Herbert and Bobby Byrum for their kindness, insight into the history of the river herring fishery, and allowing me to join in fishing the Chowan River pound nets.
I would also like to thank Susan Marschalk, Marlu Bolton, Linda Dunn, Dawn Newkirk, Freha Legoas, Carrie Baum-Lane, and Brooke Clemmons for providing administrative support. Your collective expertise, dedication, and genuine concern for each individual student is greatly appreciated.
TABLE OF CONTENTS
LIST OF TABLES ... vii
LIST OF FIGURES ... ix
CHAPTER 1: Evidence for Temperature-Dependent Shifts in Spawning Times of Anadromous Alewife (Alosa pseudoharengus) and Blueback Herring (Alosa aestivalis) ... 1
Abstract ... 1
Introduction ... 2
Methods ... 4
Results ... 11
Discussion ... 14
References ... 21
Tables ... 29
Figures ... 32
CHAPTER 2: Examining the Influence of Anthropogenic Riparian Zone Land Cover on River Herring Catch within the Albemarle Sound Watershed, NC ... 39
Abstract ... 39
Introduction ... 40
Methods ... 44
Results ... 48
Discussion ... 54
References ... 60
Tables ... 68
LIST OF TABLES CHAPTER 1
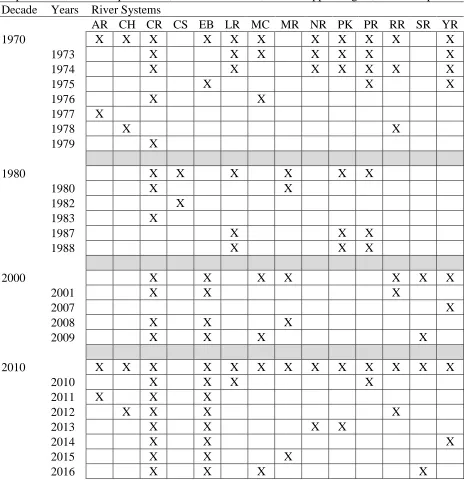
Table 1. NC Division of Marine Fisheries river herring spawning habitat survey sampling history. Sampling was conducted within the tributaries and
drainage areas of the listed rivers, creeks, or bays ... 29 Table 2. Model selection for the generalized additive models for alewife (Alosa
pseudoharengus) and blueback herring (Alosa aestivalis) in the
Albemarle Sound, North Carolina watershed, 1973 – 2016 ... 30 Table 3. Logistic GAM-derived migration metrics for alewife and blueback herring
spawning in the Albemarle Sound, NC watershed. Metrics are ingress (5% probability of presence on left hand side of the distribution), egress, peak (maximum presence probability in a unimodal curve or mean day of maximum presence probabilities in bimodal/plateaued curve), and season length estimations (differences between ingress and egress). Some temporal comparisons within and across decades use extrapolated predictions. Predictions influenced by extrapolation are denoted with *. Conservative estimates based upon the first presence and last presence are given in brackets. The 95% confidence interval is give in
parenthesis ... 31 CHAPTER 2
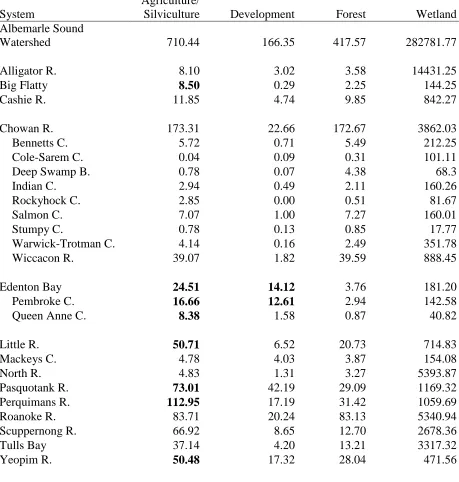
Table 1. Land cover classifications delineated by NOAA were grouped into four general land cover groups. Acreage of each classification is given for the cumulative sampling area (Albemarle Sound Watershed) and all of the drainage areas that it is comprised of. Anthropogenic alterations of > 5%
of the within system riparian zone acreage are in bold ... 68 Table 2. Model selection for the generalized additive models for alewife (Alosa
pseudoharengus) and blueback herring (Alosa aestivalis) within the Albemarle Sound, North Carolina watershed, 2007 – 2016. Models were assessed using Akaike Information Criterion (AIC), weighted AIC (AICw), and percent deviance explained. The most parsimonious model is
highlighted ... 69 Table 3. Model selection for the generalized additive models for alewife (Alosa
pseudoharengus) and blueback herring (Alosa aestivalis) in the Chowan River system and Edenton Bay watershed, 2008 – 2016. Models were assessed using Akaike Information Criterion (AIC), weighted AIC (AICw), and percent deviance explained. The most parsimonious model is
Table 4. Culvert passability was assessed using NCDMF river herring spawning habitat survey data from 1973 – 2017. Culvert categories: 1 – Passable (catches at the downstream side and immediate upstream or next upstream sample station), 2 – Unpassable (catches at the downstream side but not immediately upstream), 3 – Potentially unpassable (river herring caught at downstream side, but not at next upstream station (no sampling
immediately upstream of culvert), 4 – Reached but unknown (catches at the downstream side, but no upstream sampling occurred), 5 – Unreached (no catches at downstream side), 6 – Unknown (one culvert was sampled
LIST OF FIGURES CHAPTER 1
Figure 1. The North Carolina Division of Marine Fisheries river herring spawning habitat survey has been conducted from 1973 – 2016 and has sampled at 325 locations throughout the Albemarle Sound, North Carolina
watershed ... 32 Figure 2. The timing and length of the North Carolina Division of Marine Fisheries
river herring spawning habitat survey have fluctuated across decades. The span of the first and last detections for alewife and blueback are plotted to
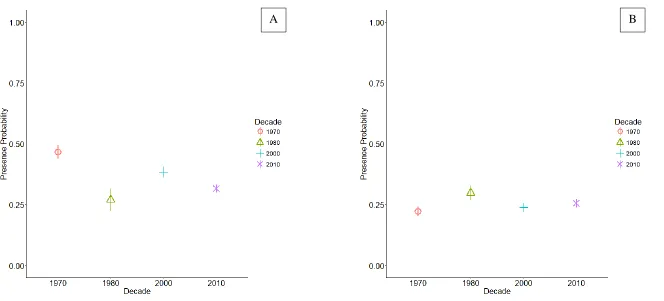
show the sampling coverage for the river herring run ... 33 Figure 3. Logistic GAM-derived predictions of (A) alewife presence probability and
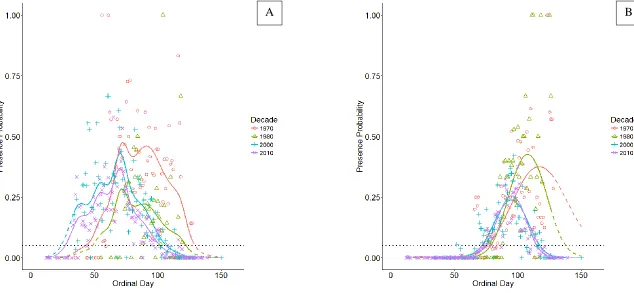
(B) blueback herring presence probability across decades. Probabilities were modeled using ordinal day, decade, distance proportion, and ordinal day * decade for samples collected in the NC Division of Marine Fisheries river herring spawning habitat survey throughout the Albemarle Sound, NC watershed. 95% CI indicated by vertical line ... 34 Figure 4. Logistic GAM-derived predictions of (A) alewife and (B) blueback herring
presence probability. Solid curves are model predictions from dates sampled, dotted curves are extrapolated predictions. Probabilities were modeled using ordinal day, decade, distance proportion, and ordinal day * decade for samples collected in the NC Division of Marine Fisheries river herring spawning habitat survey throughout the Albemarle Sound, NC watershed. Points represent the raw proportion of presences for all nets set on each day of the decade. Black horizontal line at 5% for estimates of
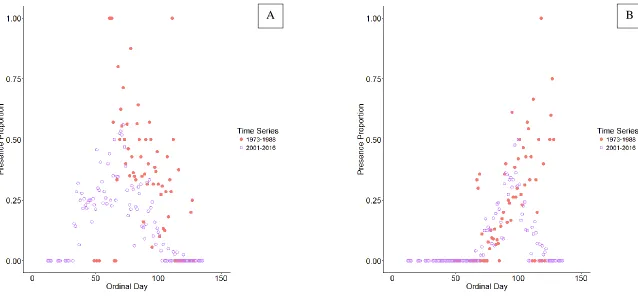
ingress and egress ... 35 Figure 5. Presence proportions for (A) alewife and (B) blueback herring at 30
sampling locations regularly sampled across four decades of NCDMF river herring sampling. Proportions are calculated from samples taken on any
given day within the early (1973 – 1988) or late (2001 – 2016) time periods ... 36 Figure 6. Water temperature data for 30 stations regularly sampled throughout four
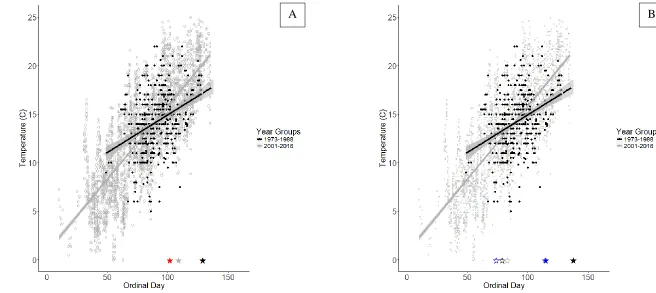
herring). The predicted egress dates from the 2010s phenology model are plotted for alewife (solid red star; day 102) and blueback herring (solid blue star; day 115). Blueback herring ingress was also examined using the same approach described for egress (see open stars). The 1973-1988 temperature on the date of ingress (day 79; open black star) in the 80s was 13.3 C; that temperature gave an estimate of ingress based on the 2001-2016 temperature data of day 83 (open gray star) and was similar in time to the model-predicted ingress date (open blue star; day 74). The gray
shading represents the 95% CI ... 37 Figure 7. Age distribution of alewife and blueback herring caught from 1973 to 2010
in the NC Division of Marine Fisheries river herring spawning habitat survey, Albemarle Sound, North Carolina watershed. Box lower and upper limits represent the interquartile range (IQR) of ages, median age is
indicated by the thick black line, tails are 1.5 * IQR, dots are outliers.
*Aging data for the 2010 decade was limited to 2010 ... 38 CHAPTER 2
Figure 1. Summary of riparian zone land cover areas for the migration paths taken to reach each of the 236 sample stations. Wetlands dominate the riparian
zone throughout the Albemarle Sound watershed ... 73 Figure 2. Logistic GAM-derived effects of year, water temperature, DO, pH, depth,
distance proportion, proportion of agriculture/silviculture land cover in the riparian zone, and proportion of developed land cover in the riparian zone on the presence of alewife in the Albemarle Sound watershed. Dashed lines indicated the 95% CI. Tick marks on the x axis represent sampling
intensity ... 74 Figure 3. Logistic GAM-derived effects of proportion of agriculture/silviculture land
cover in the riparian zone, and proportion of developed land cover in the riparian zone on the presence of alewife in the Chowan River and Edenton Bay. Dashed lines indicated the 95% CI. Tick marks on the x axis
represent sampling intensity ... 79 Figure 4. Logistic GAM-derived effects of year, water temperature, DO, pH, depth,
distance proportion, proportion of agriculture/silviculture land cover in the riparian zone, and proportion of developed land cover in the riparian zone on the presence of blueback herring in the Albemarle Sound watershed. Dashed lines indicated the 95% CI. Tick marks on the x axis represent
sampling intensity ... 80 Figure 5. Logistic GAM-derived effects of proportion of agriculture/silviculture land
riparian zone on the presence of blueback herring in the Chowan River and Edenton Bay. Dashed lines indicated the 95% CI. Tick marks on the x
axis represent sampling intensity ... 85 Figure 6. Map of culverts sampled by the NCDMF within the Albemarle Sound
CHAPTER 1
Evidence for Temperature-Dependent Shifts in Spawning Times of Anadromous Alewife (Alosa pseudoharengus) and Blueback Herring (Alosa aestivalis)
Abstract
1. Introduction
Phenology is the study of seasonal or cyclical biological processes and how they are influenced by climate, environment, and species interactions. Plants and animals alike rely upon external stimuli to optimize the timing of migrations, blooms, molts, and reproduction (Newton 1966; White et al. 1997; Sherry et al. 2006; Miller-Rushing 2008). Climate change has disrupted the natural timing of such biological processes for many species through intensified rates of warming, prolonged seasons of precipitation or drought, amplification of weather events, and cascading effects through trophic interactions (Cushing 1990; Zhang et al. 2005; Prieto et al. 2008; Richardson et al. 2013; Asch 2015). A species’ ability to adapt their behavior to rapid environmental changes is imperative to ensuring the survival of oneself and their progeny.
River herring, the collective name for alewife (Alosa pseudoharengus) and blueback herring (Alosa aestivalis), are anadromous fishes that are at historically low levels of abundance (Hightower et al. 1996; ASMFC 2012, ASMFC 2017). River herring once supported large fisheries along the North American Atlantic coast from Nova Scotia down to the St. John’s River, FL (Jackson 1944; Watts 2003; Hightower 2004). Declines in river herring stocks have been attributed to overfishing (Hightower et al. 1996), offshore bycatch (ASMFC 2012;
Bethoney et al. 2013; Cournane et al. 2013), and loss of spawning habitat due to obstructions and degradation (Collier & Odom 1989; Hall et al. 2010). Attempts to ameliorate the population decline include moratoria, offshore by-catch caps, offshore spatial/temporal closures in the Atlantic herring (Clupea harengus) and mackerel (Scomber scombrus) fisheries, and dam
removal, all of which have been ineffective at recovering stocks (Hightower et al. 2004; ASMFC 2012; Bethoney et al. 2013; Cournane et al. 2013). While the decline of river herring was likely caused by a combination of fishing pressures and habitat loss, the continued depression of population levels may result from other ecological mechanisms, including climatological phenomenon.
2. Methods
2.1. Study Location and Monitoring
The river herring spawning habitat survey has been conducted by the North Carolina Division of Marine Fisheries (NCDMF) since spring of 1973. The goal of the survey is to identify the annual extent of stream habitats used by both alewife and blueback herring for spawning in eight river systems and their associated tributaries that feed into the Albemarle Sound. Sampling for river herring was intermittent in years between 1973 and 2001 but has been annual since 2007 (See Table 1 for sampling summary; Figure 1 for sampling stations).
Although only 24 of the possible 43 years were sampled, sampling occurred in at least four years per decade in all decades with the exception of the 1990s (only one year of sampling). Prior to 2007, sampling was conducted at randomly selected stations throughout the Albemarle Sound watershed with varied spatial and temporal extents. Beginning with 2008, the methods were standardized to sample the entirety of the river herring spawning run within the Chowan River and Edenton Bay watershed plus at least one of twelve additional Albemarle Sound river systems on a rotating basis. Additional systems were sampled if travel time to and from sampling
stations was not limiting. In 2007, the sampling design changed from random sampling to sampling that tracked the migration progress of river herring through the watershed. Beginning in 2012, sample stations located at the nearest road crossing to the mouths of five Chowan River tributaries became fixed sampling stations that are sampled each week throughout the entire river herring spawning season.
standardized, providing more consistent use of bar mesh sizes of 1.38 in. during the alewife run and 1.25 in. during the blueback herring run. Net lengths were also restricted to 5, 8, and 10 yards for staked gillnets, 5, 8, 10, 20, and 30 yd for floating gillnets, fished at a maximum depth of 2.1 m where possible. Staked gillnets were stretched across the channel width on the effluent side of the furthest downstream bridge or culvert and moved upstream to the next road crossing when running ripe females were encountered. Navigable waterways were sampled with gillnet lengths that left watercraft passage uninterrupted; detection probability for these sets was assumed similar to across channel sets. Gillnets were set on Mondays, checked every 24 hours, and removed over weekends and holidays due to logistical constraints. Water surface
temperature, air temperature, pH, salinity, conductivity, and DO were taken at each sampling station upon net inspection.
Sampling ceased when catches of blueback herring in the NCDMF Chowan River pound-net survey, conducted in the main stem of the Chowan River, became sporadic (<10 fish per week). The end dates ranged from April 29th to May 30th, with a median end date of May 9th.
2.2. Analysis
Studies on anadromous fish migrations characterize the phenology of the migration by identifying the initiation, peak, and completion (Quinn & Adams 1996; Juanes et al. 2004; Ellis & Vokoun 2009; Kennedy & Crozier 2010). Migration progress is typically delineated by identifying the day of the year that 25%, 50%, and 75% of yearly abundance is observed as reference points for the initiation, peak, and completion of the migration (Antonsson & Gudjonsson 2002; Kennedy & Crozier 2010; Otero et al. 2014). However, 5% of the run abundance has been used to identify the initiation of alewife spawning migrations in New England (Ellis and Vokoun 2009) and the Chesapeake Bay (Ogburn et al. 2017). Due to the variability in gill net sizes and amount of stream width covered by gill nets at each sampling location, we concluded that abundance data were not a good indicator of river herring phenology. Therefore, we used presence/absence data to characterize the phenology of river herring
spawning.
We used generalized additive models (GAMs) with a logit link and a binomial
shrinkage parameters allows for non-significant variables to be removed from the model by reducing the splined term to zero (Wood 2006). Environmental (surface temperature, DO, pH, conductivity, upstream distance) and temporal (ordinal day and decade) variables were screened for correlation and brought into the models a priori based upon knowledge of the environmental cues that river herring use to initiate migratory behavior and inspection of plots of river herring presence probability and potential variables. Because of correlation with ordinal day, we dropped water quality parameters and retained ordinal day.
established. For instances where this condition is not met, a conservative estimation of ingress can be given as the first detection of presence (or earlier) and egress as the last detection of presence (or later). Additionally, the changes in experimental design in 2007 could lead to changes in spatial coverage of the survey in recent years. Because the presence of river herring can change with distance upstream, we accounted for variability in the distance upstream that samples were taken. Distances from the mouth of the river systems to the sample stations were measured using ArcMap (ESRI, Redlands, CA) and the USGS National Hydrography Dataset (NHD) (U.S. Geological Survey 2013). Upstream distances ranged from 101 to 188,478 meters. Spatial variation was accounted for by creating a proportion; the distance between the tributary mouth and each sample station to the maximum distance a river herring was observed in the tributary (hereafter referred to as distance proportion).
Although we used distance proportion as a variable to correct for any changes in
sampling design over the decades, the variability in sampling locations during the spawning run (i.e. from changing sampling protocol in 2007) was a source of uncertainty in modelling
phenology with the complete dataset. The trends in presence at a subset of sample stations, created to reduce the spatial variability in sampling, was examined to evaluate whether any temporal changes in presence predicted by our models were still observed when spatial
models similar to those created with the full dataset. The criteria used resulted in a subset of 30 sample stations.
Trends in daily presence (present = 1 or absent = 0) at the sampling event level for the 1970s (1973 to 1979), 1980s (1980, 1982, 1983, 1987, 1988), 2000s (2001 & 2007 to 2009), and 2010s (2010 to 2016) were modeled separately for alewife and blueback herring. The variables included in the models were distance proportion, ordinal day, decade, and the ordinal day and decade interaction.
Final variable selection and model fitting using restricted maximum likelihood (REML) was done within the R package MGCV (Wood 2011). Models were constructed with variables having associated smoothers, no smoothers (linear predictor), and tensor product interaction smooths with the interaction and main effects. Interactions were constructed with tensor product interaction smooths which are more stable and interpretable than using full tensor product
smooths that remove the main effects (Wood 2017). The basis dimensions (k), which control the number of basis functions and sets the maximum degrees of freedom for smooth terms in the model, were evaluated using the gam.check() function from the R package MGCV. The basis dimensions were adjusted until the effective degrees of freedom were sufficiently different from k' (k -1). Akaike’s Information Criterion (AIC) was used to select the model with the best fit and fewest degrees of freedom (Burnham & Anderson 2002). Percent deviance explained was calculated by subtracting the model deviance from the null deviance then dividing by the null deviance and multiplying the result by one-hundred (Stoner et al. 2001).
cut-offs from 0 to 1, then plots the true positive fraction against the false positive fraction (Fielding & Bell 1997; Pearce & Ferrier 2000; Brotons et al. 2004). The area under the curve (AUC) is a measure of model performance, where an AUC = 0.5 yields the same predictive capacity as chance, AUC = 0.7 – 0.8 is acceptable, AUC = 0.8 – 0.9 is excellent, and AUC = 0.9 – 1 is outstanding (Hosmer & Lemeshow 2000; Mandrekar 2010).
Model predictions were used to estimate three spawning migration reference points. These were: (1) initiation of ingress at 5% presence probability (herein referred to as ingress), (2) peak presence probability, and (3) completion of egress at 5% presence probability (herein referred to as egress). Where no single, clearly defined peak existed (i.e. a plateau or bimodal curve), the mean day along the plateau or between the peaks was designated as the peak
spawning day for that decade. Conservative estimates of ingress or egress, equivalent to the first and last date of detection, are also given when the beginning or end of the spawning migration was not observed (presence probability ≮5%) and predictions are extrapolated >1 d. Confidence intervals were established for ingress, peak (unimodal), and egress using the presence probability CIs for the preceding and following ordinal days.
Temperature can be a particularly strong driver in movement of anadromous fishes (Antonsson & Gudjonsson 2002; Ellis & Vokoun 2009; Kennedy & Crozier 2010). We used associated water temperature data to explore temperature relationships with our modeled
ingress and egress comparisons. Water temperature data in the early decades did not cover the alewife ingress, so comparisons were made only for alewife egress and blueback herring ingress and egress. Using the model predicted ingress and egress days for each species in the earliest decade estimated with the least additional uncertainty from extrapolation, we calculated the temperature estimated by the early temperature linear model. We then compared the day that the early temperature occurred with the day that temperature occurred in the late decades. The day the temperature occurred in the late decade was then compared to the ingress and egress days predicted by the phenology models.
3. Results
Over the 43-year time period (1973 – 2016), there were 12,839 sampling events made at 325 sample stations (see Figure 1 for stations). A total of 2,241 alewife (17.5% catch rate) and 1,295 blueback herring (10.1%) were captured. There was a general trend of decreasing
presence probabilities over the sampling time period for alewife, and a slightly positive trend for blueback herring (Figure 3). Alewife presence probability was highest in the 1970s, lowest in the 1980s, and remains at probability substantially lower than the 1970s. Blueback herring presence probability was lowest in the 1970s, highest in the 1980s, and remains slightly higher probability than the 1970s.
3.1 Alewife Phenology
spawning grounds (Table 3; Figure 4A). The changes are evident even with estimations based upon the first and last presences. In the 1970s, estimated alewife ingress (5% presence
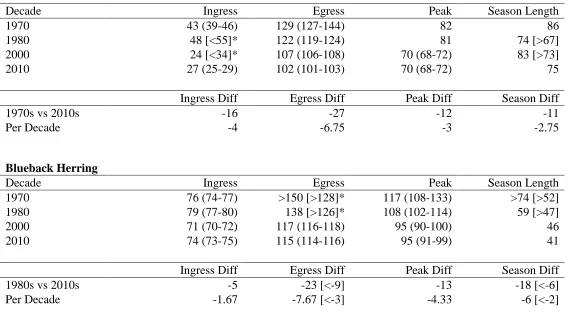
probability) was February 12, peaked at March 23, and completed their time on spawning ground by May 9 (egress estimate extrapolated one day). In the 2010s, these three dates were January 27, March 11, and April 12. The mean change in migration ingress and egress was -4 d per decade and -6.75 d per decade, with net-changes of -16 d and -27 d, respectively. The
imbalanced shift in ingress and egress has reduced the time that the alewife population spent on the spawning grounds by -11 d. The date of peak catch probability occurred 12 d earlier over the four-decade time period.
The proportion of alewife presence detections at a subset of 30 sample stations that were consistently sampled in the early decades (1970s and 1980s) and late decades (2000s and 2010s) corroborate the modeled phenological changes (Figure 5A). During ingress time periods in the early decades (around day 43), presence proportions were much greater in the later decades. During the egress time periods in the early decades (around day 129), presence proportions were zero or near-zero in the later decades and substantially lower than the presence proportions in the early decades. Thus, changes in sampling design between the early and late decades does not explain the changes in phenology of alewife spawning.
3.2 Blueback Herring Phenology
extrapolation could not be done for the egress period. However, egress was captured by extrapolation in the 1980s, and decadal comparisons can be made for all 1980s migration metrics. In the 1980s, blueback herring arrived at March 20, peaked at April 18, and completed their spawning migration by May 18. In the 2010s, these three dates were March 15, April 5, and April 25. The mean change in migration ingress and egress was -1.67 d per decade and ~-7.67 d per decade, respectively. The date of peak catch probability occurred 13 d earlier over the three-decade time period.
As with alewife, the proportion of blueback herring presence detections at the subset of 30 stations were examined and also corroborate the phenology model (Figure 5B). During ingress time periods in the early decades (around day 79), presence proportions were marginally greater in the later decades. During the egress time periods in the early decades (around day 138), presence proportions were much lower or zero in the later decades compared to the higher and non-zero presence proportions in the early decades. Thus, changes in sampling design between the early and late decades do not explain the changes in phenology of blueback herring spawning.
3.3 Effects of vernal warming rate on phenological shifts
from day 88 (March 29, at 14.0 C) onward. Elevated temperatures, or faster warming, from March 29 onward may be responsible for expediting the egress of both alewife and blueback herring. The alewife phenology model predicted a 1970s egress date of May 9 (day 129). The egress associated water temperature estimated on this date by the 1973 – 1988 regression was 17.2 C, which occurs on April 19 (day 109) in the 2001 – 2016 regression. The alewife phenology model predicts a 2010s egress date of April 12 (day 102) that is only seven days earlier than the estimate based on egress temperature. The blueback herring phenology model predicted a 1980s ingress date of March 20 (day 79). The ingress associated water temperature estimated on this date by the 1973 – 1988 regression was 13.3 C, which occurs on March 24 (day 83) in the 2001 – 2016 regression. The blueback herring phenology model predicts a 2010s ingress date of March 15 (day 74). Although this represents a difference of 9 days, it is
important to point out the similarities in dates for 13.3 C water in the two time periods (March 20 for 1973 – 1988 and March 24 for 2001 – 2016) and the similarities in dates for ingress
predictions (March 20 in the 1980s vs March 15 in the 2010s). The blueback herring phenology model predicted a 1980s egress date of May 18 (day 138). The egress associated water
temperature estimated on this date by the 1973 – 1988 regression was 17.9 C, which occurs on April 24 (day 114) in the 2001 – 2016 regression. The blueback herring phenology model predicts a 2010s egress date of April 25 (day 115) that is only one day later than the estimation using egress temperature.
4. Discussion
Our analysis of river herring spawning migration phenology within the Albemarle Sound, North Carolina watershed found substantial shifts to earlier spawn times for both species. Our results are consistent with trends observed in other anadromous populations: southern New England alewife (Ellis & Vokoun 2009), Atlantic salmon (Salmo salar) (Juanes et al. 2004), and Pacific salmonids (Oncorhynchus sp.) (Kovach et al 2015), and Chesapeake Bay striped bass (Peer & Miller 2014). Similar to our work, Peer and Miller (2014) observed earlier shifts in spawning migration metrics (ingress, peak, and egress) of 800-899-mm female Chesapeake Bay striped bass, which share a spawning season with Albemarle Sound river herring. From 1991 to 2010, the striped bass arrived, peaked, and left 5, 6, and 14 days earlier. Shifts in the timing of anadromous spawning events can have cascading negative effects, such as trophic mismatches that have substantial impacts on the survival of offspring, nutrient influx, and especially food web dynamics in the case of forage fish such as river herring (Cushing 1990; Yako et al. 2000; Durant et al. 2007; Walters et al. 2009; Fortier & Gagné 2011). From the river herring
perspective, the potential for negative effects on recruitment caused by a reduction in time where habitat conditions are suitable for spawning or the creation of trophic mismatches for early life history stages warrants future research.
Changes in migration and spawning phenology across animal classes have been attributed to shifts in environmental cues due to climate change (Quinn & Adams 1996; Ellis & Vokoun 2009), changes in species abundance (Miller-Rushing et al. 2008), and changes in age structure (Lambert 1987; Hutchings & Myers 1993; Trippel & Morgan 1994). We examine the possibility for each of these for alewife and blueback herring in the Albemarle Sound watershed.
another clupeid species, Atlantic herring, in both the Atlantic and Pacific stocks. Lambert’s observations led to the conclusion that larger, older fish arrived on the spawning grounds earlier than their smaller, younger conspecifics. It’s not unreasonable to believe that the relationship between age-length and the timing of arrival upon the spawning grounds found in this
confamilial apply to both alewife and blueback herring as well. The phenomenon has also been found in other anadromous species (Peer & Miller 2014). Thus, any shift towards an older age structure should manifest itself in earlier spawning migration times. However, we saw no change in alewife age structure (Figure 7). For blueback herring, there was a trend towards a younger age structure in recent decades which is opposite of the pattern that might explain earlier spawning. Thus, we conclude that changes in age structure are not responsible for changes in river herring spawn times within the Albemarle Sound watershed.
cannot disentangle these two variables. We recommend research on the effects of abundance on spawning phenology in anadromous fishes.
Water temperature has repeatedly been identified as having influence on spawning and migration timing for many anadromous species: striped bass (Peer & Miller 2014), Atlantic salmon (Juanes et al. 2004), American shad (Alosa sapidissima) (Quinn & Adams 1996), lake sturgeon (Acipenser fulvescens) (Bruch and Binkowski 2002), as well as alewife (Ellis & Vokoun 2009; Ogburn et al. 2017) and blueback herring (Ogburn et al. 2017). Temperatures within the coastal mid-Atlantic region of the United States have been increasing over the past century (Polsky et al. 2000s), with particularly larger changes observed in lower order streams (Ding & Elmore 2015) such as those used by river herring as spawning habitat. Our results suggest that an increased rate of warming within the tributaries of the Albemarle Sound in late spring is driving both river herring species towards earlier departures during their spawning seasons, a trend that has been observed in southern New England streams (Ellis & Vokoun 2009). The strongest evidence for this is that the temporal shift in egress dates predicted by the phenology models are similar to the changes in dates in which egress associated temperatures are reached. For alewife, the temperature-predicted and observed egress (from model estimate) dates were earlier and only seven days apart; they were also earlier and only one day apart for blueback herring egress.
appear to coincide with water temperatures near 17 C. As the vernal warming rate increases over time, water temperatures on river herring spawning grounds will reach 17 C sooner and continue to shorten the spawning season. Climate change driven shifts in phenology have been shown to negatively impact reproduction success and recruitment (Both et al. 2006; Watanuki et al. 2009). For river herring spawning within the Albemarle Sound watershed, shifts towards earlier egress dates, coupled with unequal changes in ingress, has reduced time on the spawning grounds and may be negatively impact spawning success, recruitment, and ultimately recovery.
presence/absence data is a viable proxy for abundance-based estimations of phenology. We encourage further examination of other long-term datasets for signals in shifting phenology using presence/absence data when abundance data cannot be used.
4.3 Implications
Researchers and fisheries managers have started to advocate for the incorporation of climate change effects and changes in phenology into their management strategies (Paukert et al. 2017). Management strategies for river herring so far have focused on the effects of increased fishing efforts and have attempted to mitigate historical overfishing through moratoria. While moratoria provide a significant reduction in fishing mortality, it may not be sufficient to return stocks to historical levels of abundance in the face of warming waters and changing climate. Current river herring stocks in North Carolina and other Atlantic states remain in a depressed state (White et al. 2017). We recommend future research test for the relationship between spawning migration time and recruitment.
If spawn timing is found to impact recruitment, state and federal management of river herring, and potentially other clupeid species, will need to account for shifts in spawning phenology and reductions in spawning season length when establishing commercial and
Carolina within the Albemarle Sound watershed, may reduce solar insolation and thus temper the rate of warming for sensitive shallow, higher order streams. A review by Moore et al. (2005) reported that the effects of riparian zone deforestation, namely stream temperature regimes, can take as long as 10 years to recover, with many of the studies showing no recovery over their durations. The dominate anthropogenic influence on the Albemarle Sound watershed landscape is agriculture and silviculture, which may encroach upon important riparian zone habitat. The influence of anthropogenic activities within the Albemarle Sound watershed and their effects on water quality and habitat condition warrants further investigation.
Acknowledgements
REFERENCES
Antonsson T, Gudjonsson S (2002) Variability in timing and characteristics of Atlantic salmon smolt in Icelandic rivers. Trans Am Fish Soc 131:4 643-655
Asch RG (2015) Climate change and decadal shifts in the phenology of larval fishes in the California Current ecosystem. PNAS E4065-E4074
ASMFC (2012) River herring benchmark stock assessment volume I, stock assessment report no. 12-02. Arlington, VA
ASMFC (2017) River herring stock assessment update volume II: state-specific reports. Arlington, VA
Bethoney ND, Schondelmeier BP, Stokesbury KDE, Hoffman WS (2013) Developing a fine scale system to address river herring (Alosa pseudoharengus, A. aestivalis) and American shad (A. sapidissima) bycatch in the U.S. Northwest Atlantic mid-water trawl fishery. Fish Res 141:79-87
Blanchard JL, Mills C, Jennings S, Fox CJ, Rackham BD, Eastwood PD, O’Brien CM (2005) Distribution-abundance relationships for North Sea Atlantic cod (Gadus morhua): observation versus theory. Can J Fish Aquat Sci 62:2001-2009
Both C, Bouwhuis S, Lessells CM, Visser ME (2006) Climate change and population declines in a long-distance migratory bird. Nature 441:81-83
Brotons L, Thuiller W, Araújo MB, Hirzel AH (2004) Presence-absence versus presence-only modelling methods for predicting bird habitat suitability. Ecography 27:437-448
Burnham KP, Anderson DR (2002) Model selection and inference: a practical information-theoretic approach, 2nd edn. Springer Verlag New York, New York, NY
Collier RS, Odom MC (1989) Obstructions to anadromous fish migration. North Carolina Department of Natural Resources and Community Development and Environmental Protection Agency, National Estuary Program, APES Project No. 88-12. Raleigh, NC Cournane JM, Kritzer JP, Correia SJ (2013) Spatial and temporal patterns of anadromous alosine
bycatch in the US Atlantic herring fishery. Fish Res 141:88-94
Cushing DH (1990) Plankton production and year-class strength in fish populations: an update of the match/mismatch hypothesis. Adv Mar Biol 26:249-293
Ding H, Elmore AJ (2015) Spatio-temporal patterns in water surface temperature from Landsat time series data in the Chesapeake Bay, U.S.A. Remote Sens Environ 168:335-348 Durant JM, Hjermann DO, Ottersen G, Stenseth NC (2007) Climate and the match or mismatch
between predator requirements and resource availability. Clim Res 33:271-283 Ellis D, Vokoun, JC (2009) Earlier spring warming of coastal streams and implications for
alewife migration timing. N Am J Fish Manage 29:1584-1589
Fielding AH, Bell JF (1997) A review of methods for the assessment of prediction errors in conservation presence/absence model. Environ Conserv 24:38-39
Fogarty M, Incze L, Hayhoe K, Mountain D, Manning J (2008) Potential climate change impacts on Atlantic cod (Gadus morhua) off the northeastern USA. Mitig Adapt Strat Glob Change 13:453-466
Hall CJ, Jordaan A, Frisk MG (2010) The historic influence of dams on diadromous fish habitat with a focus on river herring and hydrologic longitudinal connectivity. Landscape Ecol 26:95-107
Hare JA, Morrison WE, Nelson MW, Stachura MM, Teeters EJ, Griffis RB, et al. (2016) A vulnerability assessment of fish and invertebrates to climate change on the northeast U.S. continental shelf. PLoS ONE 11(2): e0146756. doi:10.1371/journal.pone.0146756 Hastie TJ, Tibshirani RJ (1990) Generalized additive models. Chapman & Hall, London, UK Hightower JE, Wicker AM, Endres KM (1996) Historical trends in abundance of American shad
and river herring in Albemarle Sound, North Carolina. N Am J Fish Mange 16:257-271 Hosmer DW, Lemeshow S (2000) Applied logistic regression, 2nd edn. John Wiley & Sons, New
York, NY
Hutchings JA, Myers RA (1993) Effect of age on the seasonality of maturation and spawning of Atlantic cod, Gadus morhua, in the Northwest Atlantic. Can J Fish Aquat Sci 50:2468-2474
IPCC (2014) Climate change 2014: synthesis report. Contribution of Working Groups I, II, and III to the Fifth Assessment Report of the Intergovernmental Panel on Climate Change. IPCC, Geneva, Switzerland.
Jackson CF (1944) A biological survey of Great Bay New Hampshire: No. 1 physical and
biological features of Great Bay and the present status of its marine resources. 61. Marine Fisheries Commission. Durham, NH
Kovach RP, Gharrett AJ, Tallmon DA (2015) Temporal patterns in adult salmon migration timing across southeast Alaska. Glob Change Biol 21:1821-1833
Kennedy RJ, Crozier WW (2010) Evidence of changing migratory patterns of wild Atlantic salmon Salmo salar smolts in the River Bush, Northern Ireland, and possible associations with climate change. J Fish Bio 76:1786-1805
Lambert TC (1987) Duration and intensity of spawning in herring Clupea harengus as related to the age structure of the mature population. Mar Ecol Prog Ser 39:209-220.
Loesch JG, Lund Jr WA (1977) A contribution to the life history of the blueback herring, Alosa aestivalis. Trans Am Fish Soc 106:6 583-589
Mandrekar J (2010) Receiver operating characteristic curve in diagnostic test assessment. J Thorac Oncol 5:1315-1316
Merow C, Smith MJ, Edwards Jr TC, Guisan A, McMahon SM, Normand S, Wilfried T, Wüest RO, Zimmermann NE, Elith J (2014) What do we gain from simplicity versus complexity in species distribution models? Ecography 37:1267-1281
Mieszkowska N, Kendall MA, Hawkins SJ, Leaper R, Williamson P, Hardman-Mountford NJ, Southward AJ (2006) Changes in the range of some common rocky shore species in Britain – a response to climate change? Hydrobiologia 555:241-25
Miller-Rushing AJ, Lloyd-Evans TL, Primack RB, Satzinger P (2008) Bird migration times, climate change, and changing population sizes. Glob Change Biol 14:1959-1972 Moore RD, Spittlehouse DL, Story A (2005) Riparian microclimate and stream temperature
response to forest harvesting: a review. J Am Water Resour Assoc 41:813-834
Murawski SA (1993) Climate change and marine fish distributions: forecasting from historical analogy. Trans Am Fish Soc 112:647-658
Newton I (1966) The moult of the bullfinch Pyrrhula pyrrhula. Ibis, 108: 41–67. doi:10.1111/j.1474-919X.1966.tb07251.x.
Nye JA, Link JS, Hare JA, Overholtz WJ (2009) Changing spatial distribution of fish stocks in relation to climate and population size. Mar Ecol Prog Ser 393:111-129
Ogburn MB, Spires J, Aguilar R, Goodison MR, Heggie K, Kinnebrew E, et al. (2017) Assessment of river herring spawning runs in a Chesapeake Bay coastal plain stream using imaging sonar. Trans Am Fish Soc 146:22-35
Otero J, L'Abée-Lund JH, Castro-Santos T, Leonardsson K, Storvik GO, Jonsson B, et al. (2014) Basin-scale phenology and effects of climate variability on global timing of initial
seaward migration of Atlantic salmon (Salmo salar). Glob Change Biol 20:61-75 Paukert CP, Glazer BA, Hansen GJA, Irwin BJ, Jacobson PC, Kershner JL, Shuter BJ, Whitney
JE, Lynch A (2017) Adapting inland fisheries management to a changing climate. Fisheries 41(7):374-384
Pearce J, Ferrier S (2000) Evaluating the predictive performance of habitat models developed using logistic regression. Ecol Modell 128:127-147
Peer AC, Miller TJ (2014) Climate change, migration phenology, and fisheries management interact with unanticipated consequences. N Am J Fish Mange 34:94-110
Perry AL, Low PJ, Ellis JR, Reynolds JD (2005) Climate change and distribution shifts in marine fishes. Science 308:1912-1915
Prieto P, Peñuelas J, Ogaya R, Estiarte M (2008) Precipitation-dependent flowering of
Globularia alypum and Erica multiflora in Mediterranean shrubland under experimental drought and warming, and its inter-annual variability. Ann Bot 102:275-285
Quinn TP, Adams DJ (1996) Environmental changes affecting the migratory timing of American shad and sockeye salmon. Ecol 77:1151-1162
Richardson AD, Keenan TF, Migliavacca M, Ryu Y, Sonnentag O, Toomey M (2013) Climate change, phenology, and phenological control of vegetation feedbacks to the climate system. Agric For Meteorol 169:156-173
Robin X, Turck N, Hainard A, Tiberti N, Lisacek F, Sanchez JC, Müller M (2011) pROC: an open-source package for R and S+ to analyze and compare ROC curves. BMC
Bioinformatics 12:77
Sherry RA, Zhou Z, Gu S, Arnone III JA, Schimel DS, Verburg PS, Wallace LL, Luo Y (2009) Divergence of reproductive phenology under climate warming. PNAS 104:198-202 Sing T, Sander O, Beerenwinkel N, Lengauer T (2005) ROCR: visualizing classifier
performance in R. Bioinformatics 21:22 3940-3941
Stoner AW, Manderson JP, Pessutti JP (2001) Spatially explicit analysis of estuarine habitat for juvenile winter flounder: combining generalized additive models and geographic
information systems. Mar Ecol Prog Ser 213:253-271
Thuiller W, Brotons L, Araújo MB, Lavorel S (2004) Effects of restricting environmental range of data to project current and future species distributions. Ecography 27:165-172
U.S. Geological Survey (2013) National Hydrography Geodatabase: The National Map Viewer [online]. Available from https://viewer.nationalmap.gov/viewer/nhd.html?p=nhd [accessed 24 January 2016].
Walters AW, Barnes RT, Post DM (2009) Anadromous alewives (Alosa pseudoharengus) contribute marine-derived nutrients to coastal stream food webs. Can J Fish Aquat Sci 66:439-448
Watanuki Y, Ito M, Deguchi T, Minobe S (2009) Climate-forced seasonal mismatch between the hatching of rhinoceros auklets and the availability of anchovy. Mar Ecol Prog Ser
393:259-271
Watts DH (2003) A documentary history on the alewife in Maine and New England. Friends of the Kennebec Salmon
White H, McCargo J, Nelson G (2017) Status of river herring in North Carolina. ASMFC River Herring Stock Assessment Update Volume II: State-Specific Reports 532-591
White MA, Thornton PE, Running SW (1997) A continental phenology model for monitoring vegetation responses to interannual climatic variability. Global Biogeochem Cycles 11:217-234
Wood, SN (2006) Low-rank scale-invariant tensor product smooths for generalized additive mixed models. Biometrics 65:1025-1036
Wood, SN (2011) Fast stable restricted maximum likelihood and marginal likelihood estimation of semiparametric generalized linear models. Journal of the Royal Statistical Society: Series B (Statistical Methodology) 73:3-36
Yako LA, Mather ME (2000) Assessing the contribution of anadromous herring to largemouth bass growth. Trans Am Fish Soc 129:77-88
Tables
Table 1. NC Division of Marine Fisheries river herring spawning habitat survey sampling history. Sampling was conducted within the tributaries and drainage areas of the listed rivers, creeks, or bays. AR = Alligator R., CH = Cashie R., CR = Chowan R., CS = Tull B., EB = Edenton B., LR = Little R., MC = Mackeys C., MR = Meherrin R., NR = North R., PK =
Pasquotank R., PR = Perquimans R., RR = Roanoke R., SR = Scuppernong R., YR = Yeopim R. Decade Years River Systems
AR CH CR CS EB LR MC MR NR PK PR RR SR YR
1970 X X X X X X X X X X X
1973 X X X X X X X
1974 X X X X X X X
1975 X X X
1976 X X
1977 X
1978 X X
1979 X
1980 X X X X X X
1980 X X
1982 X
1983 X
1987 X X X
1988 X X X
2000 X X X X X X X
2001 X X X
2007 X
2008 X X X
2009 X X X X
2010 X X X X X X X X X X X X X
2010 X X X X
2011 X X X
2012 X X X X
2013 X X X X
2014 X X X
2015 X X X
Table 2. Model selection for the generalized additive models for alewife (Alosa
pseudoharengus) and blueback herring (Alosa aestivalis) in the Albemarle Sound, North Carolina watershed, 1973 – 2016. Models were assessed using Akaike Information Criterion (AIC), weighted AIC (AICw), and Receiver Operating Characteristic Area Under the Curve (AUC). The most parsimonious model is highlighted.
Model AIC ΔAIC AICw AUC % Dev Exp
Alewife
Full 9876.90 0.00 1.00 0.78 17.35
-o*d 10078.23 201.33 0.00 0.77 15.59
-dp 10191.59 314.69 0.00 0.75 14.59
-d-o*d 10378.99 502.09 0.00 0.74 13.01
-o-o*d 11255.85 1378.95 0.00 0.66 5.51
Null 11891.48 11891.48 0.00 0.50 <0.00
Blueback Herring
Full 6285.50 0.00 1.00 0.86 25.56
-od 6487.33 201.86 0.00 0.84 45.16
-d-o*d 6514.21 228.73 0.00 0.84 44.88
-dp 6772.35 483.88 0.00 0.82 44.30
-o-o*d 7839.43 1553.95 0.00 0.70 42.38
Null 8398.15 2112.68 0.00 0.50 41.94
Table 3. Logistic GAM-derived migration metrics for alewife and blueback herring spawning in the Albemarle Sound, NC watershed. Metrics are ingress (5% probability of presence on left hand side of the distribution), egress, peak (maximum presence probability in a unimodal curve or mean day of maximum presence probabilities in bimodal/plateaued curve), and season length estimations
(differences between ingress and egress). Some temporal comparisons within and across decades use extrapolated predictions. Predictions influenced by extrapolation are denoted with *. Conservative estimates based upon the first presence and last presence are given in brackets. The 95% confidence interval is give in parenthesis.
Alewife
Decade Ingress Egress Peak Season Length
1970 43 (39-46) 129 (127-144) 82 86
1980 48 [<55]* 122 (119-124) 81 74 [>67]
2000 24 [<34]* 107 (106-108) 70 (68-72) 83 [>73]
2010 27 (25-29) 102 (101-103) 70 (68-72) 75
Ingress Diff Egress Diff Peak Diff Season Diff
1970s vs 2010s -16 -27 -12 -11
Per Decade -4 -6.75 -3 -2.75
Blueback Herring
Decade Ingress Egress Peak Season Length
1970 76 (74-77) >150 [>128]* 117 (108-133) >74 [>52]
1980 79 (77-80) 138 [>126]* 108 (102-114) 59 [>47]
2000 71 (70-72) 117 (116-118) 95 (90-100) 46
2010 74 (73-75) 115 (114-116) 95 (91-99) 41
Ingress Diff Egress Diff Peak Diff Season Diff
1980s vs 2010s -5 -23 [<-9] -13 -18 [<-6]
Figures
Figure 3. Logistic GAM-derived predictions of (A) alewife presence probability and (B) blueback herring presence probability across decades. Probabilities were modeled using ordinal day, decade, distance proportion, and ordinal day * decade for samples collected in the NC Division of Marine Fisheries river herring spawning habitat survey throughout the Albemarle Sound, NC watershed. 95% CI indicated by vertical line.
Figure 4. Logistic GAM-derived predictions of (A) alewife and (B) blueback herring presence probability. Solid curves are model predictions from dates sampled, dotted curves are extrapolated predictions. Probabilities were modeled using ordinal day, decade, distance proportion, and ordinal day * decade for samples collected in the NC Division of Marine Fisheries river herring spawning habitat survey throughout the Albemarle Sound, NC watershed. Points represent the raw proportion of presences for all nets set on each day of the decade. Black horizontal line at 5% for estimates of ingress and egress.
Figure 5. Presence proportions for (A) alewife and (B) blueback herring at 30 sampling locations regularly sampled across four decades of NCDMF river herring sampling. Proportions are calculated from samples taken on any given day within the early (1973 – 1988) or late (2001 – 2016) time periods.
Figure 6. Water temperature data for 30 stations regularly sampled throughout four decades of NCDMF river herring sampling were divided into early (1973 – 1988) and late (2001 – 2016) time periods, with the early temperature trend extrapolated out to the latest egress date predicted by the phenology models (dotted line). Water temperatures (early data above) associated with the predicted egress dates (solid black star) for (A) alewife (1970s) and (B) blueback herring (1980s) were identified (17.2 C for alewife and 17.9 C for blueback herring). The 2001 – 2016 dates associated with these 1973 – 1988 egress temperatures were then identified as a temperature-dependent egress date (solid gray star; day 109 for alewife and day 114 for blueback herring). The predicted egress dates from the 2010s phenology model are plotted for alewife (solid red star; day 102) and blueback herring (solid blue star; day 115). Blueback herring ingress was also examined using the same approach described for egress (see open stars). The 1973-1988 temperature on the date of ingress (day 79; open black star) in the 80s was 13.3 C; that temperature gave an estimate of ingress based on the 2001-2016 temperature data of day 83 (open gray star) and was similar in time to the model-predicted ingress date (open blue star; day 74). The gray shading represents the 95% CI.
CHAPTER 2
Examining the Influence of Anthropogenic Riparian Zone Land Cover on River Herring Catch within the Albemarle Sound Watershed, NC
Abstract
Alewife (Alosa pseudoharengus) and blueback herring (Alosa aestivalis), collectively known as river herring, are economically, ecologically, and culturally important fishes that are at low levels of abundance. Populations have remained in a depressed state since the 1970s in spite of fishing moratoria and habitat restoration efforts. We hypothesized that anthropogenic
anthropogenic modifications to impede the ability of river herring to migrate to spawning habitats within the Albemarle Sound watershed.
1. Introduction
Riparian zones are the interface between aquatic and terrestrial ecosystems. Riparian zones are biologically diverse ecotones that span from the river’s edge through the floodplain and are comprised of vegetation that are tolerant to variably hydrated soils (Cowardin et al. 1979). Riparian zones act as disturbance buffers, performing critical ecosystem services such as stabilizing river banks, preventing erosion from flood events, and sequestering nutrient runoff from nonpoint source pollution (Gregory et al. 1991; Sweeney et al. 2004). Complete and partial deforestation of the riparian zone has been shown to reduce, if not completely, eliminate these ecosystem services (Sweeney et al. 2014). Nutrient pollution is regularly cited as the greatest threat to water quality and the stability of inland aquatic ecosystems (Smith 2003; Dudgeon et al. 2006; Vörösmarty et al. 2010; Brooks et al. 2015). Agricultural and urban activities can
significantly increase nutrient concentrations in neighboring aquatic systems, causing dramatic declines in water quality. This includes toxic algal blooms, hypoxia, changes in pH, increased turbidity, destruction of submerged aquatic vegetation, and fish kills (Carpenter et al. 1998).
Limburg and Waldman (2009) found 24 examples of diadromous populations that have decreased in relative abundance by >90%. Alewife (Alosa pseudoharengus) and blueback herring (Alosa aestivalis), collectively known as river herring, are two species of anadromous fishes that have shown dramatic decreases in abundance across their entire North American range due to fishing pressure, habitat destruction, and possibly climate change (Hightower et al. 1996; ASMFC 2012; NCDMF 2015; ASMFC 2017; See Chapter 1). River herring populations found in the Albemarle Sound, North Carolina watershed were historically plentiful, with commercial pound-net landings averaging 5.4 million kilograms between 1880 and 1970
(Chestnut & Davis 1975). By 1987, landings had decreased to under one million kilograms, and in 2006, the last year before North Carolina enacted a fishing moratorium on river herring, landings were just over one thousand pounds with CPUE matching the decline in landings (NCDMF 2015). In 2006, the National Marine Fisheries Service identified river herring as a species of concern, and in 2007 North Carolina enacted a river herring fishing moratorium. In spite of this moratorium, the river herring population remains at historically low levels of abundance (ASMFC 2017) and prompts further investigation into the condition of spawning habitat and migration pathways for river herring within the Albemarle Sound watershed.
Strategic Habitat Area (SHA) within the Albemarle Sound region (NCDEQ 2016). The SHA designates habitat that is vital to successful reproduction, recruitment, and survival of many aquatic species, including river herring, and is comprised of main rivers, tributaries, swamps, and floodplains. Many of the waters within the Albemarle Sound watershed are also designated as SHA, and have been classified as nutrient sensitive by the North Carolina Department of Environmental & Natural Resources (NCDENR 2007).
Nutrient sensitive waters are susceptible to algal blooms and subsequent hypoxic periods. Hypoxia has been shown to make habitats untenable for fish species, especially in estuarine environments where human activity has expanded. Wannamaker and Rice (2000) demonstrated hypoxia detection avoidance behaviors in seven North Carolina estuarine species. A result of the avoidance of hypoxic conditions can be habitat compression, which has been observed in the Neuse River, NC (Eby & Crowder 2002). Little information exists on the responses of adult river herring to hypoxic conditions. Alewife have been shown to tolerate dissolved oxygen conditions as low as 0.5 mg/L for up to five minutes, as long as post-exposure conditions were greater than 3.0 mg/L, and experience a mortality rate of 33% when exposed to DO
concentrations between 2.0 mg/L and 3.0 mg/L for 16 hours (Dorfman & Westman 1970). Blueback herring have been reported to require DO concentrations 5.0 mg/L for spawning activity (Jones et al. 1978). Avoidance responses by river herring to anthropogenically induced hypoxic conditions during their spawning migration may result in impassable waters and reductions in habitat use.
Excess nitrogen and phosphorus can be introduced by non-point sources such as
characteristic in retention of pollutants (Phillips 1989). Prior to 1997, North Carolina did not mandate any requirements for the existence of riparian zone buffers. In response to large scale fish kills associated with increased levels of nitrogen and phosphorus in the Neuse River, North Carolina legislature enacted a law to require riparian buffer regions of 50 feet for the Neuse River (ARCD 2016). Further riparian zone mandates within the state have only been made on a case-by-case basis with six watersheds protected, none of which are within the Albemarle Sound watershed. The 2012 Annual Progress Report on the Neuse Agricultural Rule (15 A NCAC 2B.0238) showed marked decreases in nitrate levels with increases in riparian zone buffer distance, from 20 ft to 100+ ft (NC Environmental Management Commission 2012). Further evidence for greater riparian zone buffers to remove nitrogen has been found in a meta-analysis by Mayer et al. (2007), which shows that riparian zones > 50 m more consistently remove nitrogen than those from 0-25 m. A second meta-analysis by Sweeney & Newbold (2014) determined that lower order streams should have buffers ≥30 m. In spite of evidence for the implementation of riparian zone regulation, North Carolina has yet to require the presence of riparian zone buffers within the Albemarle Sound watershed. Riparian zone buffers in North Carolina have actually been declining. From 2012 – 2015, North Carolina has shown consistent losses in riparian buffer acreage and linear feet of streams, losing ~34 ac of riparian buffer and ~36,400 ft of streams per-year (NCDEQ 2016). The loss of riparian zone buffers to
agriculture/silviculture and urban development may be negatively effecting water quality, and impeding river herring from reaching their spawning grounds.
Marine Fisheries through their river herring spawning habitat survey. We also examine trends in water quality, and whether culverts, a prevalent construction technique for road crossings, may be restricting river herring spawning movements.
2. Methods
2.1 Study Location and River Herring Monitoring
River herring monitoring was conducted by the North Carolina Division of Marine Fisheries (NCDMF) through their river herring spawning habitat survey. The survey is intended to identify the extent of stream habitats used for both alewife and blueback herring spawning in nine river systems and their associated tributaries that feed into the Albemarle Sound.
Monitoring began in 1973 and is still currently active as of 2017, with 24 of the possible 43 years sampled. For our analysis, we used NCDMF data from 2007 to 2016, which temporally aligned with the most recent land cover data available through NOAA (detailed below). In 2007, only the Yeopim River system was sampled. From 2008 to 2016, sampling consisted of the entirety of the river herring spawning run within the Chowan River and Edenton Bay watersheds plus one of twelve additional Albemarle Sound river systems on a rotating basis. Additional river systems were sampled if travel time to and from sampling stations was not limiting.
when running ripe females were encountered. Navigable waterways were sampled with gillnet lengths that left watercraft passage uninterrupted; detection probability for these sets was assumed similar to across channel sets. Gillnets were set on Mondays, checked every 24 hours, and removed over weekends and holidays due to logistical constraints. Water surface
temperature, air temperature, pH, salinity, conductivity, and DO were taken at each sampling station upon net inspection using a YSI Professional Plus.
Sampling for alewife commenced when staging alewife were caught in the NCDMF striped bass independent gillnet survey, which is conducted within the Albemarle Sound at the mouths of the river systems. Nets were reset to their furthest downstream positions when the first blueback herring was caught in any of the alewife survey nets. Sampling ceased when catches of blueback herring in the NCDMF Chowan River pound-net survey, conducted in the main stem of the Chowan River, became sporadic (<10 fish per week).
2.2 Analyses
2.2.1 GIS construction of migration pathways and riparian zones
alternative migration route was viable to reach the sample station. The migration pathway distance was measured within the Network Analyst tool.
In order to assess the riparian zone land cover at a constant riparian zone width, stream widths needed to be accounted for. Stream widths were incorporated into the migration
pathways by creating polygon representations from NCDEQ Estuarine Shoreline – Coastal North Carolina vector polylines (North Carolina Department of Coastal Management 2012). Some sections of shoreline were absent from the dataset and thus required digitization. Digitization was conducted over ESRI World Imagery (ESRI et al. 2017) at a scale of 1:1000 m. Stream polygons were clipped to the extent of the pathway leading to a given sample station and tributaries downstream of the sample station were removed. Riparian zone buffers of 100 m, as recommended by Hawes and Smith (2005) for effective prevention of pesticide, litter and debris input, were applied to the paired migration pathway vectors and polygons. The paired buffers were then merged, resulting in unique 100 m riparian zones for the migration pathways leading to the 234 sampling stations throughout the Albemarle Sound watershed. Land cover
2.2.2 River herring and habitat relationships
Using river herring presence/absence data collected from 2007 – 2016 through the NCDMF river herring spawning habitat survey, we created generalized additive models (GAMs) with a logit link and a binomial distribution to model the effects of habitat and water quality variables on river herring presence and absence. GAMs are useful in modeling nonparametric relationships typical of ecological data (Hastie & Tibshirani 1990). Penalized thin plate splines with shrinkage parameters were used as smoothers. The inclusion of shrinkage parameters allows for non-significant variables to be removed from the model by reducing the splined term to zero (Wood 2006).
Because the spatial coverage of the survey changed across time, with non-Chowan River systems being sampled on a rotating basis, and the presence of river herring can change with distance upstream, spatial variability needed to be accounted for. We created a proportion in order to standardize the upstream distance of the sample stations within each river system; the distance between the tributary mouth and each sample station to the maximum distance a river herring was observed in the tributary (hereafter referred to as distance proportion). An additional model for each species was created to evaluate our results and to control for the variation in river systems sampled. We used a subset of data from the Chowan River system and the Edenton Bay watershed, which were sampled for all but one year in the time series (not sampled in 2007).
Land covers were binned into four general classifications: forest, wetland,
MGCV (Wood 2011). Models were constructed with variables having associated smoothers, no smoothers (linear predictor), and tensor product interaction smooths with the interaction and main effects. Interactions were constructed with tensor product interaction smooths which are more stable and interpretable than using full tensor product smooths that remove the main effects (Wood 2017). Akaike’s Information Criterion (AIC) was used to select the model with the best fit and fewest degrees of freedom (Burnham & Anderson 2002). Percent deviance explained was calculated by subtracting the model deviance from the null deviance then dividing by the null deviance times one-hundred (Stoner et al. 2001).
The ability for river herring to pass through culverts found within the Albemarle Sound watershed was also assessed using the presence/absence data for the whole time series (1973 – 2017). Observations were made regarding whether river herring were reaching the culverts (presence at the culvert downstream side) and whether passage was possible (presence immediately upstream of the culvert or at the next upstream sampling station).
3. Results
Aggregating land cover classifications along river herring migration pathways into four categories (wetland, forest, agriculture/silviculture, and developed) reveals that the riparian zone landscape within the Albemarle Sound watershed is largely undisturbed (Figure 1). The