DOI: 10.1534/genetics.103.022665
Microsatellite Mutation Models: Insights From a
Comparison of Humans and Chimpanzees
Raazesh Sainudiin,*
,1Richard T. Durrett,
†Charles F. Aquadro
‡and Rasmus Nielsen
§*Department of Statistical Science, Cornell University, Ithaca, New York 14853,†Department of Mathematics, Cornell University, Ithaca, New York 14853,‡Department of Molecular Biology and Genetics, Cornell University, Ithaca, New York 14853
and§Department of Biological Statistics and Computational Biology, Cornell University, Ithaca, New York 14853 Manuscript received September 27, 2003
Accepted for publication June 3, 2004
ABSTRACT
Using genomic data from homologous microsatellite loci of pure AC repeats in humans and chimpanzees, several models of microsatellite evolution are tested and compared using likelihood-ratio tests and the Akaike information criterion. A proportional-rate, linear-biased, one-phase model emerges as the best model. A focal length toward which the mutational and/or substitutional process is linearly biased is a crucial feature of microsatellite evolution. We find that two-phase models do not lead to a significantly better fit than their one-phase counterparts. The performance of models based on the fit of their stationary distributions to the empirical distribution of microsatellite lengths in the human genome is consistent with that based on the human-chimp comparison. Microsatellites interrupted by even a single point mu-tation exhibit a twofold decrease in their mumu-tation rate when compared to pure AC repeats. In general, models that allow chimps to have a larger per-repeat unit slippage rate and/or a shorter focal length compared to humans give a better fit to the human-chimp data as well as the human genomic data.
M
ICROSATELLITES are tandem repeats of short geometric. In a simpler two-phase model of Fu and Chakraborty(1998) mutations of lengthⱖ1 are geo-DNA motifs between 2 and 5 bp. Their high lengthmetrically distributed. Under the SMM and the TPM, variability, genome-wide distribution, and abundance
a microsatellite is assumed to mutate at a constant rate, make them useful for evolutionary and population
ge-irrespective of its repeat length. Moreover, under these netic inference in areas as diverse as molecular forensics,
models there is no bias toward an expansion or a con-parentage testing, molecular anthropology, and
conser-traction, and thus the microsatellites are expected to vation genetics and in studies of human evolutionary
grow or contract unconstrained over time. While con-history (e.g.,JarneandLagoda1996;Ellegren2000b).
straining the range of repeat lengths through a model Population genetic inferences may be sensitive to the
with reflecting boundaries (NautaandWeissing1996; assumed model of microsatellite evolution. Therefore,
Feldman et al.1997) can circumvent this problem of much focus has centered on the development of
biologi-unbounded growth, the biological reality of such a de-cally realistic models. However, there has been relatively
fined boundary is unclear. little focus on testing and comparing these models using
Evidence for length-dependent effects on mutation real data.
rate (Ellegren2000a), whereby longer microsatellites The simplest popular model of microsatellite
evolu-mutate more often than shorter ones, and the presence tion is the classical stepwise mutation model (SMM) of
of point mutations in some repeats make the propor-OhtaandKimura(1973) in which, upon a mutation,
tional slippage (PS) model of Kruglyaket al. (1998) 1 repeat unit is either gained, resulting in an expansion,
and its extensions byCalabreseet al.(2001) attractive. or lost, resulting in a contraction. However, mutations
In the symmetric PS model, an equilibrium distribution have been observed to change the repeat length by⬎1
of repeat lengths exists through a balance between slip-unit (Xu et al. 2000; Harr et al. 2002; Huang et al.
page events and point mutations (Kruglyaket al.1998). 2002). The two-phase model (TPM) ofDiRienzoet al.
Various mutational biases have been proposed, includ-(1994) addresses this by allowing mutations of 1 repeat
ing an upward bias favoring expansions in humans (Amos unit (one-phase) with probability p and mutations of
et al.1996) and barn swallows (Primmer et al.1996), an ⱖ1 unit(s) (two-phase) with probability 1⫺p, while the
excess of contractions in long microsatellites of yeast distribution of the lengths of multiunit mutations is
(Wierdlet al.1997) and fruit fly (HarrandSchlo¨ t-terer 2000), and the rate of contractions increasing exponentially with repeat length in humans (Xu et al. 1Corresponding author:Department of Statistical Science, 301 Malott
2000). In the presence of a linear bias toward a target
Hall, Cornell University, Ithaca, NY 14853.
E-mail: [email protected] or focal length, as proposed byGarzaet al.(1995) and
further elaborated byZhivotovskyet al.(1997), micro-satellites below the focal length tend to expand, and those above it tend to contract. Other models emphasize mutational bias by allowing the probability of an expan-sion upon mutation to be independent of repeat length (Walsh1987;TachidaandIizuka1992;Fuand Chak-raborty 1998) or be dependent on it exponentially (CalabreseandDurrett2003;Whittakeret al.2003), quadratically, or piecewise linearly (Calabreseand Dur-rett2003).
Thus, broadly speaking, there are at least three sets of qualitatively contrasting features in the existing mod-els of microsatellite evolution. The first is one-phase vs. two-phase mutations. The second is mutation rate proportionality (the proportional dependence of muta-tion rate on repeat length)vs. rate equality. The final set of contrasting features is the presence or absence of mutational bias, whereby the probability of expansion upon mutation may depend on the repeat length of the mutating microsatellite in one form or another. We address only constant bias, where the probability that a
Figure 1.—Markov chains on the branch leading to the mutation results in an expansion is constant for all
al-ancestor (X(a)), chimpanzee (X(c)), and human (X(h)). leles, and linear bias, where this probability varies
lin-early with repeat length.
We test the relative significance of these contrasting
1. In, each of the two terminal branch lengths,cand features, as embodied by variants of some popular
mod-h, represents the product of mutation rate at allele els and their hybrids, with likelihood-ratio tests (LRTs)
and number of generations along the chimp and human and the Akaike information criterion (AIC), using data
lineages, respectively. We assume that the time to coales-from dinucleotide loci homologous between humans
cence for a pair of homologous alleles, within the ances-(Homo sapiens) and chimps (Pan troglodytes).
Complica-tral population, is negligible relative to the time since tions to the mutational process from variation in repeat
the human-chimp speciation. motif as well as interruptions by point mutations are
Let ⌰(a),⌰(c), and ⌰(h)be parameters of the Markov also explored. We address the question of longer repeat
chainsX(a),X(c), andX(h), with transition probability ma-length in humans compared to chimps through a lin- trices P(a), P(c), and P(h), respectively. For an ergodic eage-specific analysis. continuous-time Markov chain, its transition probability
matrix P() :⫽(Pi,j)⍀i,j⫽⫽exp{Q}, where Q:⫽(qi,j)⍀i,j⫽
is its infinitesimal generator or rate matrix. The station-MODELS ary distribution of such a Markov chain, denoted by⫽ (,⫹1, . . . ,⍀), is the unique probability distribution For mathematical convenience, most models of
mi-on S satisfying the matrix equation Q⫽ 0⫽ (0, 0, crosatellite evolution assume that the number of repeat
. . . , 0) (see,e.g.,Bre´maud1999). Interest inP() and units can be any positive integer. Our numerical compu-
arises because they determine the likelihood function tations are done with finite matrices, so we study these
Liin Equation 1.
Markov chains on a truncated state space S⫽ {, ⫹
Let(a)be the stationary distribution of the ancestral 1, . . . , ⍀}. Truncation of the state space from above
chain. Let⌰:⫽(⌰(a),⌰(c),⌰(h)) and:⫽(
c,h). The is biologically reasonable, as microsatellites are rarely
likelihood, given homologous allele length data Di ⫽
longer than⍀(a few tens of repeat units), and that from
(Ci,Hi) at locusi, is
below ensures thatis greater than the threshold repeat
length above which mutations in length that are character- Li(⌰,|Di) :⫽
兺
j僆S(a)
j P(c)j,Ci(c)P(h)j,Hi(h). (1) istic of microsatellites occur (RoseandFalush1998).
The data D for our study are a 2 ⫻ N matrix of Since we do not know the ancestral state, the likelihood microsatellite allele lengths fromNloci homologous in may be thought of as a weighted sum over all possible humans and chimps. We model the distribution of D ancestral states, where the weights come from the sta-by superimposing three Markov chains, X(a), X(c), and tionary distribution of the ancestral chain. Assuming
X(h), on the ancestral, chimp, and human branches, independence among theNloci, the likelihood, given the total dataD, is obtained by multiplication.
biased. So, wheni⬍ f, the mutational bias is upward, L(⌰,|D) :⫽
兿
N
i⫽1
Li(⌰,|Di). (2)
towardf, since␣(u,v,i)⬎0.5, and wheni⬎f, the bias is downward, towardf, as␣(u,v,i)⬍ 0.5.
A general model within which all other models of
The probability of a transition from allele ito jint interest are nested is defined below. We start by defining
generations, with a mutation rate at , is given by ␥(m,i,j), a truncated geometric distribution with
suc-Pi,j(), where ⫽ t. Note that for large values of ,
cess probabilitym, given by
Pi,j() is approximately equal toj, the stationary
distri-bution. Large values ofmodel heavily saturated data obtained from a pair of highly diverged species whose ␥(m,i,j)⫽
冦
m(1⫺m)|i⫺j|⫺1
1⫺ (1⫺m)⍀⫺i, ⱕi⬍ jⱕ ⍀ m(1 ⫺m)|i⫺j|⫺1
1⫺(1 ⫺m)i⫺, ⱕj⬍ iⱕ ⍀.
repeat length distributions are approximately indepen-dent of each other and close to stationarity. Therefore, the extent of saturation in the observed data is reflected Observe that for every allele i, 兺⍀j⫽i⫹1␥(m,i,j)⫽兺ij⫽⫺1 by the magnitude of the estimate of . The structure
␥(m,i,j)⫽1. of the various submodels within the general model is
A continuous-time Markov chain X on Sis defined described by the tree in Figure 2. The last column shows with an infinitesimal generatorQgiven by some of the common models in the literature that are closely related to some of these submodels. The model parameters that are fixed for a set of submodels are written above the branches leading to them.
qi,j⫽
冦
(i,s)␣(u,v,i)(p⫹(1⫺p)␥(m,i,j)), i⫽j⫺1 (i,s)␣(u,v,i)(1⫺p)␥(m,i,j), i⬍j⫺1 (i,s)(1⫺ ␣(u,v,i))(p⫹(1⫺p)␥(m,i,j)), i⫽j⫹1 (i,s)(1⫺ ␣(u,v,i))(1⫺p)␥(m,i,j), i⬎j⫹1
⫺
兺
i⬆jqi,j, i⫽jThe equal-rate unbiased one-phase model (EU1) is a truncated version of the SMM ofOhtaandKimura (1973). The equal-rate, constant-biased, one-phase model (3)
(EC1) embodies constant bias toward expansion in the where (i, s) is the mutation rate of allele i and ␣(u, mutation process by constraining␣(u, 0,i)⫽ufor any v, i) is the probability that a mutation results in an allelei. Observe thatudoes not vary with allele length expansion. Whenp⫽1, any microsatellite allele mutates in the EC1 model, asv, the linear bias parameter, is set (i.e., expands or contracts) by only 1 unit of repeat at 0. Freeingvallows a linear mutational bias as embod-length, but whenp⬍1, it mutates by 1 or more unit(s) ied by the equal-rate, linear-biased, one-phase model of length with probability 1⫺pand by 1 unit of length (EL1), with a mutational bias toward the focal length with probabilityp. Given that an allele i undergoes a f, akin in spirit to the mutation scheme introduced by multistep mutation, the probability of expanding or Garza et al. (1995). Note that EL1 is related to the contracting bykunits is given by␥(m,i,j). The functions simplest version of the PLBias model ofCalabreseand
␣andare defined as Durrett (2003). The equal-rate, one-phase models,
EU1, EC1, and EL1, havesset to 0, making the mutation (i,s)⫽ (1⫹(i⫺ )s),
rate equal for all alleles ((i,s)⫽ ), unlike their pro-␣(u,v,i)⫽ max{0, min{1,u⫺ v(i⫺ )}}. portional-rate, one-phase cousins, PU1, PC1, and PL1, respectively, which allow sto take values in (⫺1/(⍀ ⫺ The proportional dependence of mutation rate on
⫹ 1), ∞). The PU1 model is related to PS \0M, a repeat length is captured by the proportional rate
pa-proportional slippage model without point mutations rameters僆(⫺1/(⍀ ⫺ ⫹1),∞) in(i,s). Whens⫽
proposed by Calabrese et al.(2001). The PC1 model 0, alleles of all lengths have the same mutation rate僆
is similar to the models proposed byWalsh(1987) and (0, ∞) of allele . Thus, s represents the strength of
TachidaandIizuka(1992). length dependence of the mutation rate. Observe that
In all six models discussed so far, alleles mutate by 1/(i,s) is the average amount of time spent by a
micro-only 1 unit of repeat length, sincepandmare set at 1. satellite locus in an allele of repeat lengthi(mean
hold-Whenp⬍1 andm⬍1, we have an equal-rate, unbiased, ing time in allelei).
two-phase model EU2 *, the truncated version of the In the function␣(u,v,i), the constant bias parameter
TPM ofDiRienzoet al.(1994), which allows both single-isu僆[0, 1] and the linear bias parameter isv僆(⫺∞,
step and multistep mutations instantaneously. However, ⫹∞). Ifu⫽0.5 andv⫽0, we have a symmetric unbiased
in this two-phase model, the parameters p and m are mutational process in which the probability that a
muta-nonidentifiable at the boundaries of interest (p⫽1 or tion is an expansion or a contraction is equal. Ifv⫽0,
m⫽1). We rectify this by a single-valued transformation then␣(u,v,i)⫽u僆[0, 1] for any allelei, and we have
prior to inference. a model with constant mutational bias. Furthermore, we
It is possible to obtain the six one-phase models from have a linear mutational bias whenv⬆0. If 0.5⬍u⬍
Equation 3 by settingpat 0 to allow mutations of length 1 and (u ⫺ 0.5)/(⍀ ⫺ ) ⬍ v ⬍ ∞, we have a focal
ⱖ1 and settingmat 1 to force the geometric distribution lengthf⫽((u⫺0.5)/v)⫹ , where the probability of
to put all its mass on one-step mutations. Whenm⬍1, contraction equals that of expansion (␣(u,v,f)⫽0.5),
Figure 2.—Model descrip-tion.Kdenotes the number of free parameters. The fixed pa-rameter(s) for each set of models is/are shown above the branch leading to it.
Chakraborty(1998), namely EU2, EC2, EL2, PU2, PC2, we obtained 644 candidate microsatellite loci homolo-gous between the two primates.
and PL2. These models capture the qualitative features
Each such microsatellite locus was retained if it had of one-phase and two-phase in a simpler and identifiable
a flanking sequence of lengthⱖ200 bp on at least one manner. Observe that the equal-rate linear-biased
two-side of the dinucleotide repeat in both species and a phase model (EL2) is not unlike a model inspired by the
flanking sequence of lengthⱖ50 bp on the other side mutation scheme ofGarzaet al.(1995; see also
Zhivo-in both species. A compound repeat is defZhivo-ined to have tovskyet al.1997), in which the mutation rate is
inde-more than one motif, each of repeat lengthⱖ10, within pendent of allele length and the bias is a linear function
a 50-bp radius. Thirty percent of loci contained com-of repeat length with an attracting focal length. The
pound repeats in at least one of the homologs and were most general model PL2 is related to a hybrid of PS \0M
excluded from further analysis. Finally, those loci whose and the model due toGarzaet al.(1995).
simple repeats in at least one species were interrupted by two or more point mutations were omitted. Thus 383 candidate loci were obtained. About 70% of these loci DATA AND METHODS
occurred in human chromosome 7. Fifteen percent of To find the largest number of homologous loci in these 383 loci were omitted as their human homologs the pair of primates, while minimizing ascertainment wereⱕ9 units in repeat length. Among the remaining bias and sequencing error, we first obtained 21.4 Mbp 321 loci 78% were AC repeats (namely, AC, CA, TG, of theP. troglodytes(chimp) sequences in HTGS (high- and GT repeats), 13% were AT repeats (namely, AT throughput genomic sequence) (OuelletteandBogu- and TA repeats), and 9% were AG repeats (namely, AG, ski1997) phase 3, available by March 4, 2003, through GA, TC, and CT repeats). There were no CG repeats the Entrez retrieval system of NCBI (http://www.ncbi. (namely, CG and GC repeats).
nlm.nih.gov/entrez/). The sequences in HTGS phases Among these 321 loci, 18% contained homologous 0, 1, and 2 were excluded to minimize sequencing error. pairs of once-interrupted dinucleotide repeats, which For all analyses in this study we set the lower bound ⫽ have exactly one point mutation interrupting an other-10. Chimp microsatellites of dinucleotide motifs with wise pure stretch of the repeat in either or both species. repeat lengthⱖ10 were obtained. To assure some level We count the repeat length of a once-interrupted AC of independence, all microsatellites within 200 bp of repeat (iAC repeat), ignoring the interruption. For
in-another were discarded. stance, the iAC repeat “ACACATACAC” is taken to be
Each selected chimp microsatellite, with 200 bp of of length 5. The common practice in the literature of flanking sequence upstream and downstream, was used directly extrapolating the repeat length of a microsatel-to perform an extremely stringent (E-valueⱕ1⫻10⫺100) lite from its PCR fragment length is the motivation be-unfiltered BLAST search against the human contigs hind such a characterization of repeat length for an downloaded from the August 23, 2002, NCBI release interrupted microsatellite.
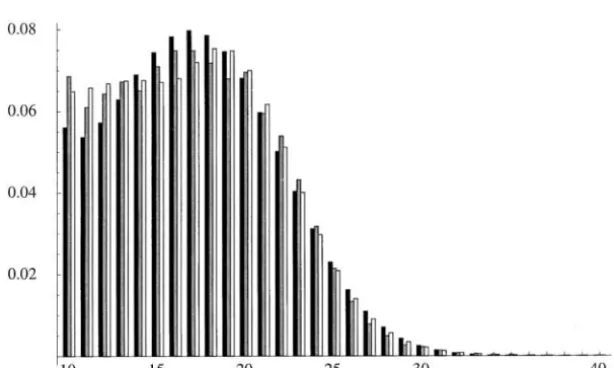
Figure3.—Counts of the pairs of homologous microsatel-lites (pure AC repeats) between human and chimp (DAC).
Figure4.—Counts of the chimp (shaded bars) and human (solid bars) microsatellites of pure AC repeats (DAC).
and 235 were pure AC repeats. This constitutes our
basic human-chimp data set. The empirical joint and modelXIwith parameters⌰Ion the three branches of marginal distributions of homologous pure AC-repeat with terminal branches of equal lengthI.DII, the data data are shown in Figures 3 and 4, respectively. We also of type II, is modeled in a similar manner, byXIIwith obtained the human genomic data of perfect (devoid its respective parameters and branch length. Thus, akin of interruptions) and isolated (at least 50 bp from the to Equation 2, our likelihood function for the data (DI, nearest dinucleotide microsatellite of length⬎4 repeat DII), where DI is a 2⫻ NImatrix, andDII is a 2 ⫻ NII units) AC repeats as described byCalabreseandDur- matrix, is
rett(2003) for comparative purposes.
To maximize the likelihood L, we transformed the L(⌰I
,⌰II
,I
,II
|(DI
,DII)) :⫽
兿
NI
i⫽1
Li(⌰I,I|DIi)
兿
NIIi⫽1
Li(⌰II,II|DIIi).
constrained parameter space to an unconstrained one
(5) and performed an unconstrained optimization using the
function Findminimum ofMathematica (Wolfram 1999). Likelihood-ratio test:Suppose ⫽(r,s)僆(⌰r,⌰s)
We explored most of the support of the parameter space is a vector ofr⫹sparameters, whererⱖ1 andsⱖ0, by partitioning it into small hypercubes and using their and we are interested in testing the null hypothesis, H0: midpoints as initial conditions to find local optima. r⫽ r0, against the alternative hypothesis, H1:r⬆r0.
Stationary distribution of one-phase models:Observe The likelihood-ratio test statistic (LRTS) given by that all the one-phase models including PL1 are special
cases of the general birth-death chain with birth and ⫺2 log sups僆⌰sL(r0,s|D)
sup僆(r,s)L(r,s|D)
death ratesbianddirepresenting the rate of expansion (6)
and contraction, respectively, of alleleiby 1 repeat unit.
is asymptotically2
rdistributed under the null
hypothe-Using the convention⌸⫺1
j⫽ (·)⫽1, the stationary
distri-sis, where the degrees of freedomris the difference in butioni, up to a normalizing factor, is given by
the number of free parameters between the two hypoth-eses, under standard conditions (Wilks 1938). The i⬀
兿
i⫺1
j⫽ bj dj⫹1
.
asymptotic distribution of the LRTS when the parameter has a boundary value is obtained fromSelfandLiang For example, for the PL1 model with birth rate␣(u,v,i) (1987).
(i,s) and death rate (1⫺ ␣(u,v,i))(i,s), Model selection: Given an a priori set of candidate models, they can be ranked from the best to the worst, i⬀
兿
i⫺1
j⫽
␣(u,v,j)(j,s)
(1⫺ ␣(u,v,j⫹ 1))(j⫹1,s) in an information-theoretic paradigm through a second-order Akaike information criterion (AICc). This ranking can help distinguish models that are nearly equally good ⬀ i
兿
⫺1j⫽
␣(u,v,j)
(1⫺ ␣(u,v,j⫹ 1))
兿
i⫺1
j⫽
(j,s)
(j⫹1,s) fitsvs. those that are poor explanations for the given dataDof sample sizeN. The best candidate model with a total ofKparameters in (⌰,) is the one that
mini-⬀ 1
1⫹(i ⫺ )s
兿
i⫺1j⫽
␣(u,v,j) (1⫺ ␣(u,v,j⫹ 1))
.
(4) mizes the quantity
Repeat-specific models:The presence or absence of
AICc:⫽ ⫺2 logL(⌰,|D)⫹ 2
冢
K⫹K(K⫹1) N ⫺K⫺1
冣
. any significant difference between the mutationalmech-(7) anisms of two distinct types of dinucleotide repeats, for
example, purevs.interrupted repeats, or different mo- We use AICc(Sugiura1978;HurvichandTsai1989), the second-order estimator of the Kullback-Liebeler in-tifs, can be investigated. The distribution ofDI, the data
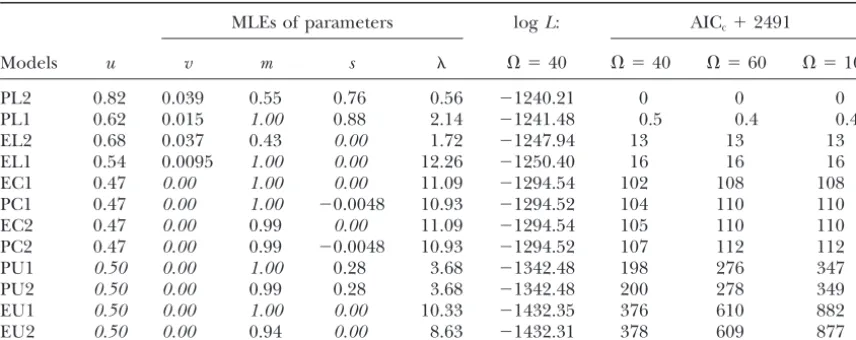
be-TABLE 1
Parameter estimation, maximum likelihood, and model ranking using species-pair data from 235 loci of AC repeats
MLEs of parameters logL: AICc⫹2491
Models u v m s ⍀ ⫽40 ⍀ ⫽40 ⍀ ⫽60 ⍀ ⫽100
PL2 0.82 0.039 0.55 0.76 0.56 ⫺1240.21 0 0 0
PL1 0.62 0.015 1.00 0.88 2.14 ⫺1241.48 0.5 0.4 0.4
EL2 0.68 0.037 0.43 0.00 1.72 ⫺1247.94 13 13 13
EL1 0.54 0.0095 1.00 0.00 12.26 ⫺1250.40 16 16 16 EC1 0.47 0.00 1.00 0.00 11.09 ⫺1294.54 102 108 108 PC1 0.47 0.00 1.00 ⫺0.0048 10.93 ⫺1294.52 104 110 110 EC2 0.47 0.00 0.99 0.00 11.09 ⫺1294.54 105 110 110 PC2 0.47 0.00 0.99 ⫺0.0048 10.93 ⫺1294.52 107 112 112 PU1 0.50 0.00 1.00 0.28 3.68 ⫺1342.48 198 276 347 PU2 0.50 0.00 0.99 0.28 3.68 ⫺1342.48 200 278 349 EU1 0.50 0.00 1.00 0.00 10.33 ⫺1432.35 376 610 882 EU2 0.50 0.00 0.94 0.00 8.63 ⫺1432.31 378 609 877
The parameters that are fixed for a given submodel are shown in italics. Free parameters take their maximum-likelihood estimates (MLEs) when⍀ ⫽40.
causeN/max {K} is small in our study (e.g.,Burnhamand constituting the fourth-best group, outperform their equal-rate, unbiased cousins, EU1 and EU2. Observe Anderson1998). When the expression in the parentheses
of the above equation is replaced byKwe get AIC. that the model ranking is unaffected by variation in the upper bound⍀except for that of the worst group. Since the AICcvalues of PL1 and PL2 are so close we resort RESULTS
to a LRT and attempt to reject PL1 in the next section. Another ranking of the submodels is performed (Ta-We initially assume a lineage-homogeneous mutational
ble 2) on the basis of the fit of their stationary distribu-process to model the distribution of the 235
homolo-tions to the empirical distribution of pure and isolated gous pairs of pure AC repeats. Thus the same Markov
AC-repeat lengths in the human genome as described chain model (i.e.,⌰a⫽ ⌰c⫽ ⌰h⫽ ⌰) is superimposed
byCalabreseandDurrett(2003). These results are on the three branches of whose terminal branches
largely consistent with those based on the human and are of equal length (i.e., c ⫽ h ⫽ ). Observe that
chimp comparison. However, when fitting a model’s for time-reversible Markov chains, such as PL1, we can
stationary distribution, due to the large sample size, any estimate only the sum of the terminal branch lengths
increase in the degrees of freedom toward a multinom-(2) along with⌰. This is because the per-locus
likeli-ial model greatly increases its likelihood. For this reason hood given by Equation 1 becomes 兺j僆SjPj,Ci()Pj,Hi()
we base our inferences on the human-chimp compari-due to lineage homogeneity and further simplifies to
son. The AIC scores are also computed for the differ-CiPCi,Hi(2) due to time reversibility. We relax, and even
ent models when the loci are restricted to those in the test, these homogeneity assumptions later when we study
human-chimp comparison. repeat-specific and lineage-specific processes.
One phasevs.two phase:The null hypothesis of the
Ranking the submodels:The submodels of Equation
simplest, one-phase model EU1 is tested against its two-3 define the set of candidate models to be ranked from
phase cousin EU2*, through a LRT. The LRTS under best to worst according to their AICcvalues using
Equa-this null hypothesis has a nontrivial mixture of 2 0,21, tion 7, on the basis of data DAC (see Table 1). Five
and2
2for its asymptotic distribution, since bothpand groupings of models are found. The best group contains
m lie on the boundary of the parameter space under the proportional-rate linear-biased models, PL1 and
the null hypothesis (SelfandLiang1987). Instead of PL2, where longer microsatellites mutate more often
analytically pursuing this asymptotic distribution under than shorter ones toward an attracting focal length. The
such nonstandard boundary conditions, we resort to second-best group comprises EL1 and EL2. In these
parametric bootstrap to obtain an approximation to the models, all microsatellites, irrespective of their repeat
finite sample distribution of the LRTS (see Figure 6A). length, mutate at the same rate toward a focal length.
On the basis of these simulations, there is not enough The third-best group comprises the constant-bias
mod-evidence to reject the one-phase hypothesis (P⫽0.16). els, namely, PC1, PC2, EC1, and EC2. In the presence of
One is unable to reject EU1 in favor of the simpler a constant downward bias in the mutational process
equal-rate two-phase unbiased model EU2 as well, since none of the other features seem to matter very much.
The proportional-rate, unbiased models, PU1 and PU2, the LRTS that is asymptotically 0.5⫹0.52
TABLE 2 hypothesis (see Figure 6C). The MLE of the focal length for the linear-bias model EL1 is 14.
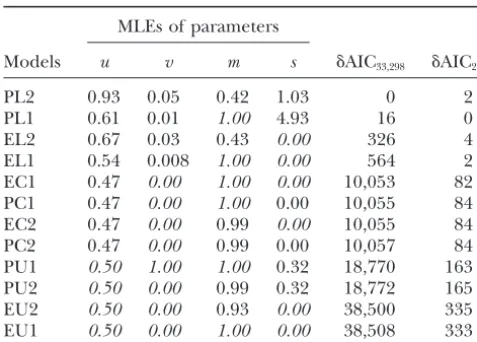
Parameter estimation and model ranking using pure
To investigate the nature of mutational bias in the
AC-repeat loci from the entire human genome
presence of rate proportionality we conducted similar LRTs. Once again absence of bias (PU1) is rejected in MLEs of parameters
favor of its presence (PC1 and PL1) and the hypothesis Models u v m s ␦AIC33,298 ␦AIC235
of constant bias (PC1) is rejected in favor of linear bias PL2 0.93 0.05 0.42 1.03 0 2 (PL1). The MLE of the focal length for the propor-PL1 0.61 0.01 1.00 4.93 16 0 tional-rate linear-bias model PL1 is 18. When more gen-EL2 0.67 0.03 0.43 0.00 326 4 eral functional forms, such as piecewise linear, quadratic, EL1 0.54 0.008 1.00 0.00 564 2 or cubic, were employed to model the dependence of EC1 0.47 0.00 1.00 0.00 10,053 82
mutational bias on repeat length, the likelihood did not PC1 0.47 0.00 1.00 0.00 10,055 84
improve significantly enough to reject the linear-bias EC2 0.47 0.00 0.99 0.00 10,055 84
model (results not shown). PC2 0.47 0.00 0.99 0.00 10,057 84
PU1 0.50 1.00 1.00 0.32 18,770 163 Rate equalityvs.proportionality:We test the hypothe-PU2 0.50 0.00 0.99 0.32 18,772 165 sis of equal mutation rates for all alleles (EU1) against EU2 0.50 0.00 0.93 0.00 38,500 335 a hypothesis of proportional rates (PU1). This LRTS is EU1 0.50 0.00 1.00 0.00 38,508 333 asymptotically2
1distributed under the null hypothesis. Thus, the null hypothesis of rate constancy among al-The parameters that are fixed for a given submodel are
shown in italics. Free parameters take their maximum-likeli- leles is rejected, in favor of a directly proportional re-hood estimates (MLEs) when⍀ ⫽ 40. Note that ⫽ ∞at lationship between mutation rate and repeat length stationarity.␦AIC33,298⫽AIC⫺190,182 for the genomic data
(sˆ⫽0.2556) in the presence of an unbiased mutation (33,298 loci), and␦AIC235⫽AIC⫺1281 for the loci restricted
process. to those used in the human-chimp comparison (235 loci).
To determine the relevance of rate proportionality in the presence of mutational bias two more LRTs are performed. In the presence of a constant bias, we failed is observed to be 0.084 (P ⫽ 0.39). Similarly, we are
to reject the null hypothesis of rate equality among al-unable to reject the null hypothesis of every other
one-leles in favor of rate proportionality (P ⫽ 0.022). In phase model, in favor of its two-phase cousin, except
the presence of linear bias, the LRTS is asymptotically in the equal-rate linear-biased case where one-phase is
distributed as2
1under the null hypothesis (see Figure marginally rejected (P⫽ 0.013). The EC2 model with
6D; Table 3). We were able to reject rate equality (EL1) p ⫽ 0, akin to a truncated version of the SMM of Fu
in favor of rate proportionality (PL1). Thus, for pure AC andChakraborty(1998), as well as PC2 and PU2
as-repeats, the proportional-rate linear-bias model (PL1) sign almost all of the probability mass to single-step
explains the data best. jumps. Hence, in these cases, we fail to reject the
one-When performing multiple LRTs in a nested setting, phase hypothesis that m ⫽ 1 in favor of a two-phase
the order in which such tests are done could affect the hypothesis that 0⬍ m ⬍ 1. Among the best group of
final conclusions drawn. We are assured, however, that models, PL1 and PL2, there is inconclusive evidence
this order has not influenced our conclusions, since the against one-phase asP⫽0.06 (see Figure 6B). Further- results of model selection are consistent with those of more, there is even less evidence in the data to reject the hypothesis tests. All conclusions drawn above using PL1 in favor of the most general model (P⫽0.23). The the LRTs are robust to changes in the upper bound⍀ profile log-likelihood ofmunder the PL2 model is fairly (results not shown).
flat with a wide confidence interval ([0.42, 1]) contain- So far we have used only pure AC-repeat data (D AC) for ing 1. By walking 2 log-likelihood units on either side inference and assumed homogeneity in the mutational of the maximum-likelihood value along the profile log- mechanisms across the loci. In doing so, we have ig-likelihoods, we obtain confidence intervals of the pa- nored interlocus variation and could not address possi-rametersu,v,s, andof the PL1 model (Figure 5). ble motif-specific and interruption-induced
complica-Mutational bias:The absence of any mutational bias tions. Such issues are examined below using PL1, which as embodied by EU1 is first rejected in favor of the con- emerged earlier as the best model.
stant-bias model EC1. The maximum-likelihood esti- Interlocus rate variation: The possible presence of mate (MLE) of the constant upward bias parameteruˆ⫽ variation in mutation rate among loci of pure AC repeats 0.4650. EU1 is also rejected in favor of the linear bias is investigated next. Sinceis estimable as the product
model EL1. ofandt, variation in mutation rate () translates to
The hypothesis of constant mutational bias for all variation in, as the number of generations (t) remains alleles,i.e., EC1, is rejected in favor of the linear-bias identical for all loci. We model three equiproportionate model EL1 in the absence of rate proportionality. This classes of loci, 1, 2, and 3, with distinct mutation rates reflected by1,2, and3, respectively. We are unable LRTS is asymptotically distributed as2
Figure 5.—Profile log-likelihood of the parametersu,v,s, andof the best model, PL1.
to reject the null hypothesis of equal rates across loci, mutational mechanisms, H1:uAC⬆uiAC,vAC⬆viAC, and
sAC⬆siAC, since the asymptotically2
3-distributed LRTS H0: ⫽ 1⫽ 2⫽ 3, in favor of interlocus rate variation,
H1: 0⬍ 1ⱕ 2, 0⬍ 2 ⬍∞, and2 ⱕ 3⬍ ∞, as the is observed to be 26.27. The MLE of the focal length for AC repeats is still 18 but that of the iAC repeats is asymptotically 2
2-distributed LRTS is observed to be
0.67 (P⫽0.73). We could not reject an equal-rate model longer at 21.
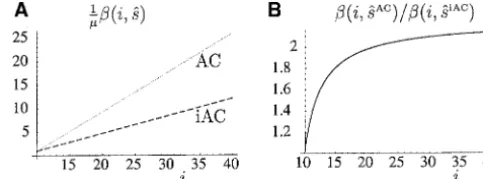
The scaled mutation rate (1/)(i,s) is plotted as a in favor of a model with two classes (P ⫽0.46).
Interruption-induced variation:We study possible ef- function of repeat length using the MLEs of the propor-tional-rate parameters for pure AC repeats (sˆAC⫽0.83) fects of an interruption by a point mutation on the
evo-lution of otherwise pure AC repeats. Recall that the and iAC repeats (sˆiAC ⫽ 0.37) in Figure 7A. The ratio of the MLE of mutation rate of AC repeats over that of repeat length of iAC repeat is counted ignoring the
interruption. As in the previous section, the stochastic iAC repeats, which asymptotes to 0.83/0.37 ⫽ 2.24, is plotted in Figure 7B. The null hypothesis H0of identical dynamics of pure AC repeats are described by a
propor-tional-rate linear-biased one-phase model with parame- mutational processes in AC and iAC repeats is also re-jected against a simpler alternative that assumes identi-tersuAC, vAC,sAC, and , and those of the iAC repeats
are described by another such model with parameters cal bias parameters u andv but distinct proportional-rate parameterssACandsiAC. For this test the LRTS that
uiAC, viAC, siAC, and . By calculating the likelihood
ac-cording to Equation 5, we test hypotheses through LRTs. is asymptotically distributed as2
1is observed to be 14.56.
Mutation rate estimation:Assuming 5.5 million years The null hypothesis of an identical mutational
mecha-nism between pure AC repeats and iAC repeats, H0:u⫽ since human-chimp speciation and an average lifetime of 20 years for the two species leads to an estimate of uAC⫽uiAC,v⫽vAC⫽viAC, ands⫽sAC⫽siAC, is successfully
rejected in favor of the alternative, which allows distinct 275,000 generations since speciation. Since ⫽ /tin
TABLE 3
Some hypothesis tests of time-homogeneous models through likelihood ratios
Asymptotic
LRT H0vs. H1 distributiona LRTS P
1 EU1vs. EU2 0.502⫹0.512 0.084 0.39
2 EU1vs. EU2* Simulatedb 1.060 0.16
3 EL1vs. EL2 0.502⫹0.521 4.92 0.013 Figure 7.—(A) Scaled mutation rates, (1/)(i, sˆAC) for 4 PL1vs. PL2 0.502⫹0.521 2.54 0.055 pure AC repeats (shaded line) and (1/)(i,sˆiAC) for once-5 EU1vs. EC1 12 275.62 Ⰶ0.01 interrupted iAC repeats (dashed line), as a function of repeat length under the PL1 model. (B) The rate ratio(i,sˆAC)/(i,
6 EU1vs. EL1 22 363.91 Ⰶ0.01
sˆiAC) as a function of repeat lengthi.
7 EC1vs. EL1 12 88.27 Ⰶ0.01
8 EU1vs. PU1 12 179.75 Ⰶ0.01
9 EC1vs. PC1 12 0.022 0.88
10 EL1vs. PL1 12 17.84 Ⰶ0.01 expansion along the human lineage is difficult to dis-cern from that of a biased contraction along the chimp
aThe expected asymptotic behavior of the likelihood-ratio
test statistic (LRTS) under H0, with⍀ ⫽40. lineage without knowledge of the stationary distribution
bSimulated finite sample distribution (Figure 6A).
of the ancestor or repeat length data at homologous loci in an additional outgroup species. In light of additional evidence from a human-chimpanzee-baboon study by our formulation, its MLE ˆ ⫽ ˆ/(2.75 ⫻ 105). Thus
Websteret al.(2002), which suggests that the dinucleo-the MLE of dinucleo-the allele-specific mutation rate(i, sˆ)⫽
tide repeats in chimpanzees and baboons are similar ˆ (1 ⫹(i⫺10)sˆ) is obtained.
and a change in the mutational process is more likely To compare ˆ with the estimates of mutation rates
to have happened along the lineage leading to humans, in the literature (which is done in thediscussion) we
we introduce nonhomogeneity by constraining the an-obtain an average rate* ⫽兺iˆi(i,sˆ), whereˆiis the
cestral mutational mechanism to be identical to that of stationary probability of alleleiunder the MLEs of the
chimp. Moreover, the nonhomogeneous models that model. For the best model (PL1)* is 4.87⫻10⫺5per
impose identical mutational mechanisms between the locus per generation and for the worst model (EU1) it
human and the ancestral lineages do not have better is 23% less at 3.76⫻ 10⫺5.
AICcscores (results not shown). The confidence intervals of [1.1, 4.5] and [0.32, 1.8]
We marginally reject (P⫽0.018) the null hypothesis forands, respectively, translate to a confidence
inter-of identical mutational mechanisms for the ancestor, val of [1.3⫻10⫺5, 1.8⫻10⫺4] for the average per-locus
chimp, and human microsatellites of the pure AC re-per-generation mutation rate of pure AC repeats under
peats (PL1 model) in favor of an alternative hypothesis the PL1 model.
of almost identical mechanisms for the three lineages
Lineage-specific variation:Here, we relax the
assump-with the exception of a distinct proportional-rate param-tion of lineage homogeneity that⌰a ⫽ ⌰c⫽ ⌰h ⫽ ⌰
etershfor the human lineage (PL1x). Since the various and allow distinct Markov chain models to be
super-alternatives are not nested we resort to AICc to rank imposed on distinct branches of. We study
lineage-the models. The better-performing nonhomogeneous specific differences in the mutational mechanism only
models decrease the mutation rate (by decreasing sh) for the PL1 model. By superimposing a
proportional-for longer human microsatellites relative to that of the rate linear-biased one-phase model with parametersua,
chimps and/or increase the focal allele of humans by va, andsaupon the ancestral branch; another such model
1 or 2 repeat units as evident from Table 4. Similar two-with parametersuc,vc, andscupon the chimp branch;
phase nonhomogeneous models did not perform better and finally another with parametersuh,vh, andshupon
than PL1x(results not shown).
the human branch, we address lineage-specific
differ-We were also able to fit nonhomogeneous models ences in the mutational mechanism of pure AC repeats.
much better to the empirical distribution of isolated Naturally, the lineage-homogeneous models studied
pure AC repeats from human genomic data. A nonho-thus far, in which all three branches have superimposed
mogeneous PL1 model with seven parameters had a upon them three Markov chain models with identical
log-likelihood value of ⫺95050.02 and outperformed parameters (u ⫽ ua ⫽ uc ⫽ uh, v ⫽ va ⫽ vc ⫽ vh,
the time-homogeneous PL2 model from Table 2 by 96 ands⫽sa⫽sc⫽sh), embody the essence of identical
AIC units. The MLEs (not shown) suggest a scenario of mutational mechanisms along the three lineages and
ongoing repeat expansion in humans. Figure 8 shows constitute our null hypothesis of lineage homogeneity
the fits of the homogeneous and nonhomogeneous PL1 in the mutational process. However, there are numerous
models to the empirical distribution of the AC repeats ways to model lineage-specific differences in the
TABLE 4
Lineage-specific model ranking
Lineage-specific parameters
Models K u uh v vh s sh m logL ␦AICc
PL1x 5 0.63 0.63 0.016 0.016 1.40 0.0184 1 2.62 ⫺1238.72 0.0
PL1y 7 0.63 0.68 0.016 0.020 1.26 0.42 1 2.23 ⫺1237.83 2.5
PL1z 5 0.63 0.65 0.016 0.016 0.88 0.88 1 2.10 ⫺1240.12 2.8
PL2 5 0.82 0.82 0.04 0.04 0.76 0.76 0.55 0.56 ⫺1240.21 3.0
PL1 4 0.62 0.62 0.015 0.015 0.88 0.88 1 2.14 ⫺1241.48 3.4
Kdenotes the number of parameters in a model and␦AICc⫽AICc⫺2487.70. Parametersuh,vh, andshare for the human lineage, andu, v, andsare for the chimp and ancestral lineages. Estimates shown in italics are fixed to be identical along all three lineages. The MLEs, logL, and AICcare computed when⍀ ⫽40.
DISCUSSION form significantly better than homogeneous models, it is reasonable to assume that identical mutational mecha-Species-pair data from humans and chimps provide
nisms for microsatellites of the same motif can model opportunities for analyzing microsatellite evolution not
our data. found in population genetic data or genomic data from
Different models can give rise to similar equilibrium a single species. A population’s demography determines
distributions despite distinct finite-time transition prob-the distribution of its genealogy, which in turn accounts
abilities. Thus any inference based on genomic data for the correlation among homologous alleles in a
popu-from one species is limited to parametric families of lation sample. Thus strong demographic assumptions
models whose members have distinct equilibrium distri-have to be made (Nielsen 1997) to reject one model
butions (Menendezet al.1999). However, this approach of microsatellite evolution in favor of another. Our
in-currently has the advantage of larger data sets over our ferences are based on a sample of size 1 from each
spe-species-pair approach, as the chimp genome is not yet cies and thus do not rely on assumptions regarding the
fully sequenced. We provide a framework for hypothesis demographic history of the analyzed populations. If the
tests directed at a mechanistic understanding of the microsatellites themselves are undergoing neutral
evo-mutational process of microsatellites using information lution, then the species-pair data are unaffected by
selec-about their divergence. tive sweeps due to samples of size 1 per locus from each
Our analysis indicates that bias in the mutational pro-species. Thus conditional on the divergence time, we may
cess and proportionality in mutation rate are vital for safely assume independence across loci. We have also
realistic stochastic models of evolution of pure dinucleo-assumed that microsatellites of a particular motif share
tide repeats. The models with a linear bias toward a focal a common mutational mechanism. Due to our small
sam-length, in the spirit ofGarzaet al.(1995), constitute the ple size we are unable to allow locus-specific
heterogene-top four models. This suggests an important role for bias ity in all the parameters of the mutational model. Since
toward a target length in microsatellite evolution using the simplest mixture models that allow interlocus
varia-tion in mutavaria-tion rate for pure AC repeats do not per- interspecies divergence data, consistent with the study
ofGarza et al.(1995) and Zhivotovsky et al.(1997) holding time of longer alleles and thereby further reduc-ing their stationary probability. In fact, the small nega-based on population data, and further affirms the
find-ings of Calabrese and Durrett(2003) that propor- tive value taken by the proportional-rate parameter (sˆ⫽ ⫺0.0048) reflects some level of restoration of probability tional slippage is not sufficient in the absence of
muta-tional bias to explain the human genomic microsatellite mass to longer alleles, countering the effects of geomet-ric decay caused by constant bias. In the absence of any length distribution. Finally, using data from
parent-off-spring transmissions of AC repeats, Whittaker et al. mutational bias, on the other hand, the ratio term␣(u, v,j)/(1⫺ ␣(u,v,j⫹1)) in the finite product of Equa-(2003) also showed that contractions become more
likely for microsatellites⬎20 repeats while expansions tion 4 simplifies to 1 for all alleles and thus makes the effects of proportionality pronounced. Any increase become frequent for shorter repeats.
The linear bias may be construed as a signature of from 0 in the proportional-rate parameter sshifts the probability mass away from being uniformly distributed underlying counteracting forces in the mutational
mecha-nism,i.e., upward mutation bias of primary slippage mu- among all alleles toward shorter alleles, reflecting their increased mean holding times relative to longer alleles. tations countered by the downward mutation bias at
longer alleles due to the mismatch repair system (Harr Similarly, under linear bias, the effects of proportional-ity are pronounced as this finite product has terms both et al.2002). Since the effects of mutational and
substitu-tional processes are confounded in our human-chimp ⱖ1 and⬍1 for longer alleles. Thus, rate proportionality cannot be ignored even in the presence of linear bias. data, natural selection could also be contributing to the
downward bias by acting directly against longer micro- The truncated TPM of DiRienzo et al. (1994) fits the pure AC-repeat data by essentially mimicking the satellites if they confer some selective disadvantage or by
acting indirectly upon the mismatch-repair machinery truncated SMM ofOhtaandKimura(1973). The two-phase models generally mimic their one-two-phase cousins, itself. However, similar findings in the pedigree studies
ofWhittakeret al.(2003) suggest that linear bias may as reflected by their values ofmˆ being close to 1. Our in-ability to reject one-phase in favor of two-phase using truly be a signature of the microsatellite mutational
process alone. human-chimp data is in contrast with experimental
ob-servations of multistep mutations. There are several ex-The biased models are robust to variation in the upper
bound⍀, as is evident from their stable AICcvalues for planations for this. First, noise in repeat length estimates due to indel activity in the flanking region may be at larger⍀, due to the presence of a downward or focal
bias. The unbiased models, on the other hand, do con- least partly responsible for elevating the experimentally observed proportion of multistep mutations. Empiri-siderably worse for larger values of⍀, because as
micro-satellites mutate without preferring contractions over cal studies usually keep track of the length of a micro-satellite repeat along with its flanking sequence (PCR expansions, they distribute themselves uniformly over
the entire state space as time progresses. Thus, when⍀ fragment length), rather than the actual repeat length. Studies have found both interspecific and intraspecific is large, microsatellites can attain unrealistically large
repeat lengths under the unbiased models. The lower fragment length polymorphism to be caused by indels in the flanking regions (AngersandBernatchez1997; boundarywas chosen to be 10 because we wanted it
to be higher than the threshold at which slippage is Matsuokaet al.2002). Thus, on a cautionary note, indels in the flanking sequence could be construed as multi-empirically observed to occur (typically 8 repeat units).
For one-phase models that allow jumps of only a single unit microsatellite mutations if repeat lengths are di-rectly extrapolated from the PCR fragment length. Most repeat unit at a time, the choice of the lower boundary
poses little problem. One may view this, in the queuing studies that found two-phase models to produce better fits than their one-phase cousins used some transforma-theory terminology, as a harmless effect on the total
num-ber of customers entering the system from the lower tion of the PCR fragment length for their data. Since the evolution of such microsatellite-containing PCR boundary but not on their relative numbers (Calabrese
et al.2001). However, in more complicated models that fragment lengths is influenced by the local indel activity as well as the true microsatellite mutations, it becomes allow microsatellites to enter the truncated state space
at several distinct repeat lengths, inference can be sensi- difficult to make inference on the nature of two-phase mutations inherent to microsatellites alone with such tive to the choice of the lower boundary.
Among the one-phase models, rate proportionality PCR fragment length data. On the other hand, two-phase models may be more appropriate than one-two-phase gives a better fit to the data than rate equality among
alleles in the presence of an unbiased or a linear-biased models for such PCR-extrapolated data as shown in a recent study byWhittakeret al.(2003).
mutational process. However, it does not do so in the
presence of a strong constant downward bias (uˆ⫽0.46). Second, the lack of evidence for our two-phase models should really be seen as the rejection of a homogeneous Under a constant downward bias, most of the probability
mass under stationarity is already piled over shorter two-phase mechanism that is insensitive to repeat length in favor of a homogeneous one-phase mechanism. We alleles, and thus any increase in rate proportionality
DiRienzoet al.(1994) and an SMM ofFuandChakra- those invoking selection to explain lineage-specific dif-ferences in the evolution of pure dinucleotide repeats. borty (1998). However, other formulations of a
two-These methods can be extended to more species as phase mutational mechanism, particularly those that
more primate sequences become available. One can test allow the probabilitypof single-step mutations and/or
hypotheses and estimate parameters in a locus-specific the success probabilitymof the conditional geometric
as well as lineage-specific manner simultaneously. In par-distribution specifying the lengths of multistep jumps
ticular, as data for primates accrue, it would be biologi-to decrease with repeat length, may be more realistic,
cally relevant to use more general functional forms to especially in light of empirical evidence for large
con-model mutational bias as well as the nature of two-phase tractions being more common among long alleles in yeast
mutations. One may further use such species-specific (Wierdl et al.1997) and fruit fly (Harret al.2002). As
and motif-specific parameter estimates in various popu-more of the chimp genome gets sequenced such varying
lation genetic inferences. The impact of model misspeci-two-phase models should be tested to further evaluate
fication on signals of selective sweeps from microsatellite the importance of multistep mutations.
variation also needs to be investigated. There is a twofold decrease in the slippage rate and
a 6-bp increase in the focal length of an AC repeat R.S. thanks William Amos, Dave Capella, Lounes Chikhi, Floyd Reed, Guy Reeves, Gennady Samorodnitsky, James Signorovitch, and Robert
interrupted by just one point mutation relative to a pure
Strawderman for insightful discussions. R.S. is supported by the
Inte-repeat. This is not surprising as a point mutation is
grative Graduate Education, Research and Traineeship from National
expected to create fewer opportunities for polymerase
Science Foundation (NSF) grant DGE-9870631; NSF grant
DEB-slippage and thereby decreases mutation rate as demon- 0089487 to R. Nielsen; and NSF/National Institutes of Health grant strated in yeast (Petes et al. 1997). Moreover, longer DMS/NIGMS 0201037 to R. T. Durrett, C. F. Aquadro, and R. Nielsen.
repeats are more prone to getting interrupted by point mutations. Upon interruption, they are less likely to mutate and thereby contract, due to linear bias toward
LITERATURE CITED the focal length, as much as the pure repeats.
Amos, W., S. J. Sawcer, R. W. FeakesandD. C. Rubinsztein, 1996
Our mutation rate estimates are not significantly
dif-Microsatellites show mutational bias and heterozygote instability.
ferent from the empirical estimates of per-locus rates Nat. Genet.13:390–391.
Angers, B., andL. Bernatchez, 1997 Complex evolution of a
salmo-of 6⫻10⫺4 for autosomal dinucleotide repeats (
Elle-nid microsatellite locus and its consequences in inferring alleleic
gren 2000b) and 2.3 ⫻ 10⫺4 for CA repeats (
Petru-divergence from size information. Mol. Biol. Evol.14:230–238.
khin et al. 1993). Empirical overestimates of the true Bre´maud, P., 1999 Markov Chains, Gibbs Fields, Montecarlo Simulations and Queues. Springer-Verlag, New York.
mutation rate may result from sampling bias toward
Burnham, K. P., andD. R. Anderson, 1998 Model Selection and Infer-highly polymorphic loci, which are typically also the
ence: A Practical Information-Theoretic Approach. Springer-Verlag,
fastest mutating. If the loci chosen to estimate mutation New York.
Calabrese, P. P., andR. T. Durrett, 2003 Dinucleotide repeats
rate empirically have longer alleles on average, then an
in the Drosophila and human genomes have complex,
length-overestimation of the true average may result. The
sam-dependent mutation processes. Mol. Biol. Evol.20:715–725.
ple in our study is small for reliable mutation rate esti- Calabrese, P. P., R. T. DurrettandC. F. Aquadro, 2001 Dynamics
of microsatellite divergence. Genetics159:839–852.
mates as reflected in the large confidence interval of
Cooper, G., D. C. RubinszteinandW. Amos, 1998 Ascertainment
[1.3⫻10⫺5, 1.8⫻10⫺4].
bias cannot entirely account for human microsatellites being
There is evidence in the human-chimp data as well longer than their chimpanzee homologues. Hum. Mol. Genet.
7:1425–1429.
as in human genomic data to reject lineage
homogene-DiRienzo, A., A. C. Peterson, J. C. Garza, A. M. Valdes, M. Slatkin
ity in favor of lineage-specific variation in the evolution
et al., 1994 Mutational processes of simple-sequence repeat loci
of pure AC repeats. The effects of increase in focal allele in human populations. Proc. Natl. Acad. Sci. USA91:3166–3170. Ellegren, H., 2000a Heterogeneous mutation processes in human
length and decrease in mutation rate for longer alleles
microsatellite DNA sequences. Nat. Genet.24:400–402.
along the human lineage relative to those along the
Ellegren, H., 2000b Microsatellite mutations in the germline:
im-chimp lineage are consistent with other studies (Cooper plications for evolutionary inference. Trends Genet.16:551–558. Feldman, M. W., A. Bergman, D. D. PollockandD. B. Goldstein,
et al. 1998;Webster et al. 2002). One possible
expla-1997 Microsatellite genetic distances with range constraints:
nation is that the human mismatch-repair system is not analytic description and problems of estimation. Genetics145: as efficient as that of the chimp. As has been pointed 207–216.
Fu, Y., andR. Chakraborty, 1998 Simultaneous estimation of all
out by Harr et al. (2002), subtle differences in the
the parameters of a step-wise mutation model. Genetics150:487–497.
mismatch-repair system between two species could give Garza, J. C., M. SlatkinandN. B. Freimer, 1995 Microsatellite rise to distinct mutational biases. An equally compatible allele frequencies in humans and chimpanzees, with implications
for constraints on allele size. Mol. Biol. Evol.12:594–603.
explanation is selection against longer repeats and the
Harr, B., andC. Schlo¨ tterer, 2000 Long microsatellite alleles in
differences in the effective population size (Ne) between Drosophila melanogasterhave a downward mutation bias and short the two species. A lower value ofNein humans could de- persistence times, which cause their genome-wide
under-repre-sentation. Genetics155:1213–1220.
crease the relative effectiveness of selection. Additional
Harr, B., J. TodorovaandC. Schlo¨ tterer, 2002 Mismatch
repair-data are required to distinguish between hypotheses pur- driven mutational bias inD. melanogaster.Mol. Cell10:199–205.
Huang, Q., F. Xu, H. Shen, Q. Deng, Y. Liuet al., 2002 Mutation
patterns at dinucleotide microsatellite loci in humans. Am. J. Directional evolution in germline microsatellite mutations. Nat.
Genet.13:391–393.
Hum. Genet.70:625–634.
Hurvich, C., andC.-L. Tsai, 1989 Regression and time series model Rose, O., andD. Falush, 1998 A threshold size for microsatellite
expansion. Mol. Biol. Evol.15:613–615.
selection in small samples. Biometrika76:297–307.
Jarne, P., andP. Lagoda, 1996 Microsatellites, from molecules to Self, S. G., andK. Liang, 1987 Asymptotic properties of maximum likelihood estimators and likelihood ratio tests under
nonstan-populations and back. Trends Ecol. Evol.11:424–429.
Kruglyak, S., R. T. Durrett, M. D. SchugandC. F. Aquadro, 1998 dard conditions. J. Am. Stat. Assoc.82:605–610.
Sugiura, N., 1978 Further analysis of the data by Akaike’s informa-Equilibrium distributions of microsatellite repeat length resulting
from a balance between slippage events and point mutations. tion criterion and the finite corrections. Comm. Stat. Theor.
Meth.A7:13–26.
Proc. Natl. Acad. Sci. USA95:10774–10778.
Matsuoka, Y., S. E. Mitchell, S. Kresovich, M. GoodmanandJ. Tachida, H., andM. Iizuka, 1992 Persistence of repeated sequences
that evolve by replication slippage. Genetics131:471–478.
Doebley, 2002 Microsatellites inZea—variability, patterns of
mutations, and use for evolutionary studies. Theor. Appl. Genet. Walsh, J. B., 1987 Persistence of tandem arrays: implications for
satellite and simple-sequence DNAs. Genetics115:553–567.
104:436–450.
Menendez, M. L., D. Morales, L. PardoandI. Vajda, 1999 Infer- Webster, M. T., N. G. C. SmithandH. Ellegren, 2002 Microsatel-lite evolution inferred from human-chimpanzee genomic sequence ence about stationary distributions of Markov chains based on
divergences with observed frequencies. Kybernetika35:265–268. alignments. Proc. Natl. Acad. Sci. USA99:8748–8753.
Whittaker, J. C., R. M. Harbord, N. Boxall, I. Mackay, G. Dawson Nauta, M. J., andF. J. Weissing, 1996 Constraints on allele size at
microsatellite loci: implications for genetic differentiation. Genet- et al., 2003 Likelihood-based estimation of microsatellite
muta-tion rates. Genetics164:781–787.
ics143:1021–1032.
Nielsen, R., 1997 A likelihood approach to population samples of Wierdl, M., M. DominskaandT. D. Petes, 1997 Microsatellite instability in yeast: dependence on the length of the
microsatel-microsatellite alleles. Genetics146:711–716.
Ohta, T., andM. Kimura, 1973 A model of mutation appropriate lite. Genetics146:769–779.
Wilks, S. S., 1938 The large-sample distribution of the likelihood to estimate the number of electrophoretically detectable alleles
in a finite population. Genet. Res.22:201–204. ratio for testing composite hypotheses. Ann. Math. Stat.9:60.
Ouellette, B. F. F., andM. S. Boguski, 1997 Database divisions Wolfram, S., 1999 The Mathematica Book, Ed. 4. Cambridge
Univer-and homology search files: a guide for the perplexed. Genome sity Press, Cambridge, UK.
Res.7:952–955. Xu, X., M.Peng, Z.Fangand X.Xu, 2000 The direction of
micro-Petes, T. D., P. W. GreenwellandM. Dominska, 1997 Stabilization satellite mutation is dependent upon allele length. Nat. Genet.
of microsatellite sequences by variant repeats in the yeastSaccharo- 24:396–399.
myces cerevisiae.Genetics146:491–498. Zhivotovsky, L. A., M. W. FeldmanandS. A. Grishechkin, 1997
Petrukhin, K. E., M. C. Speer, E. Cayanis, M. F. Bonaldo, U. Tan- Biased mutations and microsatellite variation. Mol. Biol. Evol. travahi et al., 1993 A microsatellite genetic linkage map of 14:926–933.
human chromosome 13. Genomics15:76–85.