Predictive Models for Identifying Software Components Prone to Failure During
Security Attacks
Michael Gegick, Laurie Williams, Mladen Vouk Department of Computer Science
North Carolina State University, Raleigh, NC 27695 {mcgegick, lawilli3, vouk}@ncsu.edu
Abstract
Sometimes software security engineers are given a product that they not familiar with, but are asked to have a security analysis done for it in a relatively short time. An early knowledge of where the most
vulnerable regions of a software-based system are likely to reside can help prioritize their efforts. In general, software metrics can be used to predict fault- and failure-prone components for prioritizing inspection, testing, and redesign efforts. We believe that the security community can leverage this knowledge to design tools and metrics that can identify vulnerability- and attack-prone software components early in the software life cycle. We analyzed a large commercial telecommunications software-based system and found that the presence of security faults correlates strongly with the presence of a more general category of reliability faults. This, of course, is not surprising if one accepts the notion that security faults are in many instances a subset of a reliability fault set. We discuss a model that can be useful for identifying attack-prone components and for prioritizing security efforts early in the software life-cycle.
Introduction
Software reliability engineering is concerned with the design, delivery and maintenance of software at a reliability level requested by a customer [11]. In the past, principal concerns revolved around functional and performance reliability, availability and dependability. However, in recent years, the spotlight also includes system security.
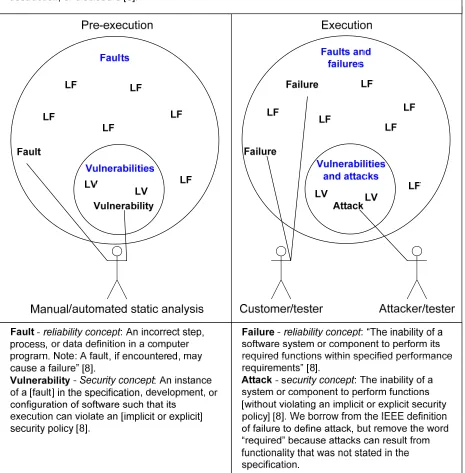
In the general reliability realm, static and dynamic software metrics can be used to successfully predict and failure-prone components relatively early in the software life cycle (SLC), e.g. [13, 17] . A fault-prone component is very likely to contain faults [4]. A failure-fault-prone component is very likely to exhibit execution-time anomalous behavior or failure due to a fault [16]. However, if faulty code is never executed, or otherwise exploited, the component will not fail. In the context of security, and this paper, we call a fault (of either commission or omission) that can result in a security event a vulnerability. If such a fault is exploited in the field through a security attack the software experiences a security failure. If that happens often, we say that the software is attack-susceptible or attack-prone.
A predictive capability that identifies fault- and failure-prone components early in the software life cycle can present a significant advantage to a software organization because the costs of finding and fixing problems increase superlinearly as one progresses through the SLC [3]. Prediction models can illuminate these problematic components for software engineers to prioritize testing, inspections, and re-design and thus mitigate the most significant problems first. However, inspection of all fault-prone components may
cause the development team to expend valuable and limited verification resources in low risk areas of the code that, while identified as fault-prone, in reality may be of sufficiently high quality in the context of a normal operational profile (or usage) [11]. Identification of failure-prone components may reduce that overhead by focusing on software behaviors in the context of the expected operational profile.
configuration/environment, or makes another change in a future revision of the software (the latter is known as the “next release effect” [9, 10]).
Figure 1. Defining security as a subset of reliability. LF (latent fault) and LV (latent vulnerability).
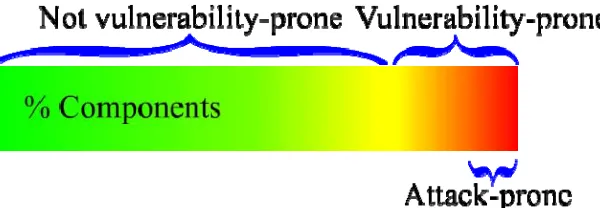
component. However, there is a danger that vulnerability-finding techniques can lead verification efforts to waste resources in low attack risk areas – areas that may be adequately fortified, may be uninteresting to an attacker, or contain difficult-to-exploit vulnerabilities. Attack-prone prediction models may help focus vulnerability-finding efforts. For example, one could assume that if a component has a low index of vulnerability-proneness, it also has a low index of attack-proneness. One could also assume that most of the security problems will be in a small percentage of the software components according to the Pareto law [6] as illustrated in Figure 2. While this general finding is supported by statistical evidence [1] it may not be always true. It is quite possible that field security failures, even very serious ones, derive from components which are not predicted to be either fault- or failure-prone nor vulnerability- or attack-prone.
Figure 2. Most security problems are found in a small percentage of the software components.
In this paper, we compare the predictive values of external metrics (failure report counts) to the values the internal metrics (static analysis tool warnings, code churn, and SLOC) we found in our
previous study, “Predicting Attack-prone components with Internal Metrics.” We used data collected for a large commercial software telecommunications product. Our results should not be interpreted as
applicable to all software because they are based upon the data from only one, though very large, software system.
Data
We analyzed a large industrial telecommunications software system containing over 1.2 million lines of C/C++ source code that had been deployed in the field for two years. Customers required that the system be highly reliable and secure. The system contained 38 well-defined components whereby each component consisted of multiple source files. A full set of information necessary for our analysis was only available for 25 (66%) of the components of the system, and thus the study focuses on those components.
The system we studied was scanned by the static analysis tool FlexeLint. We term the use of static analysis tools automated static analysis or ASA. Although FlexeLint is a reliability-focused ASA tool, we sought to determine if the reliability alerts could be early warnings of security vulnerabilities on a per component basis. For our analysis we were provided with both audited and un-audited output from FlexeLint. The vendor we worked with outsources the FlexeLint auditing process. The audited output contained an enumeration of true positive alerts (those alerts that could actually cause software failure). The un-audited report included all true and false positive alerts (code the tool misclassified as a problem) from FlexeLint and the component in which the alert was found. We used both audited and un-audited alerts our models. We considered that three types of FlexeLint alerts buffer overruns, memory leaks, and null pointers as potential security faults because the system contained vulnerabilities due to these issues. The remaining alerts in the audited and un-audited FlexeLint output were considered non-security-based alerts. This type of analysis errs on the non-conservative side, but reduces false alerts.
failure reports explicitly identified the component where the fault or vulnerability was fixed. The second type of report enumerated ASA alerts. ASA can be performed early in the software life cycle and has been shown to be good predictors of fault- and failure-proneness of components [12, 18].
We also scrutinized failure reports that were explicitly labeled as security related (approximately 0.5%) by either internal testers or security engineers. Failure reports that were explicitly tagged as security problems but could do no harm were classified as non security-problems. For example, we did not classify a failure report as a security problem if a security mechanism inadvertently denied access to all users. For the remainder of the failure reports the first author and an additional research assistant, both doctoral students in software security, independently reviewed each pre- and post-release failure report and classified a failure report as a security problem using the four decision categories listed below. We based our criteria on system functionality and the content of the failure reports that detailed the impact. If there was no conclusive evidence that the failure was due to a security vulnerability, then we classified the report as a non-security problem. The software vendor has since fixed all of the faults in the failure reports.
We found that many reports contained the following keywords often seen in security literature: crash, denial-of-service, access level, sizing issues, resource consumption, data loss, flooding, integrity, overflow, null problems, overload, protection, and leakage. These keywords increased our suspicion that a failure could be a security problem, but did not necessarily indicate a security problem. We compiled a list of these keywords and used it to match against all failure reports that were not explicitly labeled as a security problem.
We decided to use the following four categories of security failures.
• Remote attacks. The failure reports explicitly indicated whether the failure was due to a remote user or machine. Pre- and post-release failure reports that contained security-related keywords and could be remotely initiated had the highest probability of an exploitable vulnerability.
• Insider attacks. If the failure report did not indicate that a failure was due to an external user or machine, then we looked for attacks that did not require remote access to the system. For example, one report indicated that an insider attack was possible if a disgruntled employee was to abuse a privilege in the system.
• Audit capability. Weak or absent logging of important information was considered a security vulnerability. An example is inadequate logging of a financial transaction that may result in an attacker obtaining a service for free. The absence of logs has been demonstrated as a security problem when audits are required to identify an attack [14].
• Security documentation. We also considered whether fundamental principles of software security were followed. For instance, in two failure reports testers indicated that a problem would occur if the users were not “well-behaved.” This breaks the principle of Reluctance to Trust [2]. Additionally, we
also looked to see whether documented descriptions of vulnerabilities could apply (e.g. those listed in the Common Weakness Enumeration at http://cwe.mitre.org), or if any documented attack patterns [7] could match to the software.
Models
The models we developed are an extension of the concepts and models discussed in [8]. In developing our models we manually classified the 25 components into failure-prone and attack-prone based on the reported severity levels of the failures in the components. There were two types of failure- and attack-prone components; those that contained failures identified by testing before release and those that contained failures identified by customers after release. The vendor we worked with used a four-tier hierarchy for classifying failure reports. Priority 1 failure (P1) is the most severe failure while P4 is the least severe. A P1 or P2 were considered “show stoppers” by the vendor so we used that threshold for our classification of failure-prone components. All of the components with pre-release failure reports had at least one P1 or P2 failure report and thus we classified them as pre-release failure-prone components. Components with no failure reports were classified as not failure-prone. Post-release failure-prone components were those components that had at least one post-release failure reported by a customer because each had at least one P1.
We manually classified pre-release attack-prone components as those components with at least one pre-release test failure that was considered to be a security problem. We use attack-prone instead of
vulnerability-prone because a tester discovered the vulnerability during program execution. Post-release attack-prone components were those having at least one security-based post-release failure. The threshold of just one attack can create extraordinary damages such as brand damage and loss of market share and we thus chose one as a threshold. We could not verify from the failure reports whether the security-based post-release failures reported by customers were attacks that led to an attacker reaching their goal. However, when according to the failure reports and vendor security engineers, vulnerability could have been exploited we considered the failure an “attack” in the context of our model construction. It is worth noting that no real attacks were reported by the organization for the software system. We had ten pre-release attack-prone components. Four of the pre-release attack-prone components were classified as post-release attack-prone.
To construct our models, we used recursive partitioning (RP). We performed two RP analyses on our data; one for pre-release attack-prone component classification and one for post-release attack-prone component classification. Both analyses incorporated the following internal and external metrics:
a) ASA produced internal metrics of
i. count and density of null pointer, memory leak, and buffer overflow alerts (both audited and un-audited),
ii. the sum of the count and density of the previous three security-based alerts, and iii. the count and density of all alerts.
b) The count of SLOC and churn (count of changed SLOC) as internal metrics.
c) External metrics of count and densities of pre-release, release, and total of pre- and post-release failures (security and non-security).
RP was run against all components in the system that we had already manually classified. The objective was to identify predictors (metrics) that best separate prone components from not attack-prone components.
Recursive Partitioning
Recursive partitioning, also known as classification and regression trees (CART) is a statistical technique that recursively partitions data according to X and Y values. The result of the partitioning is a tree of groups where the X values of each group best predicts a Y value. The leaves of the tree are determined by the largest likelihood-ratio chi-square statistic. The threshold or split between leaves is chosen by maximizing the difference in the responses between the two leaves [15].
Results
The first model – pre-release classification based - shows that 100% of the attack-prone components (with an 8% false positive rate) are those that have at least 17 pre-release failures. This is illustrated in Figure 3. Of all the metrics in the model, the pre-release failure count served as the best indicator for the split (p<.0001) that maximizes the difference between attack-prone components and those that are not attack-prone. While in general, further splitting (differentiation) with the other metrics can be done for larger component sample than we had, in our case it was not possible with p-values below 0.05 (95% significance level). The results indicate the pre-release failure count can be an excellent metric for classifying components that also have a high probability being pre-release attack-prone.
In the case of the software in question, any component above the threshold, 17 pre-release failures, is very likely to be attack-prone with an 8% false positive rate. The R2 value for the model is 68% which indicates that the model can account for 68% of the variance. No other single predictor had similar R2
value, although we did find that the combination of churn and total alert density had an R2 equivalent to
that of pre-release failure count (see Appendix A).
Figure 3. The result of RP after using the pre-release failure count to partition pre-release attack-prone components.
A not unexpected observation is that the more failure reports the exist per component, the more likely that some of the failures can cause security problems. It is also worth noting that security problems did not appear to exist in components that did not have many problems. From these observations, we can define a discrimination threshold [17], in this case 17 could be used as a serious warning about potential for security problems.
Our second model is based on RP classification of post-release attack-prone events. Results are illustrated in Figure 4. Since there were quite a few less field security failures, the model is less reliable but is still provides a very good supportive argument for use of RP for construction of security projection models. Of all the metrics, the count of post-release failures had the most discriminatory power (p=.01). In this case the threshold is 2. The R2 value for the attack-prone model is 0.44 which not that good. As
R2 values for SLOC and the combination of SLOC and churn was 43.8% and that of un-audited null
pointer alerts 39%.
Figure 4. The result of RP after using the number of post-release failure count to partition post-release attack-prone components.
We can (use the negative binomial distribution to predict the count of pre- and post-release attacks per component based on the count of pre-release non-security failures. For example, in our case the parameters were SE=0.56, p<.0001, value/DF=0.92. Having an estimated count of security problem count based on non-security failure count can indicate how many security issues testers should look for in a component. We attempted to assign a probability to a component that was attack-prone using logistic regression and negative binomial regression, but in the context of our data the models did not produce probabilities that separated attack-prone from not attack-prone components.
The RP-based models we have presented so far are more helpful for classification than they are for prediction because we have distinguished attack-prone from not attack-prone components, but have done so based on failure data that arrives late in the SLC. Waiting until after the testing phase to prioritize verification efforts is like placing a bet on a game after it is over – we already know the outcome. The failure count metric outperformed (although slightly in some cases) the internal metrics which are good for predicting security failures early in the SLC. However, these failure data may have some predictive power for indicating which components are most likely to fail in the next revision of the system (the next release effect). The real value is that we can predict and prioritize the attack-prone components based on which ones are the most failure-prone because security problems appear to go along with high concentrations of non-security problems. This analysis also indicates that reliability testers are more likely to find security failures as they create more tests that cause reliability failures.
We also present the quartiles as a measure of density to negate the effect of count of SLOC. As shown in Figure 5, density evenly distributes attack-prone components among failure-prone components.
Figure 5. Failure-prone and attack-prone components juxtaposed according to failure counts and densities. Failure-prone (FP), not failure-prone (NFP), and attack-prone (AP). Q is the quartile value.
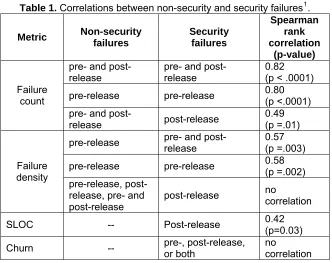
Table 1. Correlations between non-security and security failures1.
Metric Non-security failures Security failures Spearman rank correlation (p-value) pre- and
post-release pre- and post-release 0.82 (p < .0001) pre-release pre-release 0.80 (p <.0001) Failure
count
pre- and
post-release post-release
0.49 (p =.01) pre-release pre- and post-release 0.57 (p =.003)
pre-release pre-release 0.58 (p =.002) Failure
density
pre-release, post-release, pre- and post-release
post-release no correlation
SLOC -- Post-release 0.42 (p=0.03)
Churn -- pre-, post-release, or both no correlation
Summary and Conclusions
We found that the best metric in our models for classifying attack-prone components was failure count. We usually find plenty of non-security problems with software and since they are lying around then why not use them for security efforts? If you can predict your failure-prone components, then you might consider assigning security efforts to the most failure-prone components to make more secure software and especially since failure prediction can be achieved early in the SLC. Many metrics are available for predicting attack-prone components and can be based on much of the work achieved in reliability engineering. We are eager to work with any software organization who wants to predict their attack-prone components.
Acknowledgements
This work is supported by the National Science Foundation under CAREER Grant No. 0346903. Any opinions, findings, and conclusions or recommendations expressed in this material are those of the authors and do not necessarily reflect the views of the National Science Foundation. Thanks to Jason Osborne for his review of the statistical modeling.
References
[1] O. H. Alhazmi, Y. K. Malaiya, and I. Ray, "Measuring, analyzing and predicting vulnerabilities in software systems," Computers & Security, vol. 26, no. 3, pp. 219-228, May 2006.
[2] S. Barnum and M. Gegick, "Design Principles," https://buildsecurityin.us-cert.gov/portal/article/knowledge/Principles, 2005.
[3] B. Boehm, Software Engineering Economics, New Jersey, Prentice-Hall, 1981.
[4] G. Denaro, "Estimating software fault-proneness for tuning testing activities," Proc of theInternational Conference on Software Engineering, St. Malo, France, pp. 269-280, 2000.
[5] E. Dijkstra, Structured Programming, Brussels, Belgium, 1970.
[6] A. Endres and R. D. Rombach, A Handbook of Software and Systems Engineering, Harlow, England,
Pearson Education, Limited, 2003.
[7] G. Hoglund and G. McGraw, Exploiting Software, Boston, Addison-Wesley, 2004.
1
[8] ISO/IEC 24765, "Software and Systems Engineering Vocabulary,"
http://pascal.computer.org/sev_display/index.action, 2006.
[9] W. Jones and M. Vouk, Software Reliability Field Data Analysis, McGraw Hill, 1996.
[10] G. Q. Kenney, "Estimating Defects in Commercial Software During Operational Use," IEEE Transactions on Reliability, vol. 42, no. 1, pp. 107-115, 1993.
[11] J. D. Musa, Software reliability engineering: More reliable software faster and cheaper Second Ed.,
Bloomington, Indiana, AuthorHouse, 2004.
[12] N. Nagappan and T. Ball, "Static Analysis Tools as Early Indicators of Pre-release Defect Density,"
Proc of theInternational Conference on Software Engineering, St. Louis, MO, pp. 580-586, 2005.
[13] T. J. Ostrand, E. J. Weyuker, and R. M. Bell, "Where the bugs are," Proc of the International Symposium on Software Testing and Analysis, Boston, Massachusetts, pp. 86-96, 2004.
[14] V. Prevelakis and D. Spinellis, "The Athens Affair," IEEE Spectrum, vol. 44, no. 7, pp. 26-33, 2007. [15] SAS Institute Inc., "The Partition Platform," SAS Institute, Inc., Cary, NC, 2003.
[16] A. Schroter, T. Zimmermann, and A. Zeller, "Predicting Component Failures at Design Time," Proc of the International Symposium on Empirical Software Engineering, Rio de Janeiro, Brazil, pp. 18-27,
September 21-22 2006.
[17] M. Vouk and K. C. Tai, "Some Issues in Multi-Phase Software Reliability Modeling," Proc of the Center for Advanced Studies Conference (CASCON), Toronto, pp. 512-523, October 1993.
[18] J. Zheng, L. Williams, W. Snipes, N. Nagappan, J. Hudepohl, and M. Vouk, "On the Value of Static Analysis Tools for Fault Detection," IEEE Transactions on Software Engineering, vol. 32, no. 4, pp.
Appendix A
Summary of recursive partitioning results. The results from the models with alerts, churn, SLOC are found in “Predicting Attack-prone Components with Internal Metrics” and our compared to our new findings with failure counts as a metric. Total pre-release failure count includes all failures (security and non-security) identified by pre-release testing. Total post-release failure count includes all failures (security and non-security) reported by customers. The pre-release model with the internal metrics (alerts, churn, SLOC) is nearly identical to the model that uses total pre-release failure count as a metric. The models shaded in gray have low R2 and ROC values and can thus we cannot be confident in their predictive values.
Pre- or
post-release Metric Type I Type II R
2
Cross-validated R2 ROC
alerts 28% 0% 31.5% 19.4% 76.7%
churn 28% 0% 31.5% 30.1% 76.7%
SLOC -- -- -- -- --
alerts, churn, SLOC
8% 0% 67.9% 61.1% 93.3%
pre-release
total pre-release failure count
8% 0% 68% 64% 93%
alerts 24% 0% 38.8% 33.7% 85.7%
churn -- -- -- -- --
SLOC 20% 0% 43.8% 25.5% 88.1%
alerts, churn, SLOC
20% 0% 43.8% 25.5% 88.1%
post-release
Total post-release failure count