Report No. 441
OPTIMIZING SOIL-POLYACRYLAMIDE INTERACTIONS FOR EROSION CONTROL AT CONSTRUCTION SITES
By
Richard McLaughlin, Aziz Amoozegar, Owen Duckworth, Joshua Heitman
Soil Science Department
UNC-WRRI-441
The research on which this report is based was supported by funds provided by the North Carolina General Assembly and/or the US Geological Survey through the NC Water Resources Research Institute.
Contents of this publication do not necessarily reflect the views and policies of WRRI, nor does mention of trade names or commercial products constitute their endorsement by the WRRI, the State of North Carolina, or the US Geological Survey.
This report fulfills the requirements for a project completion report of the Water Resources Research Institute of The University of North Carolina. The authors are solely responsible for the content and completeness of the report.
Optimizing Soil-Polyacrylamide Interactions for Erosion Control at Construction Sites
ABSTRACT
Regulations on construction site runoff are tightening and will likely lead to adoption of
improved erosion control practices, including the application of polyacrylamide (PAM) to soil to enhance erosion and sediment control. While the benefits of PAM applications in reducing erosion have been well demonstrated for agricultural applications, it is not clear how the applied PAM differing in formations interact with soil material and how much of the applied PAM can be lost, impacting the end result for the construction site application. The project was initiated to investigate the soil-PAM interactions to obtain the maximum benefits from the PAM applied for erosion and sediment control. The project was conducted in three phases: 1) method
development for quantifying dissolved PAM, 2) rainfall simulation study, and 3) laboratory column and sorption experiments. In the first phase, we developed a modified turbidimetric method using cationic surfactant (hyamine 1622) and it was proven to be a quick and reliable method for quantifying PAM in soil extracts at low carbon content. In the second phase, a rainfall simulation study was conducted to evaluate the performance of an excelsior erosion control blanket (cover) and two PAM application methods (dissolved vs granule). Runoff turbidity and total suspended solids (TSS) from PAM treatments with cover were at least 28-times less than those of control (2315 nephelometric turbidity units, 2777 mg TSS L-1), with the cover + dissolved PAM being the most effective in delaying runoff initiation and reducing TSS. As a result of flocculation, eroded sediments collected from PAM treatments had 7- to 9-times greater median particle diameter than those from the control (12.4 µm). Loss of PAM for the granular PAM treatment was 19% of applied PAM, but was only 2% of applied PAM for the dissolved PAM treatment. While both PAM formulations applied with a temporary groundcover were effective in improving runoff water quality, applying dissolved form resulted in greater benefits with a lower PAM loss. In the third phase, we investigated dissolved PAM penetration in 2-cm thick sandy clay loam soils under saturated condition in two application modes (pulse and continuous). The pulse input of dissolved PAM applied at the typical hydroseeding rate (30 kg ha-1 in 500 mg PAM L-1) decreased the hydraulic conductivity (HC) by a 100-fold and allowed 14 % of the applied PAM to leached out. Continuously applied 25 mg L-1 of dissolved PAM solution decreased the HC by a 10,000-fold and leached PAM only accounted for 23 % of the total amount of applied PAM with given 130 pore volume of PAM throughput,
TABLE OF CONTENTS
1. Introduction and Study Objectives ... 2
1.1. Statement of the Regional Water Problems ... 2
1.2. Polyacrylamide for Erosion and Turbidity Control ... 3
2. Materials and Methods ... 5
2.1. Hyamine test ... 5
2.1.1. PAM Materials ... 5
2.1.3. Turbidimetric method using hyamine (hyamine test)... 6
2.1.4. PAM calibration curve and method validation ... 7
2.2. Runoff Experiment... 7
2.2.1. Runoff box preparation and treatments ... 7
2.2.2. Rainfall simulation ... 9
2.2.3. Particle size distribution ... 10
2.3. Column Experiment ... 10
2.3.1. Soil column setup ... 10
2.3.2. PAM displacement test ... 11
2.3.3. PAM sorption isotherm ... 13
3. Results and Discussion ... 14
3.1. Hyamine test ... 14
3.1.1. PAM calibration curves in DI water matrix ... 14
3.1.2. PAM calibration curves in soil extracts ... 15
3.1.3. Summary ... 19
3.2. Runoff Experiment... 20
3.2.1. Runoff initiation and volume ... 20
3.2.2. Turbidity and sediment ... 23
3.2.3. Polyacrylamide loss ... 25
3.2.4. Particle size distribution in eroded sediments ... 26
3.2.5. Summary ... 27
3.3. Column Experiment ... 28
3.3.1. Hydraulic conductivity ... 28
3.3.2. PAM displacement ... 29
3.3.3. PAM transport and CXTFIT modeling ... 30
3.3.4. PAM sorption isotherm ... 32
3.3.5. Summary ... 33
4.0 Conclusions and Recommendations ... 33
References ... 34
Appendix 1. Abbreviations and symbols ... 39
LIST OF TABLES
Table 2.1. Properties of anionic polyacrylamide (PAM) formulations used in this study... 5 Table 2.2. Selected soil properties of Piedmont clay loam (PCL), Piedmont sandy loam (PSL), Coastal Plain sand (CPS), and Coastal Plain muck (CPM). ... 6 Table 2.3. Selected chemical properties of soil extracts. ... 6 Table 2.4. Chemical properties of the water used for rainfall simulation. ... 9 Table 3.1. Hyamine method analytical parameters in deionized water for each polyacrylamide (PAM) formulation. ... 14 Table 3.2. Turbidity (mean ± std. dev.) of blank samples in deionized (DI) water and soil extracts before and after hyamine addition. ... 15 Table 3.3. Hyamine method analytical parameters in soil extracts for each polyacrylamide (PAM) formulation. ... 17 Table 3.4. Comparison of time to runoff initiation (TRI), runoff ratio over applied rainfall
LIST OF FIGURES
Figure 2.1. Setup of rainfall simulation tests showing (a) exterior view and (b) interior view. ... 8 Figure 2.2. Schematic diagram of hydraulic conductivity measurement and polyacrylamide displacement tests. ... 11 Figure 3.1. Polyacrylamide (PAM) calibration curves in deionized water. Charge density (mol %) for each PAM formulation is shown in parenthesis. Error bars are the standard error of the three replicates. ... 14 Figure 3.2. Polyacrylamide (PAM) calibration data in the Coastal Plain muck extract for three PAMs (A150, A120, and A100). Charge density (mol %) for each PAM is shown in parenthesis. Error bars are the standard error of the three replicates. ... 16 Figure 3.3. Polyacrylamide (PAM) calibration data in the Coastal Plain muck extract for three PAMs (A150, A120, and A100). Charge density (mol %) for each PAM is shown in parenthesis. Error bars are the standard error of the three replicates. ... 18 Figure 3.4. Turbidity development in Coastal Plain muck extract affected by dilution before and after hyamine addition. Error bars are the standard error of the three replicates. Note a
logarithmic scale in Y-axis. ... 19 Figure 3.5. Comparison of runoff rate over the first (0 to 50 min) and second (80 to 100 min) rainfall events with a 30-min rest period between rainfall events. The GPAM and DPAM are granular and dissolved polyacrylamide (PAM), respectively. ... 22 Figure 3.6. Soil surfaces in runoff boxes after rainfall simulations: (a) no cover + no PAM, (b) cover + DPAM, (c) cover + GPAM, and (d) cover + no PAM. GPAM and DPAM are granular and dissolved polyacrylamide (PAM), respectively. ... 22 Figure 3.7. Comparison of runoff quality over the first (0 to 50 min) and second (80 to 100 min) rainfall events with a 30-min rest period between rainfall events for (a) turbidity and (b) total suspended solid (TSS) concentration. The GPAM and DPAM are granular and dissolved
polyacrylamide (PAM), respectively. Note a logarithmic scale on y-axis. ... 23 Figure 3.8. Cumulative sediment loss affected by polyacrylamide (PAM) treatment for (a) No PAM and (b) PAM. The GPAM and DPAM are granular and dissolved polyacrylamide (PAM), respectively. ... 24 Figure 3.9. Polyacrylamide (PAM) concentration in runoff during the first (0 to 50 min) and second (80 to 100 min) rainfall events with a 30-min rest period between events. The GPAM and DPAM are granular and dissolved PAM, respectively. ... 25 Figure 3.10. Granular and dissolved polyacrylamide (GPAM and DPAM, respectively) loss by runoff... 26 Figure 3.11. Turbidity as a function of median particle diameter (D50) in eroded sediments. ... 27 Figure 3.12. The hydraulic conductivity of the Piedmont clay loam applied with (a) pulse input of PAM solution (500 mg L-1) and (b) step input of PAM solution (25 mg L-1). Note a
ACKNOWLEDGMENTS
1.
Introduction and Study Objectives
1.1.Statement of the Regional Water Problems
The NC population is estimated to increase to 9.3 million by 2025 (Bureau of Census, 2010), and a massive amount of construction will be required to provide housing and infrastructure for the expanding population. Rapid growth is expected for many population centers in North Carolina that are in close proximity to water supply reservoirs or other important water resources. Under the current practices, areas considered for large developments and highway construction sites are completely cleared, exposing subsoils that pose a severe erosion risk. Construction sites are generally prone to high erosion rates because they cover large areas, are highly disturbed, have no cover for an extended period of time, and are often on steep slopes. Despite US
Environmental Protection Agency (EPA) guidelines and state regulations concerning erosion from construction activities, construction sites are subject to significant amount of erosion during rainfall events that produce runoff. It is estimated that sediment loads from construction projects can be 2,000 times greater than wooded areas and 10 to 20 times greater than agricultural fields (Novotny and Olem, 1994). Erosion from construction sites may exceed 10 metric tons soil/ha for a single rainfall event (Hayes et al., 2005). In addition to reducing reservoir capacity, soil erosion resulting in the transport of soil particles by storm water runoff is considered the most widespread cause of pollution of streams and lakes (USEPA, 2002). Thus, controlling erosion on construction sites is critical to the protection of water resources in North Carolina.
According to Moreau (1992), from the 1970s to early 1990s, North Carolina experienced no expansion of public water supply reservoirs, and even saw a decline in recreational reservoirs. Therefore, the impact of sediment loading from construction sites on water supply reservoirs poses a serious threat to ecosystem health and the public supply of safe drinking water. McLaughlin et al. (2009) indicates streams adjacent to construction sites may be more heavily impacted with sediment loading during storm events than previously reported (Erhart et al. 2002). To highlight the impact of potential surface water pollution by erosion, consider that Chatham and Durham Counties, which contain most of the Jordan Lake shoreline, increased the number of housing units 23% from 2000 to 2008 (Southern Rural Development Center, 2010). Because these subdivisions will most likely be sited within 40 km of the lake, sediments released during construction of these developments will be deposited in Jordan Lake. Similar growth is expected for many other counties, such as Alamance, Orange, and Wake, most of which drain to Jordan Lake, Falls Lake, or another water supply reservoir.
The most common practice for reducing release of soil particles to streams and lakes is the use of ponding devices to trap sediment through settling. The amount of soil transported by erosion that can settle in a sediment trap depends on the particle size distribution of the soil subjected to erosion. According to Line and White (2001), a typical sediment trap can only retain 50 to 60% of the sediments that enter it. A simple calculation using Stokes law (Hillel, 2004) shows that while it takes just under 6 minutes for all sand-sized particles (>0.05 mm in diameter) to settle to the bottom of a 1 m deep sediment trap, it takes more than 61 hours for all silt-sized particles (> 2 μm) to settle to that depth, and it takes more than 2 days for clay-sized particles larger than 1 μm to settle through the upper 20 cm of the suspension in the sediment trap (> 10 days to settle 1 m). Recent regulation issued by USEPA (2009), entitled the Effluent Limit Guidelines (ELG), mandates that the turbidity of water released from construction sites not to exceed 280
review (US EPA, 2011), this regulation will likely require the implementation of new erosion control approaches (both physical and chemical) and/or some form of on-site treatment of runoff to address turbidity.
1.2.Polyacrylamide for Erosion and Turbidity Control
Minimizing the impact of current construction practice on nearby surface waters requires
continued development of innovative erosion control practices. The use of polyacrylamide (PAM) has gained wide acceptance for reducing soil erosion and improving runoff water quality in
agricultural fields and construction sites. The primary functions of PAM application are two-fold: 1) a flocculating agent for suspended materials in aqueous suspension and 2) an aggregating agent for soil conditioning. Application of PAM for land management has proven to be effective and economical in stabilizing soil structure, reducing soil erosion, and improving runoff water quality (Hayes et al., 2005; Sojka et al., 2007; Kang et al. 2013b). As its use has become more widespread, determination of PAM concentration in soil water (e.g., runoff water, groundwater, soil solution) has also become increasingly important to better understand the fate and transport of PAM in the environment (Lu and Wu, 2003a).
Polyacrylamide is a broad class of synthetic organic polymers formed by the polymerization of acrylamide (AMD) units and it can be synthesized to have specific chemical properties,
including net charge (anionic, neutral, or cationic), charge density (% hydrolysis), and molecular weight. Cationic PAMs are usually avoided in environmental applications due to their potential aquatic toxicity (Barvenik, 1994). High-molecular weight, linear, anionic PAMs are used for soil and water conservation purposes as they adsorb to soil irreversibly through linkages between the anionic groups and the negatively charged soil constituents by exchangeable cation bridges (Seybold, 1994). Whereas PAM is stable and non-toxic, the residual AMD monomers raise concerns as a neurotoxin and a skin irritant (Rudén, 2004). Commercial grade PAMs for water treatment have <0.05 % AMD monomer, which is considered to be a safe level when used at low concentration (Barvenik, 1994; Sojka et al., 2007). Nonetheless, potential concerns highlight need for reliable analytical methods for the quantification of PAM in environmental samples. Lu and Wu (2003a) reviewed the existing analytical methods for quantifying aqueous PAM concentration. They emphasized that any method for quantifying PAM in soil waters should be sensitive at low concentrations (< 1 mg L-1) and insensitive to interferences such as dissolved salts and organic matter (OM). The analytical methods for aqueous PAM are generally based on 1) the chemical properties of amide groups in PAM assessed by N-bromination of the amides (Scoggins and Miller, 1979; Lu and Wu, 2001); 2) the physical properties of the PAM solution determined by viscosity measurement (Jungreis, 1981), flocculation-based methods (Lentz et al., 1996), or size exclusion chromatography (Hunt et al., 1988); 3) the combined physical and chemical properties determined by turbidimetric methods (Allison et al., 1987) or polarography (Smith-Palmer et al., 1988); and 4) methods based on total organic carbon (TOC) concentration and radioactive labeling (Ben-hur et al., 1992; Entry et al., 2008). Most of these methods are complicated procedures that may require expensive laboratory equipment. The TOC
to quantify PAM in solution with higher selectivity, if the interferences from salts and OM are minimal (Taylor and Nasr-El-Din, 1994).
The turbidimetric method for quantifying PAM uses a reagent that reacts with AMD subunits in anionic PAMs to produce insoluble colloids that remain suspended in solution, giving rise to turbidity. Hyamine 1622 (benzethonium chloride; referred to as “Hyamine”) is the most commonly used turbidimetric reagent for anionic PAMs (Michaels and Morelos, 1955;
Crummett and Hummel, 1963; Wimberley and Jordan, 1971; Allison et al., 1987). When a large anionic polyelectrolyte reacts with a large cationic molecule such as hyamine, optical density determined by a turbidimeter or a spectrophotometer is proportional to the concentration of PAM in solution. Previous studies determined that the methods based on hyamine had detection limits of 0.5 to 1 mg L-1 for dissolved PAM in either deionized (DI) water or oil-field brines (Crummett and Hummel, 1963; Allison et al., 1987; Taylor and Nasr-El-Din, 1994). These results suggest that the hyamine test may be useful for quantifying PAM in environmental soil water samples. The efficacy of PAM in reducing erosion from irrigated agricultural fields has been well
established (Aase et al., 1998; Lenz and Sojka, 2009; Sojka et al., 1998), as well as its impact on hydraulic conductivity and intake rate of field soils and depositional seals (Bhardwaj et al., 2009; 2010; Helalia and Levy, 1988; Sirjacob et al., 2000). However, fewer studies have addressed the use of PAM on the steep, highly compacted slopes typical of construction sites (Sojka et al., 2007). While it is clear that PAM can greatly reduce erosion and improve runoff water quality, there is little information on how to optimize the application for the greatest effect under these challenging conditions. Hayes et al. (2005) and Soupir et al. (2004) found that application of PAM on bare surfaces at construction sites at recommended rate of 10.5 kg/ha or less did not effectively control sediment transport or reduce turbidity of runoff water. Flanagan et al. (2002a, 2002b) found that a much higher rate (80 kg/ha) and concentration significantly reduced erosion on bare, steep slopes, but they were testing it on slopes with well-tilled topsoil. Compared to PAM alone, mulches are much more effective in protecting slopes from erosion (Soupir et al., 2004; Hayes et al., 2005) and PAM can enhance that protection (McLaughlin and Brown, 2006; Babcock and McLaughlin, 2011).
Sojka et al. (2007) suggested that the high concentrations used in typical hydroseeding
operations, as evaluated by Soupir et al. (2004) and Hayes et al. (2005), may have contributed to poorer erosion control by PAM. They further suggested that for PAM to be effective at high concentrations (up to 468 mg/L), the soil would need to be completely dry before application, or that higher volumes of water would be needed to adequately transport PAM to deeper depths in the soil. However, Flanagan et al. (2002a,b) used 2,500 mg/L solutions at much higher
commercial equipment, which can apply much more viscous solutions, may not be the same. Lu et al. (2002) evaluated PAM adsorption to soil materials collected from the upper 10 cm of six different soil series with a wide range of characteristics using PAM concentrations between 0 and 40 mg/L. They determined that PAM has a high affinity to be adsorbed by soil particles. However, because of its molecular size, it can only be adsorbed to the outer surface of soil particles, making its penetration into the soil profile highly dependent on the soil texture. In another study, Lu and Wu (2003b) examined PAM penetration into repacked columns (5.2 cm diameter) of soil materials collected from the upper 15 cm of two different soils. In their study, they removed the organic matter of the soil materials by combustion, and used PAM
concentrations between 10 and 40 mg/L. Based on their results, they concluded that PAM can move into soils that contain no organic material, but its depth of penetration is limited to the upper part of the soil profile. Although these later studies address PAM adsorption and transport into soils of different textures, the soil materials that were used were from surface layers (i.e. low clay content) and the PAM concentrations were 10-fold lower than realistic field application rates used for erosion control at construction sites. The study here was intended to address key questions regarding the effectiveness of PAM applied to exposed soil at construction sites as affected by application rate and concentration. Specific objectives were:
(1) To evaluate the turbidimetric method using hyamine for determining PAM concentration in soil extract samples (hyamine test).
(2) To determine the effects of applied PAM formulations (dissolved vs granular) on runoff water quality, eroded sediment particle size distribution, and PAM loss by runoff (runoff experiment).
(3) To investigate the infiltration and transport of dissolved PAM through repacked soil columns (column experiment).
2.
Materials and Methods
2.1.
Hyamine test
2.1.1.PAM Materials
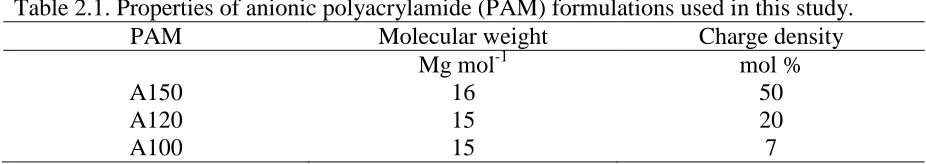
Three high-molecular weight (15 to 16 Mg mol-1) anionic PAMs (Superfloc, Kemira Chemicals, Inc., Atlanta, GA) with a range of charge density were selected for study (Table 2.1). Stock solutions of PAM (1.0 g L-1) were prepared by adding granular PAM to DI water and stirring for at least 24 h at room temperature. A 3.5% w/v hyamine solution was prepared by dissolving 3.5 g of benzethonium chloride (Hyamine 1622; Acros Organics, NJ) in 100 mL of DI water. Table 2.1. Properties of anionic polyacrylamide (PAM) formulations used in this study.
PAM Molecular weight Charge density
Mg mol-1 mol %
A150 16 50
A120 15 20
A100 15 7
2.1.2.Soil extract preparation
high sand (CPS) contents, and one was mineral-organic soil with a high OM content (CPM). The CPM was surface soil (0-15 cm) from an agricultural field and the other three were fill soil materials from construction sites (surface and subsurface mixed). All soil materials were air-dried and passed through a 2-mm sieve. Soil extracts were obtained by equilibrating each soil with DI water for 24 h at 1:20 soil to solution ratio in an end-to-end shaker. After equilibration, the suspensions were centrifuged and the supernatant was decanted for use in experiments and further analysis. The soil extracts were analyzed for Al, Fe, Ca, Mg, K, and Na by inductively coupled plasma atomic emission spectroscopy (PerkinElmer, Waltham, MA), TOC with a Shimadzu carbon analyzer (Shimadzu Corp., Tokyo), and electrical (EC) conductivity with an EC Tester (Oakton instruments, Vernon Hills, IL). The results are presented in Table 2.3. Table 2.2. Selected soil properties of Piedmont clay loam (PCL), Piedmont sandy loam (PSL), Coastal Plain sand (CPS), and Coastal Plain muck (CPM).
Property Soil material
PCL PSL CPS CPM
Texture clay loam sandy loam sand sandy loam
Sanda (g kg-1) 412 524 900 685
Silta (g kg-1) 219 339 50 285
Claya (g kg-1) 369 137 50 30
pHb 5.3 5.1 7.1 4.4
Organic matterc (g kg-1) 9.5 4.4 1.5 143.6
a
Particle size analysis by hydrometer method. b
pH by a glass electrode at 1:1 soil to solution ratio. c
Organic matter by loss-on-ignition.
Table 2.3. Selected chemical properties of soil extracts. Property Soil extracta
PCL PSL CPS CPM
ECb (µS/cm) 17 13 46 80
TOCc (mg L-1) 1.9 2.9 4.2 60
Al (mg L-1) <0.01 3.00 3.00 2.30
Fe (mg L-1) <0.01 1.50 1.90 0.31
Ca (mg kg-1) 1.20 0.08 7.00 5.30
Mg (mg kg-1) 0.48 0.20 0.44 1.70
K (mg kg-1) 0.19 0.50 0.63 3.60
Na (mg kg-1) 0.49 2.00 0.34 0.92
a
Piedmont clay loam (PCL), Piedmont sandy loam (PSL), Coastal Plain sand (CPS), and Coastal Plain muck (CPM).
b
Electrical conductivity. c
Total organic carbon.
2.1.3.Turbidimetric method using hyamine (hyamine test)
Solutions containing a range of PAM concentrations (0.5, 1, 2.5, 5, 10, 25, and 50 mg L-1) were prepared in either DI water or soil extract. A 10 mL aliquot of PAM solution at each
time, the turbidity was measured using a portable turbidimeter (LaMotte Company, Chestertown, MD) in nephelometric turbidity units (NTU). Our preliminary results in DI water indicated that PAM concentrations ≤ 0.5 mg L-1
did not yield enough turbidity upon hyamine addition to be distinguished from blank solutions.
2.1.4.PAM calibration curve and method validation
Using the turbidity readings obtained by the hyamine-PAM reaction, PAM calibration curves (plots of PAM concentration vs. turbidity) were constructed individually as a factorial
combination of three anionic PAMs, five solution compositions (DI water and four soil extracts), and seven concentration levels (0.5, 1, 2.5, 5, 10, 25, and 50 mg L-1). All combinations were performed in triplicate and the mean values were used to develop the PAM calibration curves. For the analytical method validation, we determined signal detection limit, minimum detectable concentration (Cmd), linearity, and sensitivity. Signal detection limit (ydl) is the highest
analytical signal (NTU) when replicates of a sample containing no analyte are tested, and it was determined by (Harris, 2007)
ydl = yblank + 3σ [1]
where yblank is the mean turbidity signal (NTU) of blank solutions containing hyamine but no
PAM (n = 8) and σ is the standard deviation (n = 8) of turbidity in low PAM concentration samples (0.5 mg L-1). Assuming a Gaussian distribution of the raw analytical signals from blank samples, the ydl represents 99% of the observed values and the remaining 1% represents a
response that could be produced by a sample containing a very low concentration of analyte (Armbruster and Pry, 2008). The corrected signal (ysample - yblank) was used to construct a PAM
calibration curve by
ysample - yblank = m × C [2]
where ysample is the mean turbidity signal (NTU) of PAM solutions reacted with hyamine (n = 3),
m is the slope of the linear calibration curve, which is a measure for the sensitivity of the calibration curve, and C is PAM concentration (mg L-1) in the sample. Data were subjected to regression analysis using the least square method. For each regression model, coefficient of determination (r2) and residual standard deviation (RSD) were estimated to assess the linearity and deviation of the data from the fitted regression line by using the data analysis package within Microsoft excel 2010 (Kuss, 2003). Significance of the linear regression model was determined with p-value for the F-test in the analysis of variance. The Cmd, often called as detection limit,
was obtained by substituting ydl from Eq. [1] for ysample in Eq. [2]:
Cmd = 3σ / m [3]
2.2.
Runoff Experiment
2.2.1.Runoff box preparation and treatments
Soil material was collected from an excavation (surface and subsurface mixed) at a local construction site in the Piedmont region of NC. The soil texture was a sandy clay loam (41% sand, 22% silt, and 37% clay) with a pH of 5.3. The soil was air-dried, passed through a No. 25-mesh (7.1 mm) sieve and packed in wooden boxes, 100 cm long, 20 cm wide and 5 cm deep (Fig. 2.1). Each box had three 5-mm drainage holes in the base to allow drainage during rainfall
13.2 kg of soil into each box to achieve a bulk density of 1.5 g cm-3. The final depth of soil was approximately 4.5 cm.
2.2.2.Rainfall simulation
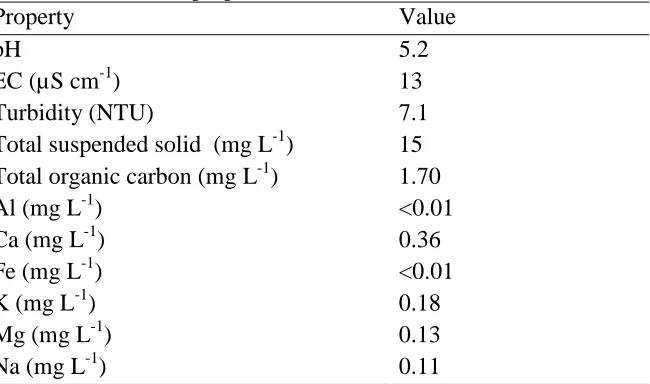
Rainfall simulation was conducted at the Sediment and Erosion Control Research and Education Facility (SECREF) in Raleigh, NC. The source of water was natural rainwater collected from a building roof and stored in a tank until use. The rain water had a pH of 5.2 with background turbidity of 7 nephelometric turbidity units (NTU) (Table 2.4). A four-sided wind screen,
constructed of plastic tarps, was placed around the rainfall simulator to minimize wind effects on rainfall distribution (Fig. 2.1). Four soil boxes with randomly assigned treatments were placed under the rainfall simulator on a stand having a 5% slope for each of two rainfall simulations (i.e., 2 replications), with new soil used in each replication. A single nozzle (FullJet,
1/2HH-SS50WSQ, Spraying System Company, Wheaton, IL) was located 3 m above the boxes and applied rainwater at a constant rainfall intensity of 8.3 cm h-1. Each rainfall simulation consisted of two subtests (hereafter referred to as events). The first event was 50 min long and the second event was 20 min long. A 30-min rest period was allowed between the two events. The 30-min rest period was included to determine if the applied PAM remained effective in erosion and turbidity control for repeated storms. Total rainfall over both events was 9.7 cm, similar to a 2-h, 100-year storm event for this region (NCDENR, 2006). Surface runoff exited the soil box
through a gutter and was directed into a rubber hose that funneled the runoff into a collection container. The collection gutter at the lower end of the boxes was protected by a shield to prevent rainfall from entering the collection container.
Table 2.4. Chemical properties of the water used for rainfall simulation.
Property Value
pH 5.2
EC (µS cm-1) 13
Turbidity (NTU) 7.1
Total suspended solid (mg L-1) 15 Total organic carbon (mg L-1) 1.70
Al (mg L-1) <0.01
Ca (mg L-1) 0.36
Fe (mg L-1) <0.01
K (mg L-1) 0.18
Mg (mg L-1) 0.13
Na (mg L-1) 0.11
For each event, time for runoff initiation was recorded as elapsed time between the start of rainfall and the time at which surface runoff began entering runoff collection container. Runoff was sampled at 5-min intervals and its volume was measured. Runoff rate (mm h-1) was
calculated as (runoff volume)/(sampling interval × box surface area) after runoff initiation. Collected samples were analyzed for turbidity using an Analyte NEP turbidity probe (McVan Instruments, Melbourne, Australia) and TSS concentration after filtering through 76-mm
2.2.3.Particle size distribution
Runoff samples from one replication for each treatment were analyzed for particle size distribution via a laser diffraction (LD) particle size analyzer (LS 13 320 Series, Beckman Coulter, FL). The suspensions of runoff samples were introduced to the LD analyzer while being stirred by a magnetic bar. The analyzer determines volumetric particle size distribution by measuring the pattern of light scattered by the particles in the sample. The scattering intensity data were analyzed to calculate the size of the particles responsible for creating the scattering pattern, using the Mie theory of light scattering (Agrawal et al., 1991; Eshel et al, 2004). The analyzer had a detection range between 0.04 µm and 2 mm and the particle size was reported as a volume-based sphere diameter.
Statistical analysis
Analysis of variance (ANOVA) was used to determine treatment effects on runoff rate, turbidity, TSS concentration, and erosion rate by setting these dependent variables as repeated
measurements. One-way ANOVA for individual treatments and two-way ANOVA (cover and PAM) were run using the PROC GLM procedure in SAS (Version 9.3; SAS Institute, Cary, NC). The effect of sampling time was insignificant (p > 0.05), so it was not included as a treatment factor. Statistical differences between treatments were tested with Waller-Duncan K-ratio t Test at a probability level of 0.05 (SAS, 2011).
2.3.
Column Experiment
2.3.1.Soil column setup
Figure 2.2. Schematic diagram of hydraulic conductivity measurement and polyacrylamide displacement tests.
Following saturation, the saturated columns were placed on a wooden rack with drain funnels and an empty metal cylinder was connected to the top of each column using a large rubber land. The columns were then leached from the top with DI water according to the constant-head method for hydraulic conductivity (HC) of saturated soil (Klute, 1986). After the water level on the top of sample has become stabilized (≈ 9 cm), the leachate was sampled at least three times. The HC (cm d-1) was determined by measuring the volume of leachate Q that pass through the soil sample in a known time t:
HC = (Q / At) (L/∆H) [4] where A is the cross-sectional area of the soil sample (45.6 cm2), L is the length of the sample (2 cm), and ∆H is the head difference across the sample (11 cm). These readings were taken as initial HC values prior to PAM addition at t = 0. The HC measurement continued during the PAM displacement tests.
2.3.2.PAM displacement test
The PAM used for this study was a high molecular-weight, anionic polymer with 50 mol % of charge density (Superfloc A150, Kemira Chemicals Inc., Atlanta, GA). The PAM flocculated the study soil well and had high analytical sensitivity in measuring dissolved PAM concentration turbidimetrically due to its higher charge density (Kang et al., 2013a). Stock solution of the PAM (500 mg L-1) was made in DI water and stirred for at least 24 h at room temperature.
We selected two columns that had the most similar HC at t = 0 for further tests to investigate the PAM displacement through 2-cm soil layer by two different PAM application modes: 1) pulse input and 2) step input. For the pulse input, 27 mL of 500 mg L-1 of dissolved PAM was applied by pipette after removing the ponded water without breaking saturated condition. This allowed us to have relative PAM concentration (C/C ) in leachate against input concentration of 500 mg
Soil 2 cm
Mariotte bottle with bubble tube
Water column over soil surface
L-1. Upon the end of dissolved PAM infiltration onto the soil, water input was switched to DI water and maintained saturated condition under the constant head. The step input was continuous application of 25 mg L-1 of dissolved PAM without switching to the DI water.
Breakthrough curve data were fitted with an analytical solution of a physical nonequilibrium model or two-region model, which is based on a dual-porosity concept. Equilibrium convective-dispersive equation (CDE) model based on a single porosity was poorly fitted to the measured data. In the two-region model, water-filled pore space is divided into two regions, mobile and immobile liquid region. Convective-dispersive transport is confined to the mobile liquid region while the presence of a solute in an immobile region within an aggregate is dependent on diffusion from the mobile to the immobile liquid. One-dimensional transport of reactive solute during steady-state flow is written as (Lal and Shukla, 2004):
[5] [6] [7]
where θim and θm are volumetric water content of mobile and immobile liquid phases, Cm and
Cim are concentrations in mobile and immobile phases, t is time, Dm is dispersion coefficient of
mobile phase, vm is the average mobile pore water velocity, x is depth, α is chemical mass
transfer coefficient between mobile and immobile liquid phases. Note that for the two-region model, pore water velocity (v) = (θm vm)/ θ and dispersion coefficient (D) = (θm Dm)/ θ.
At the end of displacement tests, soil samples in the columns were weighted to determine volumetric water content (θ) in triplicates, which is equal to water-filled porosity (f) in saturated column (Hillel, 2004). The average value of f was 0.36 ± 0.001 (mean ± std. error) and column pore volume at saturation was determined to be 33.2 cm3 by:
Vo = Vt × f [8]
where Vt is the total volume of soil (cm3). The number of pore volumes (PV) for column leachate
was determined by:
PV = Vc/Vo [9]
where is the cumulative volume of leachate (cm3). Data from the tests were plotted with relative concentration (C/Co) of leachate PAM as a function of dimensionless time, PV. The data were
then analyzed using the computer program CXTFIT that estimate solute transport parameters from measured breakthrough curves using a non-linear least-squares fitting procedure (Toride et al., 1999). Inverse module in the CXTFIT was used to estimate retardation factor (R), D, β, and ω by fitting the parameters in an analytical solution to the two-region CDE (Eq. 5-7). The parameters β and ω are dimensionless expressions of the mobile water and the mass transfer coefficient, respectively (Hebert Jr., 2011):
β = θm/θ [10]
where L is the characteristic length of the studied system (column length). The parameter β represents the fraction of solute present in the mobile region under equilibrium conditions while ω represents the ratio between hydrodynamic residence time and a characteristic time of solute movement in the immobile region. The two-region model becomes to a one-region, one porosity model when β =1. Solute concentrations in the mobile and immobile phases are in equilibrium for high values of ω (>100) whereas mass transfer between mobile and immobile phases becomes insignificant at very low value of ω(≈ 0). For our CXTFIT simulations, relative concentrations of PAM (C/Co), application mode (pulse or step) and duration of influent PAM, average v were entered in as known parameters. The average v for each column was determined by:
v = (q/A) / θ [12] where A is the cross-sectional area of the column (cm2).
Leachate samples were collected via a fraction collector (Fig. 2.2) and the samples were
composited to make up enough volume (100 mL) for the determination of PAM. Concentrations of PAM were determined turbidimetrically using a cationic surfactant (hyamine 1622) according to the procedures in Kang et al. (2013a). Sample collection lasted up to 3 days (29 PV) for the column with pulse input and up to 47 days (181 PV) for the column with step input.
2.3.3.PAM sorption isotherm
Polyacrylamide adsorption was measured and an isotherm was constructed to estimate Langmuir-model parameters for the study soil material according by conventional batch technique. Briefly, 1.5 gram of soil sample was equilibrated in centrifuge tubes with 30 mL of PAM solutions with initial PAM concentrations at 0, 0.5, 1, 2.5, 5, 10, 25, 50, 75, 100 mg L-1. The tubes were shaken for 24 h on a reciprocating shaker, centrifuged (5 min at 15,000 rpm), and the supernants were decanted off for further PAM analysis. The PAM sorption parameters were determined with a linearized form of the Langmuir equation:
C/S = C/Smax + 1/(KLSmax) [13]
where C is the concentration of PAM in solution after the 24-h equilibration (mg L-1), S is the amount of PAM adsorbed by soil (mg kg-1), Smax is the Langmuir PAM sorption maxima (mg kg
-1
), and KL is an affinity constant related to binding energy (L mg-1). Model parameters were
estimated from a linear regression of C/S against C, where the slope equals 1/Smax and the intercept equals 1/(KLSmax).
Adsorption partition coefficient, often referred to as distribution coefficient (kd, L kg-1), is a ratio
adsorbed phase concentration to the solution phase concentration at equilibrium and it is the slope of the Langmuir isotherm at any point (Fetter, 1999). Values of kd was determined by
solving for S in eq. [13] and differentiating it with respect to C (Akhtar et al., 2003): ]
1 -[
1
1 2 max
max C K C S K S K C K C d dS k L L L L
d = = + +
[14] The value of kd over C was used to estimate the retardation factor for PAM given equilibrium
PAM concentration (C):
R = 1 + (ρb kd)/θw [15]
3.
Results and Discussion
3.1.
Hyamine test
3.1.1.PAM calibration curves in DI water matrix
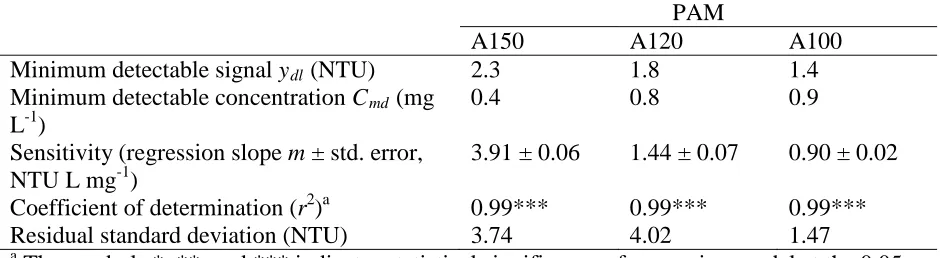
All anionic PAMs yielded strong linear relationships between turbidity and PAM concentration with the r2≥ 0.99 (Fig. 3.1; Table 3.1). As seen in the increasing slopes, the sensitivity of the hyamine test increased with increasing charge density of the anionic PAMs. The Cmd for the
highest charge density PAM (0.4 mg L-1) was less than half that of the PAM with the lowest charge density (0.9 mg L-1). Our results are thus in agreement with Allison et al. (1987) who found similar dependence of sensitivity on charge density of anionic PAMs in brine solutions.
Figure 3.1. Polyacrylamide (PAM) calibration curves in deionized water. Charge density (mol %) for each PAM formulation is shown in parenthesis. Error bars are the standard error of the three replicates.
Table 3.1. Hyamine method analytical parameters in deionized water for each polyacrylamide (PAM) formulation.
PAM
A150 A120 A100
Minimum detectable signal ydl (NTU) 2.3 1.8 1.4
Minimum detectable concentration Cmd (mg
L-1)
0.4 0.8 0.9
Sensitivity (regression slope m ± std. error, NTU L mg-1)
3.91 ± 0.06 1.44 ± 0.07 0.90 ± 0.02 Coefficient of determination (r2)a 0.99*** 0.99*** 0.99***
Residual standard deviation (NTU) 3.74 4.02 1.47
a
The symbols *, **, and *** indicates statistical significance of regression model at the 0.05, 0.01, and 0.001 level respectively.
0 50 100 150 200 250
0 10 20 30 40 50
T
u
rb
id
it
y
(
NT
U)
PAM concentration (mg L-1)
A150 (50 %)
A120 (20 %)
3.1.2.PAM calibration curves in soil extracts
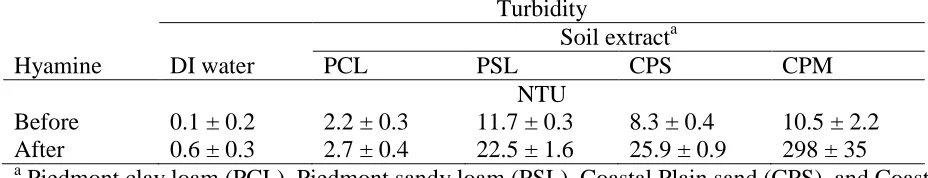
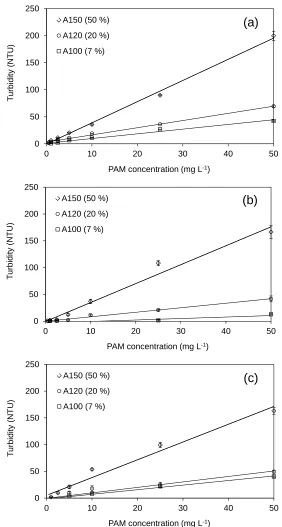
The background turbidity in soil extracts (i.e., with no PAM added and before the hyamine addition) varied by soil materials. For instance, PCL extract had the lowest background turbidity (2.2 ± 0.3 NTU) whereas those of other soil extracts ranged from 8.3 to 11.7 NTU (Table 3.2). The relatively higher background turbidity in PSL and CPS than PCL was most likely attributed to the difference in chemical/mineralogical composition, including differences in clay-sized fraction (McLaughlin and Bartholomew, 2007) and increase in the TOC in the suspension (Lu and Wu, 2001). Upon addition of hyamine, PSL and CPS extracts in the absence of PAM yielded 2- to 3-fold greater readings in turbidity compared to their background turbidity. The extreme case was observed with the CPM blank solution, which yielded 30-fold greater turbidity development compared to its background turbidity. High TOC in the CPM extract (60 mg L-1) likely reacted with hyamine in a manner analogous to PAM, producing high turbidity which could interfere with PAM detection. This result implied that the hyamine test is only useful in solutions with relatively low organic carbon, as discussed later more in detail. The sensitivity (as shown by the slope m) of the hyamine test varied not only with the charge density of PAMs but also with the type of mineral soil extract (PCL, PSL, and CPS) (Fig. 3.2; Table 3.3). For example, m for A150 PAM ranged from 3.47 to 3.90 (NTU L mg-1); m for the PCL was the greatest and comparable to the m in DI water (3.91 NTU L mg-1). As seen in trials in DI water (Fig. 3.1), the sensitivity of the hyamine method in soil extracts decreased with decreasing charge density. The method sensitivity in PSL and CPS was diminished compared to that of DI water, particularly with A120 and A100 PAMs. By comparing the values across soil extracts, it appears the high charge density PAM (A150) was least affected by soil extract types, having a consistently low Cmd value of 0.3 to 1.2 mg L-1.
Table 3.2. Turbidity (mean ± std. dev.) of blank samples in deionized (DI) water and soil extracts before and after hyamine addition.
Turbidity
Soil extracta
Hyamine DI water PCL PSL CPS CPM
NTU
Before 0.1 ± 0.2 2.2 ± 0.3 11.7 ± 0.3 8.3 ± 0.4 10.5 ± 2.2 After 0.6 ± 0.3 2.7 ± 0.4 22.5 ± 1.6 25.9 ± 0.9 298 ± 35 a
Figure 3.2. Polyacrylamide (PAM) calibration data in the Coastal Plain muck extract for three PAMs (A150, A120, and A100). Charge density (mol %) for each PAM is shown in parenthesis. Error bars are the standard error of the three replicates.
0 50 100 150 200 250
0 10 20 30 40 50
T u rb id it y ( NT U)
PAM concentration (mg L-1)
A150 (50 %)
A120 (20 %)
A100 (7 %)
0 50 100 150 200 250
0 10 20 30 40 50
T u rb id it y ( NT U)
PAM concentration (mg L-1)
A150 (50 %)
A120 (20 %)
A100 (7 %)
0 50 100 150 200 250
0 10 20 30 40 50
T u rb id it y ( NT U)
PAM concentration (mg L-1)
A150 (50 %)
A120 (20 %)
A100 (7 %)
(a)
(b)
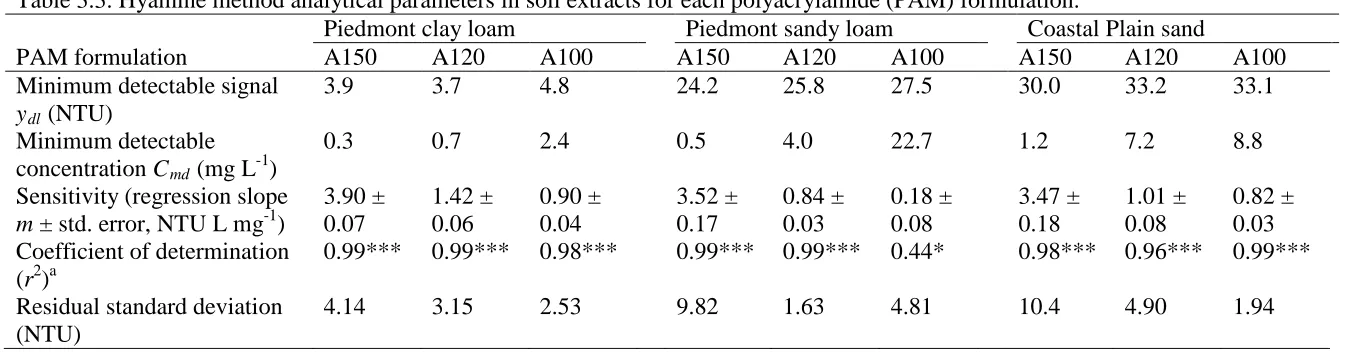
Table 3.3. Hyamine method analytical parameters in soil extracts for each polyacrylamide (PAM) formulation.
Piedmont clay loam Piedmont sandy loam Coastal Plain sand
PAM formulation A150 A120 A100 A150 A120 A100 A150 A120 A100
Minimum detectable signal ydl (NTU)
3.9 3.7 4.8 24.2 25.8 27.5 30.0 33.2 33.1
Minimum detectable concentration Cmd (mg L-1)
0.3 0.7 2.4 0.5 4.0 22.7 1.2 7.2 8.8
Sensitivity (regression slope m ± std. error, NTU L mg-1)
3.90 ± 0.07
1.42 ± 0.06
0.90 ± 0.04
3.52 ± 0.17
0.84 ± 0.03
0.18 ± 0.08
3.47 ± 0.18
1.01 ± 0.08
0.82 ± 0.03 Coefficient of determination
(r2)a
0.99*** 0.99*** 0.98*** 0.99*** 0.99*** 0.44* 0.98*** 0.96*** 0.99*** Residual standard deviation
(NTU)
4.14 3.15 2.53 9.82 1.63 4.81 10.4 4.90 1.94
a
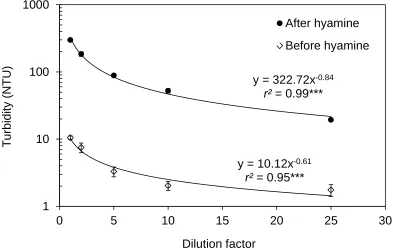
There was no evidence of a turbidity response to increasing PAM concentrations in the CPM extract (Fig. 3.3). High blank turbidity in the CPM extract developed from reaction of hyamine with pre-existing organic carbon (Table 3.2) overwhelmed the turbidity response derived from dissolved PAM. The soil extracts from mineral soils all contained < 5 mg L-1 TOC, whereas the CPM extract had 60 mg L-1 TOC (Table 2.3). Furthermore, the blank turbidity caused by hyamine in mineral soil extracts (2.7 to 25.9 NTU) trended with measured TOC in the extracts (Table 5), suggesting that there is a maximum TOC concentration beyond which interference from TOC renders the test not useful. One approach to handling higher TOC from organic-rich soils would be to dilute the extract, which we did with the CPM extract (Fig. 3.4). Once the dilution reached 25-times, or 2.4 mg L-1 TOC (i.e., 25-times diluted from 60 mg L-1), the CPM + hyamine solution yielded < 20 NTU, similar to the other soils. However, this would raise the Cmd
by the same factor, which may be unacceptable for applications needing greater sensitivity.
Figure 3.3. Polyacrylamide (PAM) calibration data in the Coastal Plain muck extract for three PAMs (A150, A120, and A100). Charge density (mol %) for each PAM is shown in parenthesis. Error bars are the standard error of the three replicates.
0 50 100 150 200 250 300 350 400 450
0 10 20 30 40 50
T
u
rb
id
it
y
(
NT
U)
PAM concentration (mg L-1)
Figure 3.4. Turbidity development in Coastal Plain muck extract affected by dilution before and after hyamine addition. Error bars are the standard error of the three replicates. Note a
logarithmic scale in Y-axis. 3.1.3. Summary
Rapid, simple, and inexpensive determination of PAM in solution could be a very useful tool for determining PAM’s fate in environmental applications. Our results suggest that the turbidimetric method by hyamine is relatively simple and efficient in determining PAM concentration in soil extracts with low organic carbon (< 5 mg TOC L-1). The hyamine test was not sensitive to PAM in the soil extracts with higher TOC (60 mg L-1).
The results have significant implications for the application of this method for determining PAM in soil water samples. Because dissolved organic carbon appears to be a problematic interference, the method may be poorly suited to use for runoff samples containing high organic carbon, such as those found in agricultural settings. In contrast, the method has higher sensitivity and lower detection limit in extracts from mineral soils. This suggests that the method may be well suited for the quantification of PAM in runoff or leachate from construction sites, which often have low OM subsoils exposed at the surface. Because of the dependence of the signal on soil types, developing PAM calibration curves for the soil and anionic PAM of interest using hyamine test will be necessary for the determination of PAM in soil water samples from impacted areas.
y = 322.72x-0.84
r²= 0.99***
y = 10.12x-0.61
r²= 0.95***
1 10 100 1000
0 5 10 15 20 25 30
T
u
rb
id
it
y
(
NT
U)
Dilution factor
After hyamine
3.2.
Runoff Experiment
3.2.1.Runoff initiation and volume
Table 3.4. Comparison of time to runoff initiation (TRI), runoff ratio over applied rainfall (runoff/rainfall), runoff rate, turbidity, total suspended solids (TSS) concentration, erosion rate affected by cover and polyacrylamide (PAM) treatments.
First rainfall event Second rainfall event
Variable No cover +
No PAM
Cover + No PAM
Cover + GPAMa
Cover + DPAMa
No cover + No PAM
Cover + No PAM
Cover + GPAMa
Cover + DPAMa
TRI (min) 12.2 12.8 13.4 18.4 n.d.b n.d.b n.d.b n.d.b
Runoff/rainfall (cm cm-1)
0.48 0.46 0.42 0.32 0.65 0.47 0.65 0.43
Turbidity (NTU)c 2,315 ± 50a 903 ± 64b 78 ± 9c 60 ± 6c 2,314 ± 92a 774 ± 95b 80 ± 17c 79 ± 18c TSS (mg L-1)c 2,670 ± 74a 1,039 ± 208b 79 ± 5c 69 ± 12c 3,417 ± 461a 883 ± 234b 67 ± 3c 55 ± 9c Erosion ratec
(kg ha-1 h-1)
1,460 ± 97a 435 ± 69b 41 ± 6.5c 24 ± 1.7d 1,764 ± 236a 527 ± 173b 38 ± 2.8c 24 ± 4.6c a
GPAM = granular PAM; DPAM = dissolved PAM. b
n.d. = no delay. c
Figure 3.5. Comparison of runoff rate over the first (0 to 50 min) and second (80 to 100 min) rainfall events with a 30-min rest period between rainfall events. The GPAM and DPAM are granular and dissolved polyacrylamide (PAM), respectively.
Figure 3.6. Soil surfaces in runoff boxes after rainfall simulations: (a) no cover + no PAM, (b) cover + DPAM, (c) cover + GPAM, and (d) cover + no PAM. GPAM and DPAM are granular and dissolved polyacrylamide (PAM), respectively.
No runoff Event 1 Rest period Event 2
3.2.2.Turbidity and sediment
Both surface cover and PAM had significant effects on turbidity and TSS in runoff during the first and second rainfall events (p < 0.001). Cover alone reduced turbidity and TSS to less than half of that compared to no cover (Table 3.4). Adding GPAM and DPAM with the cover reduced turbidity (< 80 NTU) and TSS (< 80 mg L-1) by more than an order of magnitude. There was a clear separation between the PAM-treated boxes and the others from the beginning of the tests, which continued through the second rainfall event (Fig. 3.7).
Figure 3.7. Comparison of runoff quality over the first (0 to 50 min) and second (80 to 100 min) rainfall events with a 30-min rest period between rainfall events for (a) turbidity and (b) total suspended solid (TSS) concentration. The GPAM and DPAM are granular and dissolved polyacrylamide (PAM), respectively. Note a logarithmic scale on y-axis.
The cover + DPAM treatment yielded the lowest erosion rate, which was attributable to both the lowest runoff rate and TSS, although TSS was not significantly different from cover + GPAM treatment (Table 3.4). The linear relationships between cumulative rainfall and cumulative sediment loss (Fig. 3.8) had clear separation in their slopes (kg ha-1 mm-1): no cover + no PAM (278) > cover + no PAM > (117) > cover + GPAM (9.1) > cover + DPAM (4.4). These results suggest that the erosion rate for cover + DPAM was 63 times lower than bare soil and 26 times lower than the cover alone. The erosion rate for GPAM was more than twice that of DPAM with cover, which agrees with Babcock and McLaughlin (2013) who found better performance of DPAM over GPAM (applied with wheat straw) in reducing sediment loss.
Figure 3.8. Cumulative sediment loss affected by polyacrylamide (PAM) treatment for (a) No PAM and (b) PAM. The GPAM and DPAM are granular and dissolved polyacrylamide (PAM), respectively.
y = 277.90x
r² = 0.99***
y = 117.18x
r² = 0.99***
0 200 400 600 800 1000 1200 1400 1600 1800
0 1 2 3 4 5 6 7
C um ul at iv e s edi m ent l os s ( k g ha -1)
Cumulative runoff (cm) No cover + No PAM
Cover + No PAM
(a)
y = 9.08x
r² = 0.99***
y = 4.44x
r² = 0.96***
0 10 20 30 40 50 60
0 1 2 3 4 5 6 7
C um ul at iv e s edi m ent l os s ( k g ha -1)
Cumulative runoff (cm) Cover + GPAM
Cover + DPAM
3.2.3.Polyacrylamide loss
The concentration of PAM in runoff declined over time for both application methods (Fig. 3.9). PAM concentrations from the GPAM treatment were 13 to 17 mg L-1 in the first runoff samples of the first and second rain events, respectively, with declines to around 6 mg L-1 at the end. The PAM concentrations in the DPAM treatment were much lower at 4-5 mg L-1 initially, further dropping to < 1 mg L-1 by the end of the second event. Although the PAM loss was much smaller for DPAM than GPAM, both losses were relatively steady and were significantly related to the cumulative runoff amount (Fig. 3.10). Over the course of both rain events, the total losses of PAM in runoff for GPAM and DPAM were 19% and 2% of the applied amounts, respectively. Applied DPAM was likely to be more evenly distributed and with more complete contact with soil particles than GPAM (Seybold, 1994). We observed that the PAM granules sprinkled with water one day before rainfall simulation formed thin slimy patches in the applied area, somewhat similar to a “patch method” in furrow irrigation. The patch method is known to work well in most circumstances, but the PAM patch can be flushed out on steep slopes or high intensity rainfall events (Sojka et al., 2007; Babcock and McLaughlin, 2013). Overall, the DPAM
treatment, which is similar to adding PAM granules to a hydroseeder tank during the filling and mixing processes, was superior in minimizing PAM loss compared to GPAM under our
conditions. However, field studies with more typical natural rainfall intensities have not found significant differences between DPAM and GPAM performance (Babcock and McLaughlin, 2011).
Figure 3.9. Polyacrylamide (PAM) concentration in runoff during the first (0 to 50 min) and second (80 to 100 min) rainfall events with a 30-min rest period between events. The GPAM and DPAM are granular and dissolved PAM, respectively.
Figure 3.10. Granular and dissolved polyacrylamide (GPAM and DPAM, respectively) loss by runoff.
3.2.4.Particle size distribution in eroded sediments
The particle size distribution of eroded sediment was clearly affected by the cover and by PAM application (Table 3.5). The addition of a cover alone increased the mean particle size by 2-fold and the median diameter (D50) by 3-fold. The application of PAM further increased mean particle sizes by more than 2.5- to 3-fold compared to the cover alone. Over the course of the rainfall simulations, the D50 was nearly constant in runoff from the bare soil, but fluctuated for the other treatments (data not shown). We presume that with the high erosion rate in the bare soil treatment, fresh soil was being continually exposed during the rainfall simulation, so the particle size distribution remained constant. The increase in particle size with the sediment being lost would be beneficial in trapping or settling the eroded sediment when appropriate sediment control practices are in place (Haan et al., 1994).
Table 3.5. Summary of particle size (mean ± std. error) averaged over time in eroded sediments. Particle sizea
No cover + No PAM
Cover + No PAM
Cover + GPAM
Cover + DPAM --- µm ---
Mean 24 ± 1.4 50 ± 5.0 161 ± 8.9 137 ± 21
D10 1.4 ± 0.1 6.1 ± 0.7 18 ± 2.2 11 ± 1.8
D50 12 ± 0.3 38 ± 3.0 117 ± 8.8 85 ± 14
D90 60 ± 5.8 108 ± 81 375 ± 26 337 ± 56
a
D10, D50, and D90 are particle diameters corresponding 10th, 50th, and 90th percentile, respectively.
McLaughlin, 2008). There was a clear relationship between particle size (D50) and turbidity in the runoff samples with an exponential decrease in turbidity with increasing D50 (Fig. 3.11). Runoff from control treatment had populated D50 values in finer size range (<15 µm), which contributed the most to turbidity. Runoff from GPAM or DPAM treatment contained
agglomerated sediments as a result of flocculation between PAM molecules and soil particles, having much lower turbidity range (<200 NTU) regardless of their corresponding D50 values.
Figure 3.11. Turbidity as a function of median particle diameter (D50) in eroded sediments. 3.2.5.Summary
With increasing regulation of construction site stormwater runoff, use of PAM is becoming a widespread best management practice for erosion and turbidity control. However, major
uncertainties exist about the optimal application techniques to meet both water quality goals and environmental safety of applied PAM products. Our results demonstrated that excelsior ECB with granular or dissolved PAM (GPAM and DPAM, respectively) applications greatly improved runoff water quality under simulated rainfall. In addition, sediment from both PAM treatments had increased particle sizes compared to untreated sediments, suggesting an enhanced settling potential of the flocculated runoff sediment.
Our study suggests that the method of PAM application for erosion control may be a significant factor in PAM losses by runoff. The DPAM applied in concentrated solution (500 mg L-1) yielded much lower PAM concentration in runoff (1.3 mg L-1 in flow-weighted conc.) than GPAM (8.9 mg L-1) under intense rainfall simulation. These PAM concentrations, particularly with DPAM, are still far below levels considered to be toxic to aquatic organisms (>100 mg L-1). In contrast, the turbidity levels in untreated runoff are likely to be far above known toxicity levels for aquatic organisms (Henley et al., 2000).
y = 105,073x-1.5
r ² = 0.80***
0 500 1000 1500 2000 2500 3000 3500
0 20 40 60 80 100 120 140 160 180
T
u
rb
id
it
y
(
NT
U)
D50(µm)
No cover + No PAM
Cover + No PAM
Cover + GPAM
3.3.
Column Experiment
3.3.1.Hydraulic conductivity
Dissolved PAM applied in two different application modes, pulse and continuous step input respectively, reduced the HC in the receiving columns (Fig. 3.12). Prior to PAM addition, the HC of the study soil was 4 cm h-1, but it was reduced by a 100-fold under the pulse input and 10,000-fold under the step input. The pulse input applied with 500 mg L-1 of dissolved PAM in a small volume (0.6 PV) reduced the HC rapidly within 5 PV and the values of HC remained to be the same after the water source was switched to the DI water. The step input applied with 25 mg L-1 of dissolved PAM reduced the HC in a greater extent (< 0.001 cm h-1) than the pulse input (< 0.1 cm h-1) and its HC values further decreased with continuous addition of the PAM solution.
Figure 3.12. The hydraulic conductivity of the Piedmont clay loam applied with (a) pulse input of PAM solution (500 mg L-1) and (b) step input of PAM solution (25 mg L-1). Note a
logarithmic scale on Y-axis.
Before PAM addition
PAM added as a pulse (0.6 pore volume)
Before PAM addition
Infiltration rate and hydraulic conductivity can either increase or decrease depending on the type and concentration of PAM applied, soil properties, and application protocol. Infiltration
decreases have been found with increasing charge density of polymer material, which was attributable to increased viscosity associated with higher charge density (Malik and Letey, 1992; Falatah et al., 1999). The PAM materials (A150) tested in this study was a high-molecular weight with 50 % anionic charge density, which was likely to block soil pores rapidly in both application modes. Our results are in agreement with previous studies (Ajwa and Trout, 2006; Lentz, 2008) in that infiltration decreased in the PAM-treated soils when concentrated PAM (>125 mg L-1) was applied or continuously applied at low concentration (5-20 mg L-1). Increased filtration rates after PAM addition have been only found when the soils were pretreated with PAM solutions at low concentration (5-20 mg L-1) and allowed to dry before irrigation in
medium-textured soils (Ajwa and Trout, 2006; Sojka et al., 2007; Shainberg et al., 2011). In this case, the cohesive properties of PAM may bind soil particles and peds together, keeping open larger soil pores through which water preferentially flows and this condition would be relevant to irrigation furrows on agricultural fields where soil management would encourage such structure (Sojka et al., 2007).
The value of HC depends on both the soil pore size distribution of the soil and the viscosity of the water (Letey, 1996). There is a proportional inverse relationship between HC and viscosity. In this study, the viscous PAM solution was likely to move preferentially toward greater pore sizes. Sojka et al. (2007) noted that PAM infiltration effects are a balance between prevention of surface sealing and apparent viscosity increases in soil pores. If there is a lack of aggregation (e.g., sandy soil), PAM’s tendency to increase viscosity of the infiltrating water becomes the dominant phenomenon due to the limited influence of soil structure on sealing under these conditions. Column infiltration study by Ajwa and Trout (2006) confirmed that the fluid properties of PAM solutions increased resistance of flow rather than preserving aggregate structure, which resulted in reduced infiltration in sandy loam soil.
3.3.2.PAM displacement
Leaching of dissolved PAM through 2-cm repacked column was strongly retarded by the soil material. In the pulse input, PAM began to elute at 2 PV and stopped its elution after 17 PV (Fig. 3.13). In the step input, PAM began to elute at 12 PV and there was continuous elution of PAM with the continuing PAM throughput (128 PV) at 25 mg L-1. The higher source strength of PAM (500 mg L-1) in the pulse input was likely to result in relatively early elution compared to step input. Later elution in the step input indicates that there was more reaction (i.e., adsorption) initially between soil material and PAM molecules. Relative amount of PAM leached against total amount of PAM was 14 % for the pulse input with 23 PV water throughput and 23 % for the step input with 128 PV. It was notable that the step input up to 128 PV did not allow complete displacement of PAM (i.e., 100 % of PAM leached). This result is in agreement with Sojka et al. (2007) who noted that penetration of high molecular weight PAMs is limited to a few centimeters from the soil surface due to the length of the polymer chain and large number of adsorption sites along the PAM molecule.
Figure 3.13. Mass fraction (%) of the cumulative amount of polyacrylamide (PAM) leached relative to the cumulative amount of PAM applied: (a) pulse input of PAM solution (500 mg L-1 at 30 kg ha-1) and (b) step input of PAM solution (25 mg L-1 at a total rate of 319 kg ha-1). 3.3.3.PAM transport and CXTFIT modeling
Data from PAM breakthrough curve (i.e., C/Co as a function of pore volume, PV) were best-fitted by two-region physical non-equilibrium model in the CXTFIT (Fig. 3.14). Both
equilibrium and chemical non-equilibrium models were poorly fitted (data not shown). With the pulse input, the highest relative concentration was only 0.012 at the PV range between 4 and 8, and its breakthrough curve had a long-tailing, indicating a strong interaction between PAM and soil. With the step input, the relative concentrations in leachate initially increased up to 0.35 but bounced up and down afterward, resulting in a relatively low coefficient of determination of the fitted curve (R2 = 0.50) compared to that of the step input (R2 = 0.97). These results in addition to the decreases in the HC may be associated with the way PAM molecules are adsorbed in the soil and subsequent influences on available pore spaces as conduits for the large PAM molecules. Malik and Letey (1996) postulated that as one segment of PAM molecules is adsorbed in soil
PAM breakthrough
surface, other sections may extend away from the surface into the pore and thus create drag on the flowing water. In other words, the large PAM molecules become deformed to “squeeze” through the pore necks. These phenomenons were likely to reason for the best fitting model found with two-region physical non-equilibrium model that considers two distinct mobile (flowing) and immobile (stagnant) liquid regions in the soil pores.
Figure 3.14. Breakthrough curve of polyacrylamide (PAM) in a 2-cm long column applied with (a) pulse input of PAM solution (500 mg L-1) and (b) step input of PAM solution (25 mg L-1). Retardation factor, which is defined as the number of PV at which the relative concentration of the measured BTC is 0.5, was estimated to be >2300 in both pulse and step input conditions of PAM (Table 3.6). This suggested a strong retardation of dissolved PAM into the soil material regardless of the PAM application modes. The mobile water fraction (β) ranged from 0.02 to 0.07, indicating limited pore spaces available for the large PAM molecule to flow through. This may cause larger immobile domain and more chemical reaction between mobile and immobile
0.000 0.002 0.004 0.006 0.008 0.010 0.012 0.014
0 5 10 15 20 25 30
R el at iv e c onc ent rat ion ( C /C o ) Pore volume Measured Fitted (a) 0.0 0.1 0.2 0.3 0.4 0.5 0.6
0 50 100 150 200
R el at iv e c onc ent rat ion ( C /C o ) Pore volume Measured Fitted (b)
R2= 0.50
phases. The ω values determined by CXTFIT were low, indicating that diffusive mass transfer between mobile and immobile phases was slow.
Table 3.6. PAM transport parameters obtained from the CXTFIT simulations. PAM application mode
CXTFIT output
R Dm β ω
cm2 h-1
Pulse 2321 2.06 0.02 0.008
Step 2373 1.57 0.07 0.027
R = retardation factor; Dm = dispersion coefficient of mobile phase; β = mobile water fraction; ω
= mass transfer coefficient between mobile and immobile phases. 3.3.4.PAM sorption isotherm
Batch PAM sorption data for the range of concentrations of interest (≤ 100 mg L-1) were fitted well by the Langmuir model with an r2 of 0.99 (Fig. 3.15). Previous researches have shown similar L-shaped PAM sorption in kaolinte (Nabzar et al., 1984), morillonite (Ben-Hur et al., 1992), and organic-matter removed soils (Lu et al., 2002). The linearized Langmuir yielded 1,353 mg kg-1 for Smax and 1.31 L mg-1 for KL. The initial PAM concentraton at 25 mg L-1 became 0.5 mg L-1 after the 24-h equilibration and the R value at 0.5 mg L-1 (i.e., slope in the isotherm curve) was estimated to be 2,061, which was close to that from the column experiment.
Figure 3.15. Polyacrylamide sorption isotherm for the study soil material and a model fit using Langmuir equation.
0 200 400 600 800 1000 1200 1400
0 5 10 15 20 25 30 35 40
S
or
pt
ion am
ount
(
m
g
k
g
-1)
Equilibrium conentration (mg L-1)
Measured
3.3.5.Summary
Our study demonstrated that PAM application under saturated condition without a drying period could greatly reduce the HC in the 2-cm repacked sandy clay loam soil. The reduction of HC was greater with the step input of PAM solution. Leaching of applied PAM solution was strongly limited as the soil material acted as a strong sorbent for the PAM molecules. The interaction between the viscous PAM molecules and soil under saturated condition favored the potential use of the PAM toward seepage-inhibiting sealants. The CXTFIT results suggested that dual porosity model (two physical-regions, mobile and immobile) was the best fit for our observed data and physical non-equilibrium was established once the PAM solution was applied to the surface soil under saturated condition.
4.0 Conclusions and Recommendations
Previous studies have clearly indicated the potential benefits of using PAM for erosion and sediment control. This study confirms the benefits and provides further information on the details of how PAM behaves when applied to soil. The following is a summary of each part of the study and the implications of the results:
1) The hyamine test can be used to detect PAM in clear water to < 1 mg L-1, several orders of magnitude below typical levels of concern. In water extracted with soil materials, the detection limit ranges from 0.3-22 mg L-1 depending on the soil and PAM properties, with higher values with lower PAM charge densities. Sediment sources with organic carbon content >0.5% produce interferences which make this method impractical for PAM detection. If PAM concentrations in runoff water are desired, each site would have to have a response curve developed specific to that site. The method is relatively inexpensive and uses simple turbidity meters commonly found in water testing operations.
2) The rainfall simulation tests supported previous work indicating that the addition of PAM to a groundcover significantly reduces erosion and turbidity in runoff water. Under the relatively heavy rainfall simulation, dissolved PAM was slightly more effective since it was fully activated and reactive. Peak PAM concentrations in runoff were higher with granular applications (13-17 mg L-1) compared to dissolved (4-5 mg L-1), with resulting total losses of 19% and 2% of applied, respectively. This suggests that dissolved PAM is preferred over granular PAM for erosion control, but the application of either is highly beneficial in reducing erosion and improving runoff water quality as vegetation is being established. The concentrations of PAM in runoff are below levels of concern for environmental exposures.
3) The application of PAM increased the size of particles eroded from the test boxes by a factor of 2-3X. The larger particle size would greatly enhance settling behind typical practices on construction sites, such as silt fences and sediment basins.
4) PAM greatly reduced infiltration when applied either as a concentrated solution (similar to a hydroseeding use) once or as a more dilute solution constantly, when applied to a saturated soil. However, other studies have shown that if the soil is allowed to dry, this effect is reversed.