Machining Parameter Optimization in
Electrical Discharge Machining by Using
Grey Relational Analysis and ANOVA
Mary George1, Amjith.T.R2
P.G. Student, Department of Mechanical Engineering, Sree Buddha College Engineering, Pattoor, Kerala, India1
Assistant Professor, Department of Mechanical Engineering, Sree Buddha College Engineering, Pattoor, Kerala, India2
ABSTRACT: Optimization of machining parameters in the Electric Discharge Machining (EDM) process on Stainless Steel 304 using Grey Relational Analysis and ANOVA has been proposed to evaluate and estimate the effect of machining parameters on the response. The experiments are carried out using three electrodes they are Cu, WCu, and Graphite .The major response selected for this analysis is Surface Roughness. The corresponding machining parameters considered for this study are current, voltage and spark gap. The design of experiments is carried out using L9 orthogonal array, which is being done with the help of Minitab. The results were analyzed using Grey Relational Analysis and ANOVA. In which Grey Relational Grade (GRG) calculated based on GRA, to optimize the EDM process. ANOVA is also performed to identify the Statistical significance of parameters. These results provide useful information on how to control the machining parameters and corresponding Surface finish to obtain high productivity and better accuracy of the EDM process.
KEYWORDS: EDM, Surfaceroughness, Grey relational analysis, ANOVA, Optimization
I. INTRODUCTION
In which machining parameter such as surface roughness has been incorporated to enhance the effectiveness of the machining parameter of SS304 material in Electrical Discharge Machining using Cu, WCu and Graphite. Electrical Discharge Machining is generally an electrical energy based processes, electrical energy is used to cut the material to get the final shape and size. It is also known as spark erosion machining or electro-erosion machining. EDM has found ready application in the machining of hard metals or alloys which cannot be machined by conventional methods. Alloys used in aeronautics industry. This process capable of machining complicated Component. Effective movement through EDM makes it more commonly offered and also beneficial above outdated machining procedures. In this process the metal is removed by intense heat of electric spark. The spark discharges (flow of a stream of electrons) are created by maintaining sufficient potential difference between tool and work piece, separated by a dielectric in a very small gap. A large number of electrons emitted from tool (cathode) impinges on work material (anode) and thus develop a very high temperature (20000̊c). This temperature is sufficient to melt and even vaporize a part of a metal. Then the metal removal from the work piece takes place.
II. WORK PIECE AND ELECTRODE MATERIAL
Among the difficult-to-cut materials, stainless steel (SS 304) is the material extensively used in manufacturing because of its excellent wear and corrosion resistance. It has high strength, high ductility, and high work hardening tendency of stainless steels which make its machinability difficult. In addition, during the investigation on the machinability of SS 304 in conventional machining it has been observed that problems such as poor surface finish and high tool wear are common. So it bonds very strongly to the cutting tool during cutting and when the chip is broken it may bring a fragment of the tool with it, particularly when cutting with cemented carbide tools [7].Table 1 shows the composition of SS304 and Table 2 shows the properties of SS304.
Carbon
(C)
Manganese
(Mn)
Phosphorus Sulfur
(S)
Silicon
(Si)
Chromium
(Cr)
Nickel
(Ni)
Nitrogen
(N)
Iron
(Fe)
0.08% 2.00% 0.045% 0.030% 0.75% 18-20% 8-12% 0.10% 66.345-74 %
Table 1 Composition of SS304
Properties SS304 Density (g/cm³) 8.03 Melting point ( ̊c) 1400 – 1455 Electrical resistivity (μΩcm) 72
Hardness HB 123 Table2 Properties of SS304
EDM electrode materials and components consist of highly conductive and arc erosion-resistant materials such as Copper, Tungsten-Copper and Graphite. EDM is the process that uses an electrical spark to erode metal. When it is impinged by positive ions tool material should be such that it would not undergo much tool wear. EDM electrodes are manufactured in variety of forms such as tube shaped, or bar stock, depending on the EDM electrode materials used and the application.Table 3 shows comparison of electrode materials properties.
Properties Graphite Copper Copper Tungsten
Composition 100% 99.9% 75% Tungsten, 25% copper
Density (g/cm³) 1.811 8.96 15.2
Melting point ( ̊c) 3675 1084 3410
Electrical resistivity (μΩcm) 14 9 5.5
Hardness HB 10 HB 100 HB200
III.EXPERIMENTAL METHOD AND ANALYSIS
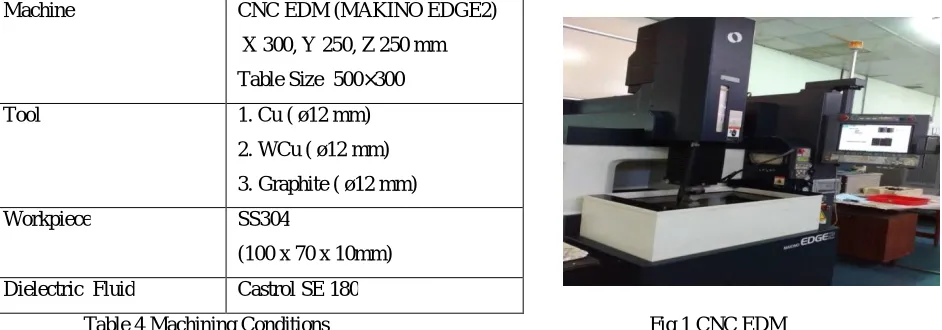
By using Taguchi plan of experiment and by using the procedures explained in the previous chapters, Total 27 number of experiments by using 3 electrodes was conducted on SS304material in Electrical Discharge Machining. Table 4 shows the machining conditions and fig 1 shows CNC EDM machine used for the experiment.
Machine CNC EDM (MAKINO EDGE2)
X 300, Y 250, Z 250 mm
Table Size 500×300
Tool 1. Cu ( ø12 mm)
2. WCu ( ø12 mm)
3. Graphite ( ø12 mm)
Workpiece SS304
(100 x 70 x 10mm)
Dielectric Fluid Castrol SE 180
Table 4 Machining Conditions Fig 1 CNC EDM
In which voltage, Current and Spark gap is selected as input parameters and its levels considered shown in the table 5
Process Parameter Unit Level1 Level 2 Level3
Voltage V 40.00 57.5 75.00
Current A 2.85 5.71 8.57
Spark gap mm 0.1 0.15 0.2
Table 5 EDM process parameters
In which L9 Orthogonal Array design is used to set the control parameters to evaluate the process performance. The design used in this work and the corresponding results of surface roughness are obtained.
IV.OPTIMIZATION STRATEGY AND RESULTS
In this project optimization of machining parameters are done by using two statistical tools. Grey relational analysis and Analysis of variance.
Grey relational analysis (GRA)
The grey relational analysis (GRA) associated with the Taguchi method represents a rather new approach to optimization developed by Deng in 1989. The Grey theory is based on the random uncertainty of small samples which provide an evaluation technique to solve certain problems of system that are complex and incomplete information. The Grey relational analysis (GRA) is an effective soft-tool to analyze performance characteristics.
Normalization of experimental results in GRA
Where, ∗( )is the generating value of Grey relational analysis; min ( )is the minimum value of ( ); max
( )is the maximum value of ( ).
Grey Relational Coefficient (GRC)
For the data pre-processing then a grey relational coefficient (GRC or φ) is calculated to show the relationship
between the ideal and actual experimental results which are normalized. The grey relational coefficient can be expressed as follows
( ) = ∆ + ∆
∆ ( ) + ∆
Where, δ is the weightage coefficient or is distinguishing or identification coefficient (δ Є [0, 1]) and is taken as 0.5
Grey Relational Grade
After obtaining the grey relational coefficient, the grey relational grade is calculated by taking the average of grey relational coefficients. The grey relational grade is defined as follows.
=1 ( )
where, γi = Grey Relational Grade, n = Number of response factors
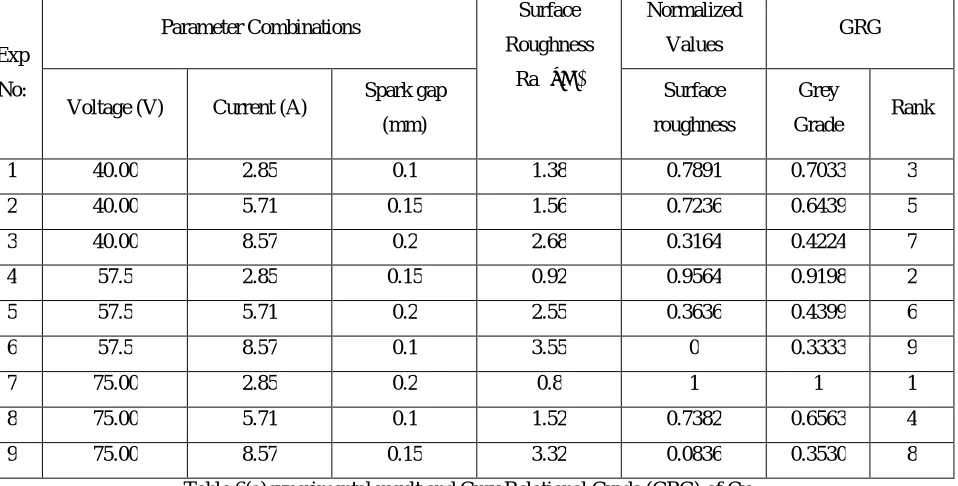
The calculation of first grey relational grade is given below as an example. All other grades are calculated similarly. Table 6(a), 6(b), 6(c) shows the design matrix and the corresponding experimental values and the result obtained from the GRA for the Grey Relational Grade are shown.
Exp
No:
Parameter Combinations Surface Roughness
Ra (μm)
Normalized
Values GRG
Voltage (V) Current (A) Spark gap (mm)
Surface
roughness
Grey
Grade Rank
1 40.00 2.85 0.1 1.38 0.7891 0.7033 3
2 40.00 5.71 0.15 1.56 0.7236 0.6439 5
3 40.00 8.57 0.2 2.68 0.3164 0.4224 7
4 57.5 2.85 0.15 0.92 0.9564 0.9198 2
5 57.5 5.71 0.2 2.55 0.3636 0.4399 6
6 57.5 8.57 0.1 3.55 0 0.3333 9
7 75.00 2.85 0.2 0.8 1 1 1
8 75.00 5.71 0.1 1.52 0.7382 0.6563 4
9 75.00 8.57 0.15 3.32 0.0836 0.3530 8
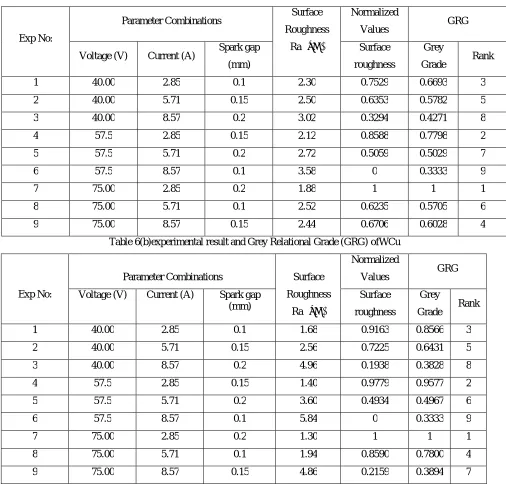
Exp No:
Parameter Combinations Surface Roughness
Ra (μm)
Normalized
Values GRG
Voltage (V) Current (A) Spark gap (mm)
Surface
roughness
Grey
Grade Rank
1 40.00 2.85 0.1 2.30 0.7529 0.6693 3
2 40.00 5.71 0.15 2.50 0.6353 0.5782 5
3 40.00 8.57 0.2 3.02 0.3294 0.4271 8
4 57.5 2.85 0.15 2.12 0.8588 0.7798 2
5 57.5 5.71 0.2 2.72 0.5059 0.5029 7
6 57.5 8.57 0.1 3.58 0 0.3333 9
7 75.00 2.85 0.2 1.88 1 1 1
8 75.00 5.71 0.1 2.52 0.6235 0.5705 6
9 75.00 8.57 0.15 2.44 0.6706 0.6028 4
Table 6(b)experimental result and Grey Relational Grade (GRG) ofWCu
Exp No:
Parameter Combinations Surface
Roughness
Ra (μm)
Normalized
Values GRG
Voltage (V) Current (A) Spark gap (mm)
Surface
roughness
Grey
Grade Rank
1 40.00 2.85 0.1 1.68 0.9163 0.8566 3
2 40.00 5.71 0.15 2.56 0.7225 0.6431 5
3 40.00 8.57 0.2 4.96 0.1938 0.3828 8
4 57.5 2.85 0.15 1.40 0.9779 0.9577 2
5 57.5 5.71 0.2 3.60 0.4934 0.4967 6
6 57.5 8.57 0.1 5.84 0 0.3333 9
7 75.00 2.85 0.2 1.30 1 1 1
8 75.00 5.71 0.1 1.94 0.8590 0.7800 4
9 75.00 8.57 0.15 4.86 0.2159 0.3894 7
Table 6(c)experimental result and Grey Relational Grade (GRG) of Gr
Analysis of variance (ANOVA)
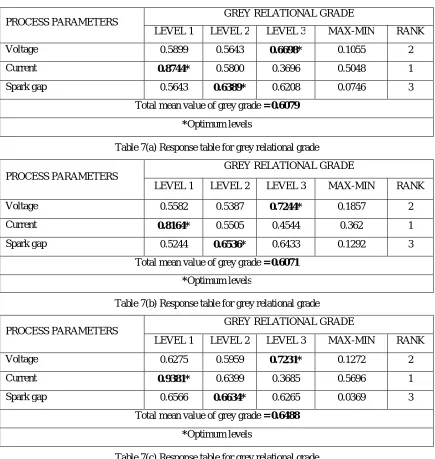
significant process parameter and voltage, spark gap are the insignificant process parameters effecting the process response. Hence the optimal machining parameters are voltage at level 3, current at level 1, spark gap at level 2. Shown in the Table 7(a), 7(b), 7(c)
PROCESS PARAMETERS GREY RELATIONAL GRADE
LEVEL 1 LEVEL 2 LEVEL 3 MAX-MIN RANK
Voltage 0.5899 0.5643 0.6698* 0.1055 2
Current 0.8744* 0.5800 0.3696 0.5048 1
Spark gap 0.5643 0.6389* 0.6208 0.0746 3
Total mean value of grey grade = 0.6079
*Optimum levels
Table 7(a) Response table for grey relational grade
PROCESS PARAMETERS
GREY RELATIONAL GRADE
LEVEL 1 LEVEL 2 LEVEL 3 MAX-MIN RANK
Voltage 0.5582 0.5387 0.7244* 0.1857 2
Current 0.8164* 0.5505 0.4544 0.362 1
Spark gap 0.5244 0.6536* 0.6433 0.1292 3
Total mean value of grey grade = 0.6071
*Optimum levels
Table 7(b) Response table for grey relational grade
PROCESS PARAMETERS GREY RELATIONAL GRADE
LEVEL 1 LEVEL 2 LEVEL 3 MAX-MIN RANK
Voltage 0.6275 0.5959 0.7231* 0.1272 2
Current 0.9381* 0.6399 0.3685 0.5696 1
Spark gap 0.6566 0.6634* 0.6265 0.0369 3
Total mean value of grey grade = 0.6488
*Optimum levels
Table 7(c) Response table for grey relational grade
From the results it state that current is the most significant process parameter in machining SS304 material. Table 8(a),
Source DOF SS MS F % Contribution
Voltage 2 0.0182 0.0091 0.3383 3.8973
Current 2 0.3858 0.1929 7.1710 82.61
Spark gap 2 0.0091 0.0046 0.1710 1.9699
Error 2 0.0537 0.0269 1 11.5203
Total 8 0.4668 8.6803 100
Table 8(a) Results of ANOVA using Cu electrode in SS304
Source DOF SS MS F % Contribution
Voltage 2 0.0625 0.0312 14.8571 20.2203
Current 2 0.2109 0.1055 50.2381 68.3734
Spark gap 2 0.0309 0.155 7.3809 10.0453
Error 2 0.0042 0.0021 1 1.3609
Total 8 0.3085 73.4761 100
Table 8(b) Results of ANOVA using WCu electrode in SS304
Source DOF SS MS F % Contribution
Voltage 2 0.0263 0.01315 1.0779 4.8696
Current 2 0.4870 0.2435 19.9590 90.1682
Spark gap 2 0.0023 0.0012 0.0984 0.4445
Error 2 0.0243 0.0122 1 4.5177
Total 8 0.5399 22.1353 100
Table 8(c) Results of ANOVA using Gr electrode in SS304
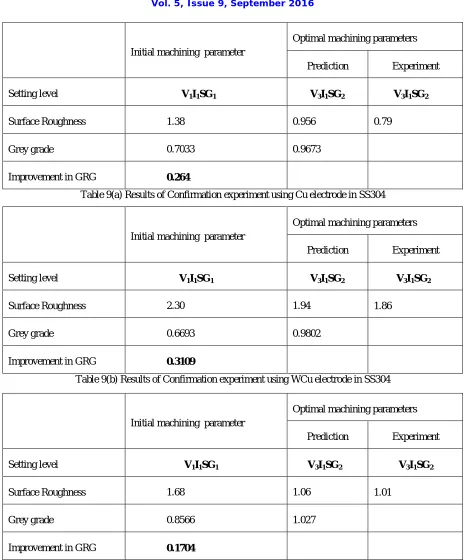
Confirmation experiment
After evaluating the parameter settings the next step is to predict and verify enhancement of the quality characteristics using the optimized parametric combination. The estimated grey relational grade
γʹʹ= γm+∑ (γi - γm)
where, γm= Total mean grey relational grade, γi= Mean grey relational grade at the optimum level
Initial machining parameter
Optimal machining parameters
Prediction Experiment
Setting level V1I1SG1 V3I1SG2 V3I1SG2
Surface Roughness 1.38 0.956 0.79
Grey grade 0.7033 0.9673
Improvement in GRG 0.264
Table 9(a) Results of Confirmation experiment using Cu electrode in SS304
Initial machining parameter
Optimal machining parameters
Prediction Experiment
Setting level V1I1SG1 V3I1SG2 V3I1SG2
Surface Roughness 2.30 1.94 1.86
Grey grade 0.6693 0.9802
Improvement in GRG 0.3109
Table 9(b) Results of Confirmation experiment using WCu electrode in SS304
Initial machining parameter
Optimal machining parameters
Prediction Experiment
Setting level V1I1SG1 V3I1SG2 V3I1SG2
Surface Roughness 1.68 1.06 1.01
Grey grade 0.8566 1.027
Improvement in GRG 0.1704
The table 9(a), 9(b), 9(c) shows the comparison of process responses for initial and optimal machining parameters. In Cu, WCu, Gr electrodes Ra value reduced from 1.38 microns to 0.79 microns i.e. 0.59% reduction. 2.30 microns to 1.86 microns is obtained i.e. 0.44 % reduction. 1.68 microns to 1.01 microns i.e. 0.67 % reduction respectively.
V. CONCLUSION
An experimental study to analyze the effects of Electrical Discharge Machining parameters such as Voltage, Current and Spark Gap on response parameters such as Surface roughness during machining SS04 using three electrodes Cu, WCu and Graphite are conducted and optimized using Grey Relational Analysis (GRA) and ANOVA.
1. Optimum Surface finish for SS304 using three electrode materials are found using GRA and the values are obtained as Voltage 75.00V (level 3), Current 2.85A (level 1) and Spark gap 0.15mm (level 2).
2. The contribution of each parameter is obtained as Voltage is 3.89 %, Current is 82.61% and Spark gap is 1.97 %. From the study, Current is the most significant process parameter in machining SS304 material using Cu electrode in EDM.
3. The contribution of each parameter is obtained as Voltage is 20.22 %, Current is 68.37 % and Spark gap is 10.04 %. From the study, Current is the most significant process parameter in machining SS304 material using WCu electrode in EDM.
4. The contribution of each parameter is obtained as Voltage is 4.87 %, Current is 90.17 % and Spark gap is 0.44 %. From the study, Current is the most significant process parameter in machining SS304 material using Gr electrode in EDM.
5. Mathematical models which join the input parameters and output responses using regression analysis using MINITAB17 software is obtained.
6. Comparing initial experiment and confirmation experiment, using Cu electrode it is found that surface roughness reduces from 1.38 microns to 0.79 microns i.e. 0.59% reduction.
7. Comparing initial experiment and confirmation experiment, using WCu electrode then the reduction of surface roughness from 2.30 microns to 1.86 microns is obtained i.e. 0.44 % reduction.
8. Comparing initial experiment and confirmation experiment, using Gr electrode it is found that surface roughness reduces from 1.68 microns to 1.01 microns i.e. 0.67 % reduction.
The study can be extended by considering more number of parameters. Responses in machining of other materials with similar machining characteristics can be calculated and can find most suitable optimum parameter combination; it can be used as future reference for machining performance improvement factor in machining operation.
REFERENCES
[1] Jong Hyuk Jung and Won Tae Kwon.,“Optimization of EDM process for multiple performance characteristics using Taguchi method and Grey relational analysis”. J. Mechanical Science and Technol.1083-1090,2010.
[2] Rajmohan.T,Prabu R., et al.,“Optimization of machining parameters in electrical discharge machining(edm) of 304 stainless steel”. Procedia Engineering 38 .1030 – 1036,2012.
[3] K. H. Ho and S. T. Newman., “State of the art electrical discharge machining (EDM)”, Int. J. Mach. Tools Manuf.43.1287-1300,2003.
[4] G. Krishna MohanaRao., et al., “Development of hybrid model and optimization of surface roughness in electric discharge machining using artificial neural networks and genetic algorithm”.J. Mater. Process Technol. 1512–1520,2009.
[5] N. Natarajan, R.M.Arunachalam., et al., “Experimental study and analysis of micro holes machining in EDM of SS 304”.Int. J. Machining and Machinability of Materials, Vol. 13, No.,2013.
[6] Vishnu D Asal., et al., “Optimization Of Process Parameters Of EDM Using ANOVA Method”. Int. J. Engineering Research and Applications.
Vol. 3, Issue 2, pp.1119-1125,2013.