ISSN(Online): 2319-8753 ISSN (Print): 2347-6710
I
nternational
J
ournal of
I
nnovative
R
esearch in
S
cience,
E
ngineering and
T
echnology
(A High Impact Factor, Monthly, Peer Reviewed Journal)
Visit: www.ijirset.com
Vol. 6, Issue 10, October 2017
Design and analysis of a Gear Box Motor
Current
P. Jagadesh 1, T. Seshaiah M.E. (Ph.D.)2,
M.Tech –Machine Design Student, QISCET- Ongole, India1 Associate Professor, QISCET- Ongole, India2
ABSTRACT: Even though there are a number of condition monitoring and analysis techniques, researchers are in search of a simple and easy way to monitor vibration of a gearbox, which is an omnipresent and an important power transmission component in any machinery. Motor current signature analysis (MCSA) has been the most recent addition as a non- intrusive and easy to measure condition monitoring technique.
In gearboxes, load fluctuations on the gearbox and gear defects are two major sources of vibration. Further at times, measurement of vibration in the gearbox is not easy because of the inaccessibility in mounting the vibration transducers. The objective of this paper is to detect artificially introduced defects in gears of a multistage automotive transmission gearbox at different gear operations using MCSA as a condition monitoring technique. Steady as well as fluctuating load conditions on the gearbox are tested for both vibration and current signatures during different gear operations.
KEYWORDS: Vibration, Motor, Transducers, MCSA, Gear box.
I. INTRODUCTION
Gearbox is an important machinery component in any industry. Any defect in gears lead to machine downtime resulting in loss of production. A number of techniques have been applied in order to diagnose the fault. Motor Current Signature Analysis is employed to monitor induction motors and its bearings. Initially starting current transients were monitored to study torsional vibrations which were later applied to detect motor bearing damage.
Motor Current Signature Analysis (MCSA) is an electric machinery monitoring technology developed by the Oak Ridge National Laboratory. It provides a highly sensitive, selective, and cost-effective means for online monitoring of a wide variety of heavy industrial machinery. It has been used as a test method to improve motor bearing wear assessment for inaccessible motors during plant operation. In 1989, ORNL used it to monitor a variety of electric motor driven devices at the Philadelphia Electric Company Eddystone Generating Station for detecting the degradation in aging power plant equipment. In a comprehensive assessment of the aging of motor operated valves (MOVs), MCSA has shown to be capable of detecting, differentiating, and tracking the progress of the MOV abnormalities, such as abnormal line voltage and worm gear tooth wear. Extensive test data support that MCSA has a number of inherent strengths, the most notable being that it:1.Provides nonintrusive monitoring capability at a location remote from the equipment. 2.Provides degradation and diagnostic information comparable to conventional instrumentation. 3.Offers high sensitivity to a variety of mechanical disorders affecting operational readiness. 4.Offers means for separating one form of disorder from another. 5.Can be performed rapidly and as frequently as desired by relatively unskilled personnel using portable, inexpensive equipment. 6.Is equally applicable to high-powered and fractional horsepower machines, ac and dc motors.
ISSN(Online): 2319-8753 ISSN (Print): 2347-6710
I
nternational
J
ournal of
I
nnovative
R
esearch in
S
cience,
E
ngineering and
T
echnology
(A High Impact Factor, Monthly, Peer Reviewed Journal)
Visit: www.ijirset.com
Vol. 6, Issue 10, October 2017
mechanical system and converting them into electric current signals that flow along the cable supplying power to the motor. These signals, though small in relation to the average current drawn by the motor, can be extracted reliably and non-intrusively and processed to provide indicators of the condition (signatures) of the motor. The trend of these signatures can be determined over time to give information concerning the motor and the load.The basis of fault detection is the difference in normalized current RMS values of both healthy and faulty bearings. Broken rotor and eccentricity in the rotor and the stator of an induction motor result in side bands of electric supply line frequency. Prior knowledge of spatial position of fault and the load torque with respect to the rotor is necessary as the effects of load torque and faulty conditions are difficult to separate.Current signals can be analyzed in the time-domain or the frequency-domain. The former is also capable of analyzing systems during transients, such as during the initial or final operation of the system. MCSA requires amplitude information of the motor currents. The currents have imbedded information on the driven loads, with the information being available in the frequency domain or the time domain. To obtain rotor speed, frequency-domain analysis is chosen.Motor current signals can be obtained from the outputs of current transducers which are placed non- intrusively on one of the power leads. The resulting raw current signals are acquired by computers after they go through conditioning circuits and data interfaces.
Fig:-1. Basic flow chart of MCSA.
Fig: 2. Process of MCSA
II.EXPERIMENTAL WORK
ISSN(Online): 2319-8753 ISSN (Print): 2347-6710
I
nternational
J
ournal of
I
nnovative
R
esearch in
S
cience,
E
ngineering and
T
echnology
(A High Impact Factor, Monthly, Peer Reviewed Journal)
Visit: www.ijirset.com
Vol. 6, Issue 10, October 2017
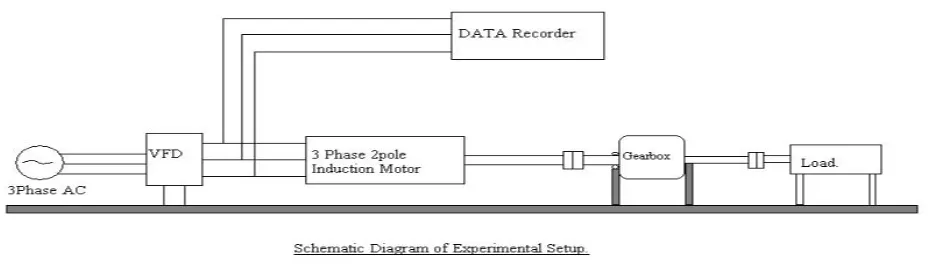
speed of induction motor (frequency f1).In addition, to regulate the input current frequency in the induction motor, a Variable Frequency Drive is coupled with motor. Then there are current probes to measure the current response. Other end of the probe is connected to data recorder. Using which current signature is recorded.
Fig: 3. Power flow diagram.
3 phase Induction Motor:An induction motor (IM) is a type of asynchronous AC motor where power is supplied to the rotating device by means of electromagnetic induction. Another commonly used name is squirrel cage motor because the rotor bars with short circuit rings resemble a squirrel cage. The field windings in the stator of an induction motor set up a rotating magnetic field around the rotor. The relative motion between this field and the rotation of the rotor induces electric current in theconductive bars. In turn these currents lengthwise in the conductors react with the magnetic field of the motor to produce force acting at a tangent to the rotor, resulting in torque to turn the shaft.
Fig: 4. A squirrel cage Rotor.
ISSN(Online): 2319-8753 ISSN (Print): 2347-6710
I
nternational
J
ournal of
I
nnovative
R
esearch in
S
cience,
E
ngineering and
T
echnology
(A High Impact Factor, Monthly, Peer Reviewed Journal)
Visit: www.ijirset.com
Vol. 6, Issue 10, October 2017
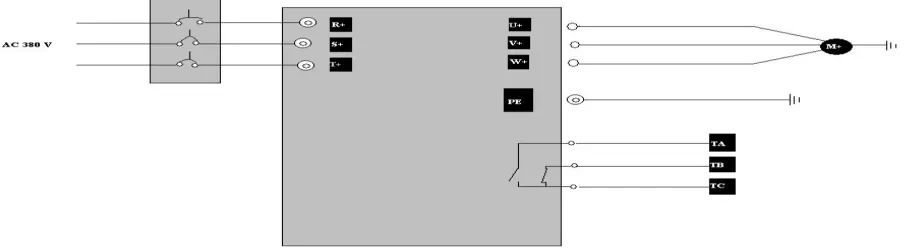
Fig 5: VFD system schematic
Fig: 6: Variable Frequency Drive with its circuit board.
Make: Pro-star; Rated Power: 3.7 kW; Voltage: 380 V; Current: 5 A ;Frequency: Input: 50 Hz ,Output:0-240 Hz. Type: 3 phase. Weight: 4.5 kg.
Fig: 7. Wiring diagram: 1.
ISSN(Online): 2319-8753 ISSN (Print): 2347-6710
I
nternational
J
ournal of
I
nnovative
R
esearch in
S
cience,
E
ngineering and
T
echnology
(A High Impact Factor, Monthly, Peer Reviewed Journal)
Visit: www.ijirset.com
Vol. 6, Issue 10, October 2017
voltage of the motor to 380 V.Entered F803 parameter and set the rated current to the motor to 4.3 A.Entered F804 parameter and set the number of poles of the motor to 2.Entered F805 parameter and set rotary speed of the motor to 1440 rpm.Entered F800 parameter and set it to 1 or 2 to allow measuring the parameter of the motor(1= running parameter mode, 2=static parameter mode. In the static parameter mode motor was supposed to be disconnected from load.).Pressed “Run” key to measure the parameters of the motor. After completion of the measurement, the motor stopped running and relevant parameters were stored in F806- F809.Set the functional parameters of VFD.Entered F106 parameter and set it to 0; selected the control mode to sensorless vector control.Entered F203 parameter and set it to 0.Entered F111 parameter and set it to frequency 50.0 Hz.Entered F200 parameter and set it to 0; selected the mode of start to keyboard control. Entered F201 parameter and set it to 0; selected the mode of stop to keyboard control.Entered F202 parameter and set it to 0; selected co-rotation locking.Pressed the run key to start the VFD.During running, current frequency was changed by pressing or . Pressed the “Start/Stop” key once, the motor decelerated and it stopped running.Switched off the air switch and de-energized the VFD.
Worm Gearbox:A worm drive is a gear arrangement in which a worm (which is a gear in the form of a screw) meshes with a worm gear (which is similar in appearance to a spur gear, and is also called a worm wheel). Like other gear arrangements, a worm drive can reduce rotational speed or allow higher torque to be transmitted. A gearbox designed using a worm and worm- wheel will be considerably smaller than one made from plain spur gears and has its drive axes at 90° to each other. Following figure shows the diagram of worm gears and the one following it is the available worm gearbox for our experiment.
Fig: 8. Gearbox used in the experiment.
ISSN(Online): 2319-8753 ISSN (Print): 2347-6710
I
nternational
J
ournal of
I
nnovative
R
esearch in
S
cience,
E
ngineering and
T
echnology
(A High Impact Factor, Monthly, Peer Reviewed Journal)
Visit: www.ijirset.com
Vol. 6, Issue 10, October 2017
.
Fig: 10. Motor coupled with the gearbox.
Fig: 11. Motor coupled with the gearbox.
III. RESULTS
The Current Signature experiment was performed over a frequency range of 0-100 Hz generated by Variable Frequency Drive. 3 different times the following results were recorded by the data recorder (CRO in our experiment). Based on the results obtained the following observations are made.
ISSN(Online): 2319-8753 ISSN (Print): 2347-6710
I
nternational
J
ournal of
I
nnovative
R
esearch in
S
cience,
E
ngineering and
T
echnology
(A High Impact Factor, Monthly, Peer Reviewed Journal)
Visit: www.ijirset.com
Vol. 6, Issue 10, October 2017
Graph 1: Result of Experiment no. 1.
Graph 2: Result of Experiment no. 2.
ISSN(Online): 2319-8753 ISSN (Print): 2347-6710
I
nternational
J
ournal of
I
nnovative
R
esearch in
S
cience,
E
ngineering and
T
echnology
(A High Impact Factor, Monthly, Peer Reviewed Journal)
Visit: www.ijirset.com
Vol. 6, Issue 10, October 2017
Sidebands of rotating frequencies across the line frequency are observed in the current spectra. Rotor eccentricity in the induction motor is also traced by examining the remaining sidebands of the line frequency in the current signatures. The amount of load affects the rotor speed, the slip factor also changes in each case. The amplitudes of the sidebands due to rotor eccentricity are very large after the load removal than those before the load removal. It is due to the fact that the load acts as a damping factor for vibrations due to the rotor eccentricity. In an induction motor, the speed is inversely related with the load, however when it is coupled with a gearbox, a large fluctuation of speed of the order of 0.5 Hz (30 rpm) is observed.Tracking of the rotating speed of gearbox is not effective in monitoring the gearbox. The reason is that the gearbox casing vibration is retransmitted to the gearbox through flexible rolling element bearing, and very large excitation of the gearbox takes place due to various time-varying parameters like tooth mesh stiffness, frictional forces and torques and bearing forces; thereby causing a large speed fluctuation
IV. CONCLUSION
This project was concerned to use MCSA to detect defects in Bearings as well as Gearboxes and to measure load fluctuations. It considered a normal operating worm gear drive with introduced gear defects. Following inferences can be drawn out of the above study:
1. There are sideband frequencies of the gearbox; such as rotating frequencies of input shaft, output shaft and gear mesh frequencies. But the amplitude of these sidebands have very less amplitude as compared to the line frequency.
2. Defects and load fluctuations of gearbox can be monitored through Motor Current Signature Analysis by 3. Tracking the amplitude level of the line frequency and the sideband of the output shaft frequency across line
frequency. Tracing the sideband frequency across the supply line frequency.
4. An expert system may well be advised for online condition monitoring of the gearbox using MCSA.
REFERENCES
[1] N. Bayder, A. Ball, A comparative study of acoustic and vibration signals in detection of gear failures usingWeigner–Ville distribution, Mechanical Systems and Signal Processing 15 (6) (2001) 1091– 1107.
[2] C.J. Stander, P.S. Hayns, W. Schoombe, Using vibration monitoring for local fault detection on gears operating under fluctuating load conditions, Mechanical Systems and Signal Processing 16 (6) (2002) 1006–1024.
[3] W. Wang, A.K. Wong, some new signal processing approaches for gear fault diagnosis, Fifth International Symposium m on Signal Processing and its Application, 1999, pp. 587–590.
[4] R.B. Randal, State of the art in monitoring rotor machinery, Proceeding of ISMA, vol -IV, 2002, pp. 1457– 1478.
[5] C.K. Sung, H.M. Tai, C.W. Chen, Locating defects of a gear system by the technique of wavelet transfer, Mechanism and Machine Theory 35 (2000) 1169– 1182.
[6] N. Bayder, A. Ball, Detection of gear failures via vibration and acoustics signals using wavelet transform, Mechanical Systems and Signal Processing 17 (4) (2003) 787–804.
[7] Z.K. Peng, F.L. Chu, Application of the wavelet transform in machine condition monitoring and fault Diagnostics: a review with bibliography, Mechanical Systems and Signal Processing 18 (2) (2004) 199–221.
[8] H.A. Gaborson, The use of wavelets for analyzing transient Machinery Vibration, Sound and Vibration (2002).
[9]M. Vetterli C. Herley, Wavelets and filter banks: theory and design, IEEE Transaction on Signal Processing 49(1992) 2207– 2232.
[10] J.R. Shadley, B.L. W ilson, M.S. Dorney, Unstable self-excitation of torsional vibration in AC induction motor driven rotational systems, Journal of Vibration and Acoustics, Transaction of ASME 114 (1992) 226–231.
[11] L. Ran, R. Yacamini, K.S. Smith, Torsional vibrations in electrical induction motor drives during start-up, Journal of Vibration and Acoustics, Transaction of ASME 118 (1996) 242–251.