DOI: 10.1534/genetics.109.112383
Impact of Initial Pathogen Density on Resistance
and Tolerance in a Polymorphic Disease Resistance
Gene System in
Arabidopsis thaliana
Fabrice Roux,
1Liping Gao and Joy Bergelson
2 Department of Ecology and Evolution, University of Chicago, Chicago, Illinois 60637Manuscript received November 24, 2009 Accepted for publication February 6, 2010
ABSTRACT
The evolution of natural enemy defense shapes evolutionary trajectories of natural populations. Although the intensity of selection imposed by enemies clearly varies among natural populations, little is known about the reaction norm of genotypes under a gradient of selective pressure. In this study, we measure the quantitative responses of disease symptoms and plant fitness to a gradient of infection, focusing on the gene-for-gene interaction between theRpm1resistance gene inArabidopsis thalianaand theAvrRpm1avirulence gene in the bacterial pathogenPseudomonas syringae. Two complementary sets of plant material were used: resistant (R) and susceptible (S) isogenic lines and a set of six natural accessions, three of which areRpm1
resistant (R) and three of which arerpm1susceptible (S). Nine initial pathogen densities were applied to each plant line. Using isogenic lines allows any differences betweenRandSlines to be attributed directly to theRpm1gene, whereas using natural accessions allows the natural variation of resistance and tolerance over a gradient of infection dosages withinRandSaccessions to be described. For both sets of plant material, increased infection dosage results in more extensive disease symptoms, with a subsequent decrease in seed production. The severity of disease symptoms was reduced inRrelative toSsubgroups, and the presence of theRpm1allele led to an increase in plant fitness. Tolerance, defined as the ability to sustain infection without a reduction in fitness, was directly affected byRpm1,providing a novel demonstration of anRgene affecting tolerance. Genetic variation for tolerance was also found within theSandRnatural accessions, suggesting the potential for selection to act upon this important trait.
E
VOLUTIONARY trajectories of species and com-munities of plants are affected by their interactions with natural enemies, and predicting their phenotypic responses is the aim of many theoretical and empirical studies (Rausher2001;deMeauxand Mitchell-Olds 2003; Barrett et al. 2009). Selection by natural ene-mies is thought to lead to either of two phenotypes: resistance, in which plants express traits that deter attack or decrease the performance of natural enemies (Straussand Agrawal1999; Koskelaet al.2002), or tolerance, in which plants express traits that reduce the negative effects of attack (Burdon1987).Early theoretical models of plant–pathogen interac-tions predict that resistance and tolerance should be mutually exclusive defense strategies, with a negative cor-relation between them (Fineblumand Rausher1995; Mauricio et al. 1997). More recent models, however,
suggest that both strategies can persist in natural pop-ulations (Bootsand Bowers1999; Royand Kirchner 2000; Tiffin 2000; Fornoni et al. 2004; Restif and Koella2004). Although these models result in diverse evolutionary outcomes, the costs and benefits of re-sistance and tolerance in the presence and absence of natural enemies are common inputs. Furthermore, in all models to date, resistance and tolerance are consid-ered genetically distinct traits that are capable of evolv-ing independently. Commensurate with the theories, substantial empirical efforts have been made to esti-mate the ratio of costs to benefits in plant–herbivore (Fineblumand Rausher1995; Mauricioand Rausher 1997; Lennartssonet al.1998; Mauricio1998; Tiffin and Rausher 1999; Fornoni and Nu´ n˜ ez-Farfa´ n 2000; Honkanen and Jormalainen 2005), plant– holoparasitic plant (Koskela et al. 2002; Puustinen et al. 2004) and plant–pathogen systems (Simms and Triplett1994; Peters 1999; Korvesand Bergelson 2003; Goss and Bergelson 2007; Kniskern and Rausher2006).
Almost without exception, these theoretical (but see Carlsson-Grane´ rand Thrall 2002) and empir-ical studies consider only a single level of attack. In nature, however, the intensity of selective pressure is
Supporting information is available online athttp://www.genetics.org/ cgi/content/full/genetics.109.112383/DC1.
1Present address:Laboratoire de Ge´ne´tique et Evolution des Populations
Ve´ge´tales, UMR CNRS 8016, Universite´ des Sciences et Technologies de Lille, Lille 1, F-59655 Villeneuve d’Ascq Cedex, France.
2Corresponding author:Department of Ecology and Evolution, University
of Chicago, 1101 E. 57th Street, Chicago, IL 60637. E-mail: [email protected]
heterogeneous among natural populations, and even among individuals within a population (Marquis1992; Gossand Bergelson2007; Dunning2008). Resistance and tolerance to pathogens should therefore be studied as a reaction norm of genotypes under a gradient of selective pressure.
Here we investigate the reaction norm of resistance and tolerance under a gradient of selective pressure, focusing on the gene-for-gene interaction between the Rpm1 resistance gene in Arabidopsis thaliana and theAvrRpm1avirulence gene inPseudomonas syringae. The Rpm1 resistance gene confers resistance to P. syringae carrying theAvrRpm1avirulence gene. We are specifically interested in (1) whether the benefit of resistance varies over 10 different initial pathogen densities and (2) whether the relationship between tolerance andRgene resistance inA. thalianavaries over the same selection gradient.
To address these issues, we considered two comple-mentary sets of plant lines. First, we used resistant (R) and susceptible (S) isogenic lines constructed in one naturally susceptible accession ofA. thaliana. Perform-ing experiments usPerform-ing these isogenic lines allows us to attribute any differences betweenRandSlines directly to the Rpm1 gene. Second, we utilized three natural accessions ofA. thalianathat areRpm1resistant (R) and another three natural accessions that are rpm1 suscep-tible (S). Performing experiments using natural acces-sions allows us to describe the natural variation of resistance and tolerance over a gradient of infection dosages withinRandSaccessions.
MATERIALS AND METHODS
Plant material: Our experiments considered two sets of plant material. First, three pairs of isogenic lines (T11/, T31/, T51/) were used; their construction has been fully described elsewhere (Tianet al.2003). TheseRandSisogenic lines share the same Bla-2 susceptible genetic background except for the presence or absence of a functionalRpm1gene. Each pair has an independent insertion site ofRpm1.
Second, we chose six natural accessions segregating for the
Rpm1insertion/deletion polymorphism. The threeR acces-sions (Col-0, Ler-1, and Shahdara) carry theRpm1resistance gene and the threeSaccessions (Cvi-0, Ga-0, and Yo-0) lack the
Rpm1resistance gene (Aranzanaet al.2005).
Pathogen strains:Our experiments utilized an engineered strain of P. syringaeDC3000 expressingAvrRpm1(DC3000T AvrRpm1; Tianet al.2003). In regard to the hypersensitive response (HR), a form of programmed plant cell death,
P. syringae DC3000 in its untransformed state is not recog-nized by any of the A. thaliana accessions considered; therefore, we could unambiguously isolate effects due to the gene-for-gene interaction between Rpm1 and AvrRpm1 in
P. syringae.
Greenhouse experiment: In the isogenic experiment (see
Plant materialabove), seeds were sown in 10 flats (25.5 cm3 25.5 cm) filled with a 1:1 mixture (v:v) of sterile C2 and Metro 200 potting soils. Each flat consisted of an 838 grid of plants, positioned 2.5 cm apart, with 10 plants for each of the six isogenic lines (T11/, T31/, T51/). To ensure
homoge-neous levels of competition among plants, the remaining four positions were filled with Bla-2 (the background used to create the transgenic lines), as were the edges of each flat (for a total of 36 additional positions at the same density). This density corresponds to natural densities that seeds may experience when they are dispersed far from the maternal plant (Wender et al.2005). In each flat, a fully crossed and randomized design was applied such that each of the 10 plants from an isogenic line received 1 of 10 different inoculation treatments (9 initial densities ofP. syringaeDC3000TAvrRpm1, ranging from 101to 109colony-forming units (CFUs), and one mock treatment).
Individual plants were randomly assigned to an inoculation treatment. The experiment included a total of 600 plants.
Thenaturalexperiment was conducted simultaneously in the same growth room and used the same methods except that the six natural accessions were used in place of the three pairs of isogenic lines. In addition, the remaining 36 positions within and around the grid were filled with Col-0 rather than Bla-2.
For both experiments, seeds were cold stratified (4°) for 3 days to optimize germination, and then flats were transferred to a growth room where plants were grown at 20°and with a 12-hr photoperiod. Flats were rotated every day or 2 to min-imize potential effects of uneven lighting across the growth room and were bottom watered twice a week without supple-mental nutrients. Plants were harvested once all individuals, excluding Yo-0 (which did not flower under our experimental conditions), had senesced.
To create initial densities of pathogens for inoculation, we serially dilutedP. syringaeDC3000TAvrRpm1 to obtain nine concentrations, ranging from 101CFU/ml to 109CFU/ml, in
increments of 101CFU/ml. Thirteen days after removing the
flats from the cold room (when most plants were approxi-mately 9 days old), the first two true leaves of each plant were filled in their entirety by pressing a blunt-end syringe into their bottom surfaces (Korvesand Bergelson2003). Mock treat-ment plants were inoculated with the buffer 10 mmMgSO
4.
After inoculation, plants were kept at nearly 90% humidity under plastic domes for 2 days to facilitate infection.
Measuring disease symptoms, fitness, and fitness-related quantitative traits:Disease symptoms (Symp5D) were scored visually 5 days after inoculation as described in Gao et al. (2009). These scores categorize the percentage of leaf area infected, as determined by the presence of visible chlorosis, water soaking, or cell death (Korvesand Bergelson2003). This results, on a per-plant basis, in a score between 0 (both inoculated leaves with no visible disease symptoms) and 6 (both with more than 66% infected area). Because disease symptoms are highly correlated with in-leaf bacterial titers (Koverand Schaal2002), we used this score as an indicator of bacterial fitness.
Plant fitness was measured as total silique length (TSL), which has been shown to be an accurate indicator of lifetime fitness for a selfing annual likeA. thalianabecause the length of a silique correlates strongly with the number of seeds contained within it (Rouxet al.2004). TSL was measured by counting the number of siliques produced on the primary shoot, the primary branches on the primary shoot, and the basal branches, and then multiplying these counts by an es-timate of their corresponding silique length (calculated as the average of three randomly chosen siliques).
p, where LENROS and WIDROS are the maximum length and width, respectively, of rosettes measured 7 days after inocula-tion with pathogens. Flowering time (FLO) was calculated as the number of days between transferring the flat to the growth room and observing the first open flower. Plants were censused for flowering on alternate days. Because Yo-0 plants did not flower under our experimental conditions, this accession was excluded from all the analyses.
Statistical analyses: For testing the quantitative effect of initial densities of pathogens on disease symptoms (Symp5D), fitness (TSL), and fitness-related traits (ROSSURF, FLO, HMAX, and HEADS), we used the following general linear models (GLMs):
1. For the isogenic experiment: traitmean1flat1pair1 resistance 1dose 1pair 3resistance 1 pair3 dose1 resistance3dose1pair3resistance3dose1error 2. For the natural experiment: trait mean 1 flat 1
accession(resistance)1resistance1dose1resistance3 dose1accession(resistance)3dose1error
In these models, ‘‘flat’’ accounts for differences in micro-environment among the 10 experimental blocks. ‘‘Pair’’ accounts for the position of the insertion event in the trans-genic lines. ‘‘Resistance’’ designates the presence or absence of theRpm1gene (i.e., R vs. S). ‘‘Dose’’ corresponds to the 10 inoculation treatments (9 initialP. syringaeDC3000TAvrRpm1 densities 1 one mock treatment). ‘‘Accession’’ nested in resistance measures the effect of genetic background within resistance classes for the natural accessions. All factors, except for flat, were treated as fixed effects because levels of no factor were random samples from a population to which we intended to extrapolate. For inferring tolerance, we tested the quanti-tative effects of symptoms on fitness-related traits using a GLM model as described above, but replacing the dose factor with a Symp5D factor.
All the statistical tests were performed on the raw data, as well as on data standardized by the performance of mock plants of the same lines. Both raw and standardized fitness-related traits were log transformed to satisfy the normality and equal variance assumptions of linear regression. Model fitting was conducted using Proc GLM in SAS 9.1 (SAS Institute Inc., Cary, NC), and the ‘‘estimate’’ or ‘‘contrast’’ statement were used for subsequent pairwise comparisons to examine the significance of particular effects. Because statistical analyses using raw and standard normal data led to the same biological conclusions, only the results using the raw data (log trans-formed) are presented.
RESULTS
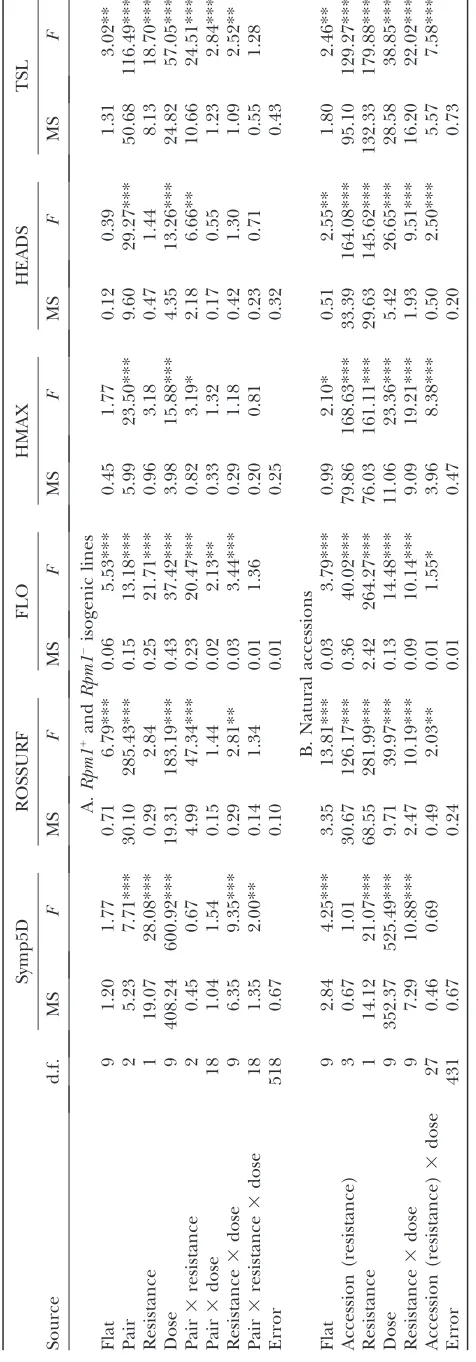
Quantitative effects of different initial inoculation densities on disease symptoms:Results from the GLMs for disease symptoms are reported in Table 1 for the isogenic (A) and natural (B) experiments. Factors af-fecting disease symptoms were generally consistent across experiments: S plants had significantly more disease symptoms than R plants, and both S and R plants showed significantly more severe disease symp-toms with an increase in the 10 initial inoculation densities (Figure 1, A and B). There was no evidence of disease symptoms under the mock treatment (Figure 1, A and B).
We observed a significant interaction between dose and resistance in both experiments. In the isogenic
experiment, S plants had significantly greater disease symptoms thanRplants had for intermediate inocula-tion densities (Figure 1; 104CFU/ml,F¼16.96,P,103;
105CFU/ml,F¼71.54,P,103; 106CFU/ml,F¼22.72,
P,103). Similarly, in the natural experiment,Splants
had significantly more disease symptoms thanRplants had for inoculation densities of 105 and 106 CFU/ml
(Figure 2; 105CFU/ml,F¼74.12,P,103; 106CFU/ml,
F¼43.63,P,103).
A significant effect of pair in the isogenic experiment revealed variation among the three isogenic pairs of Bla-2 lines in the benefit of expression Rpm1 when infected withP. syringaeDC3000TAvrRpm1. This result confirms the presence of position effects associated with transgenic insertion events. The lack of a significant effect of accession in the natural experiment suggests limited genetic variation among R or among S plants for symptoms 5 days after infection.
Quantitative effects of initial inoculation densities on fitness and fitness-related traits: Results from the GLMs for fitness-related traits are reported in Table 1 for the isogenic(A) andnatural(B) experiments. For both experiments, and in bothR andSplants, we observed a decrease in fitness (TSL) with an increase in the 10 inoculation densities (Figure 2, A and B). There was a corresponding increase in flowering time (FLO), and decrease in rosette surface area (ROSSURF), height (HMAX), and number of flowering heads (HEADS), as inoculation densities increased (Table 1).
In theisogenicexperiment,Splants had later flowering times (FLO) and produced fewer seeds (as measured by TSL) than R plants when infected with P. syringae DC3000TAvrRpm1. In contrast, detectable effects of Rpm1 resistance were more widespread in the natural experiment. Here,Splants have a smaller rosette surface area 7 days after inoculation with pathogens, flowered later, attained a reduced height, and produced fewer branches and fewer seeds thanRplants. Indeed, Cvi-0S plants produced almost no seeds when infiltrated with an inoculation density above 106CFU/ml.
Just as the main effect ofRpm1was evident for more plant traits in the natural experiment, so was the in-teraction between dose and resistance. In the isogenic experiment, the interaction was detected only for the traits ROSSURF, FLO, and TSL. In the natural experi-ment, however, a significant interaction was detected for all fitness-related traits, indicating that the benefit of resistance depends on the initial inoculation density used in this study. There were additionally slight differ-ences between the experiments in the range of in-oculation densities leading to significant fitness effects. In the isogenic experiment, R plants had significantly higher fitness (TSL) than S plants for intermediate inoculation densities (Figure 2A; 104CFU/ml,F¼5.23,
P¼0.0225; 105CFU/ml,F¼16.03,P,103; 106CFU/ml,
F¼7.99,P¼0.0049; 107CFU/ml,F¼11.18,P,103).
higher TSL than S plants at the highest inoculation densities CFU per milliliter (Figure 2B; 105CFU/ml,F¼
16.19,P, 103; 106CFU/ml,F¼87.24,P ,103; 107
CFU/ml,F¼97.35,P,103; 108CFU/ml,F¼96.20,P,
103; 109CFU/ml,F¼82.50,P,103). If we define the
benefit ofRgene resistance as the proportional fitness increase of R plants relative toS plants [i.e., (TSLR
TSLS)/TSLS] for a particular level of infection, estimates
of theRpm1benefits range from 46.7 to 77.2% across the 10 inoculation densities in the isogenic lines. In the natural accessions, estimates of the benefit of resistance (plus any other differences between theRandSgroups) range from 42.8 to 153.6% across the 10 inoculation densities.
We observed a significant effect of accession nested in resistance for all fitness-related traits in thenatural experiment suggesting genetic variation within the S and/orR subgroups in their response to infection by P. syringaeDC3000TAvrRpm1. For example, within the Ssubgroup, Ga-0S plants have higher TSL than Cvi-0 S plants (F ¼ 378.61, P , 103). Furthermore, a
sig-nificant interaction between accession nested in
re-sistance and dose was detected for all fitness-related traits, indicating the presence of genetic variation for the reaction norms of fitness traits across the 10 ex-perimental initial inoculation densities.
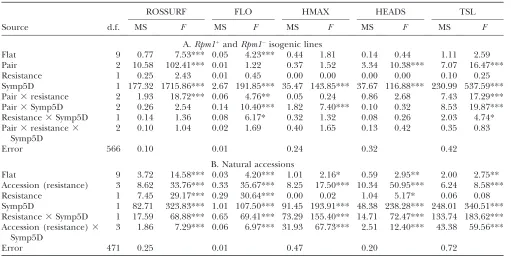
Resistance–tolerance relationship: Tolerance is typi-cally defined as the ability of the plant to maintain fitness in the face of disease symptoms (Burdon1987; Simms and Triplett 1994). We accordingly used the effect of disease symptoms (Symp5D) on fitness (TSL) as a measure of tolerance in our experiment; results are reported in Table 2 for the isogenic (A) and natural (B) experiments. In the isogenic experiment, in both R andSplants, increased symptoms were associated with smaller rosette sizes 7 days after inoculation with pathogens, delayed flowering, reduced height, fewer branches, and lower fitness (Figure 3, A and B). These results are supported by similar responses observed in the natural experiment.
A significant interaction between resistance and Symp5D was detected in the isogenic experiment for fitness (TSL) and flowering time (FLO), withR acces-sions producing more seeds at the highest symptom level than S accessions (Figure 3A). In other words,S Figure1.—Effect ofRpm1resistance on disease symptoms
5 days after infection (Symp5D) under nine different initial inoculation densities. (A) Isogenic lines; (B) natural acces-sions. Mean and SEM for Symp5D were plotted by initial in-oculation densities. Planned comparisons were made for R vs. S for each infection dosage: (*) 0.05. P . 0.01. (**) 0.01.P.0.001. (***)P,0.001. No asterisk means not sig-nificant.
plants suffered a stronger decline in fitness for a given increase in symptoms and are thus less tolerant thanR plants. Because the only difference between theRpm11 andRpm1lines is the presence of
Rpm1resistance, this result suggests thatRpm1resistance plays a role in the expression of tolerance inA. thaliana, at least in the Bla-2 genetic background. We observed a highly significant interaction between resistance and Symp5D for all fitness-related traits in the natural experiment, with R accessions producing more seeds at high symptom levels thanSaccessions produce (Figure 3B).
A significant interaction between accession nested in resistance and Symp5D was detected for all fitness-related traits, indicating the presence of genetic varia-tion for tolerance withinSandRnatural accessions. For example, within theSsubgroup, Ga-0 always has higher fitness than Cvi-0, but the gap between accessions (i.e., tolerance effect) decreases with an increase in symptom scores (Figure 4).
DISCUSSION
Isogenic lines vs. natural accessions: Isogenic lines are undoubtedly the gold standard for directly measur-ing the effect of an R allele on fitness (Korves and Bergelson 2003; Tian et al. 2003; Gao et al. 2009). Nevertheless R alleles in a broader range of genetic backgrounds more closely reflect the situation in natural populations. A particular concern with using natural
accessions ofA. thaliana would be ifRaccessions were more likely to come from populations in which patho-gens are present and thus more likely to have experi-enced selection for a variety of resistance-related traits. Under this assumption, any differences in overall re-sistance betweenRandSaccessions cannot be ascribed to the effect of theRpm1gene, but rather to the com-bined effect of all genes affecting resistance. Although we cannot rule out the possibility that theRpm1locus in ourRaccessions is linked to other genes for resistance, no local linkage disequilibrium has been detected be-tween Rpm1 and the nearest neighboring genes (see supporting information, Figure S1), nor has evidence been found for a positive matching between Rpm1 in-sertion/deletion polymorphisms and inin-sertion/deletion polymorphisms in either otherRgene (Aranzanaet al. 2005; Shenet al.2006) or in cofactors necessary for the elicitation of a hypersensitive response likeRIN4(Tian et al. 2003). Furthermore, Rpm1 exists at intermediate frequency with most local populations containing bothR and S individuals (Stahl et al. 1999; J. Bergelson, unpublished data). Finally, because the presence of pathogens in natural populations might also select for tolerance (Roy and Kirchner 2000), tolerant rather than resistant accessions may be selected in populations in which pathogens are present.
Quantitative effects of infection on fitness in a gene-for-gene system:In the isogenic experiment, the observed developmental responses to the 10 initial pathogen
TABLE 2
Effects of disease symptoms on plant fitness-related traits in isogenic Bla-2 lines (A) and natural accessions (B)
ROSSURF FLO HMAX HEADS TSL
Source d.f. MS F MS F MS F MS F MS F
A.Rpm11
andRpm1isogenic lines
Flat 9 0.77 7.53*** 0.05 4.23*** 0.44 1.81 0.14 0.44 1.11 2.59
Pair 2 10.58 102.41*** 0.01 1.22 0.37 1.52 3.34 10.38*** 7.07 16.47***
Resistance 1 0.25 2.43 0.01 0.45 0.00 0.00 0.00 0.00 0.10 0.25
Symp5D 1 177.32 1715.86*** 2.67 191.85*** 35.47 143.85*** 37.67 116.88*** 230.99 537.59*** Pair3resistance 2 1.93 18.72*** 0.06 4.76** 0.05 0.24 0.86 2.68 7.43 17.29*** Pair3Symp5D 2 0.26 2.54 0.14 10.40*** 1.82 7.40*** 0.10 0.32 8.53 19.87*** Resistance3Symp5D 1 0.14 1.36 0.08 6.17* 0.32 1.32 0.08 0.26 2.03 4.74* Pair3resistance3
Symp5D
2 0.10 1.04 0.02 1.69 0.40 1.65 0.13 0.42 0.35 0.83
Error 566 0.10 0.01 0.24 0.32 0.42
B. Natural accessions
Flat 9 3.72 14.58*** 0.03 4.20*** 1.01 2.16* 0.59 2.95** 2.00 2.75**
Accession (resistance) 3 8.62 33.76*** 0.33 35.67*** 8.25 17.50*** 10.34 50.95*** 6.24 8.58*** Resistance 1 7.45 29.17*** 0.29 30.64*** 0.00 0.02 1.04 5.17* 0.06 0.08 Symp5D 1 82.71 323.83*** 1.01 107.50*** 91.45 193.91*** 48.38 238.28*** 248.01 340.51*** Resistance3Symp5D 1 17.59 68.88*** 0.65 69.41*** 73.29 155.40*** 14.71 72.47*** 133.74 183.62*** Accession (resistance)3
Symp5D
3 1.86 7.29*** 0.06 6.97*** 31.93 67.73*** 2.51 12.40*** 43.38 59.56***
Error 471 0.25 0.01 0.47 0.20 0.72
densities used in this study were consistent betweenRand S plants. An increase in initial inoculation density of pathogen resulted in delayed flowering time and reduced rosette surface area, branching, height, and seed pro-duction. The reaction norms across the 10 initial in-oculation densities were significantly different betweenR andSplants for most quantitative traits measured. Similar responses were observed in the natural experiment.
In both isogenic lines and natural accessions, a fitness benefit of theRpm1allele was detected for several spe-cific infection dosages, even when there was no dif-ference in disease symptoms between R and S plants (107 CFU/ml for isogenic lines, and 107 CFU/ml
109 CFU/ml for natural accessions). There are two
possible explanations for this fitness benefit of theRpm1 allele in the absence of differences in disease symptoms. First, Symp5D may be an inadequate estimate of damage in our study. This first explanation is unlikely because disease symptoms are known to be correlated to bac-terial titers in theA. thaliana–P. syringaesystem (Korves and Bergelson2003) and becauseP. syringaebacterial growth reaches a plateau of abundance between 3 and 4 days after infiltration ( Jakob et al. 2002). Further-more, in an independent experiment, Gaoet al.(2009)
observed a fitness benefit of the Rps5 allele at an inoculation density of 107 CFU/ml but no difference
in symptoms betweenRandSplants. A second possibil-ity is that Rpm1 triggers pathways that affect resource allocation whenA. thalianais infected at doses above 107
CFU/ml. Indeed, a higher growth rate was observed for infected R lines, and this accelerated growth did not result from a higher initial rosette size (data not shown). In isogenic lines, the fitness benefit of theRpm1allele ranged from 46 to 77%, depending on the initial inoculation dosage of the pathogen. In a similar study focusing onRps5, Gaoet al.(2009) found fitness benefits of the Rps5allele of only 9.6–32%. This difference in benefits may result from the use of isogenic lines with different genetic backgrounds (Bla-2 for theRpm1allele and Col-0 or Ga-0 for theRps5allele). However, the result may also indicate that the fitness benefits differ among diverse R genes. Further empirical investigations are needed to confirm and dissect this observation and to explore how these costs/benefits combine with variation in inoculation density to affect the dynamics ofRgene alleles in nature.
Resistance–tolerance relationship: In the isogenic experiment, no fitness trade-off was observed between R gene resistance and tolerance. Instead, R plants were found to be more tolerant thanSplants suggesting that theRpm1gene itself affects tolerance, providing the first demonstration of anRgene impact on tolerance. This result supports theoretical models on selection favoring both tolerance and resistance in natural pop-ulations (Bootsand Bowers1999; Royand Kirchner 2000; Tiffin 2000; Fornoni et al. 2004; Restif and Koella2004). To date, few studies have reported the genetic architecture of both resistance and tolerance to enemy attack inA. thaliana(Weiniget al.2003; Kover and Cheverud2007). Here, the Rpm1gene was dem-onstrated to be a common QTL for both resistance and tolerance. A common genetic basis for both resistance Figure3.—Effect of disease symptoms 5 days after
infec-tion (Symp5D) on plant fitness, measured as total silique length (TSL). (A) Isogenic lines; (B) natural accessions. Mean and SEM for TSL were plotted by symptom levels.
and tolerance contrasts with theoretical models that all assume that resistance and tolerance are genetically distinct traits. Interestingly, in a similar study varying in the presence or absence ofRps5, no relationship was detected betweenRps5and tolerance (Gaoet al.2009), indicating that the role ofRgenes in tolerance might differ among diverseRgenes.
Besides the direct effect ofRpm1on tolerance, we also detected natural variation for tolerance within theSand the R subgroups of natural accessions. Variation in tolerance within each subgroup might result from either polymorphism in quantitative resistance genes other than the qualitativeRpm1gene, many of which are up-regulated upon infection (Taoet al.2003), or hetero-scedasticity of titers across multiple symptom levels as previously detected among 19A. thaliananatural acces-sions (Koverand Schaal2002). Within theSsubgroup, the relatively high tolerance of Ga-0 may represent an al-ternative defense strategy for coping with pathogens car-rying theAvrRpm1avirulence gene (Royand Kirchner 2000). In contrast, the absence of tolerance in the Cvi-0Sline may suggest the absence of these pathogens on Cape Verdi Island, where this accession was collected. Similarly, the presence of natural variation for tolerance within theRsubgroup could result from differences in the incidence and prevalence of pathogens species among populations. SinceR plants experienced a de-crease in fitness when initial experimental inoculation densities of pathogens were sufficiently high, we may expect natural selection to favor both resistance genes and tolerance genes whenever pathogen attack de-creases fitness inRplants.
Because the distribution of initial pathogen densities would affect the selection differential for overall fitness within and betweenRandSaccessions, spatial hetero-geneity of initial pathogen densities at different scales (among populations and within populations) need to be assessed by sampling pathogens across the natural range of A. thaliana. Developing quantitative genetic models (with genes having an effect on resistance and/ or tolerance) at the metapopulation level would cer-tainly help in understanding the dynamics and out-comes of interactions between plants and their natural enemies in an evolutionary context.
We are grateful to the staff of the University of Chicago greenhouse for their assistance during the experiment and to Elizabeth B. Haney for contributions to writing and editing this manuscript. Support was provided by National Institutes of Health grants GM57994 and GM62504 to J.B. and a V. Dropkin Foundation Fellowship to F.R.
LITERATURE CITED
Aranzana, M. J., S. Kim, K. Zhao, E. Bakker, M. Horton et al.,
2005 Genome-wide association mapping in Arabidopsis identi-fies previously known genes flowering time and pathogen resis-tance genes. PLoS Genet1:531–539.
Barrett, L. G., J. M. Kniskern, N. Bodenhausen, W. Zhangand J.
Bergelson, 2009 Continua of specificity and virulence in plant
host-pathogen interactions: causes and consequences. New Phy-tol.183:513–529.
Boots, M., and R. G. Bowers, 1999 Three mechanisms of host
re-sistance to microparasites—avoidance, recovery and tolerance— show different evolutionary dynamics. J. Theor. Biol.201:13–23. Burdon, J. J., 1987 Diseases and Plant Population Biology.Cambridge
University Press, Cambridge, MA.
Carlsson-Grane´ r, U., and P. H. Thrall, 2002 The spatial
distribu-tion of plant populadistribu-tions, disease dynamics and evoludistribu-tion of re-sistance. Oikos97:97–110.
deMeaux, J., and T. Mitchell-Olds, 2003 Evolution of plant
resis-tance at the molecular level: ecological context of species inter-actions. Heredity91:345–352.
Dunning, M., 2008 Host genotype and populations structure in the
interaction betweenArabidopsis thalianaand its natural bacterial pathogens. Ph.D. Thesis, University of Chicago.
Fineblum, W. L., and M. D. Rausher, 1995 Tradeoff between
resis-tance and tolerance to herbivore damage in a morning glory. Nature377:517–520.
Fornoni, J., and J. Nu´ n˜ ez-Farfa´ n, 2000 Evolutionary ecology of
Datura stramonium: genetic variation and costs for tolerance to defoliation. Evolution54:789–797.
Fornoni, J., J. Nu´ n˜ ez-Farfa´ n, P. L. Valverdeand M. D. Rausher,
2004 Evolution of mixed strategies of plant defense allocation against natural enemies. Evolution58:1685–1695.
Gao, L., F. Rouxand J. Bergelson, 2009 Quantitative effects of
in-fection in a gene-for-gene system. New Phytol.184:485–494. Goss, E. M., and J. Bergelson, 2007 Fitness consequences of
path-ogen infection ofArabidopsis thalianawith its natural bacterial pathogenPseudomonas viridiflava.Oecologia152:71–81. Honkanen, T., and V. Jormalainen, 2005 Genotypic variation in
tolerance and resistance to fouling in the brown algaFucus vesi-culosus.Oecologia144:196–205.
Jakob, K., E. M. Goss, H. Araki, T. Van, M. Kreitman et al.,
2002 Pseudomonas viridiflavaandP. syringae—natural pathogens ofArabidopsis thaliana.Mol. Plant Microbe In.15:1195–1203. Kniskern, J. M., and M. D. Rausher, 2006 Environmental variation
mediates the deleterious effects ofColeosporium ipomoeaeon Ipo-moea purpurea.Ecology87:675–685.
Korves, T. M., and J. Bergelson, 2003 A developmental response to
pathogen infection in Arabidopsis. Plant Physiol.133:339–347. Koskela, T., S. Puustinen, V. Salonen and P. Mutikainen,
2002 Resistance and tolerance in a host plant-holoparasitic plant interaction: genetic variation and costs. Evolution56:899–908. Kover, P. X., and J. Cheverud, 2007 The genetic basis of
quantita-tive variation in susceptibility ofArabidopsis thalianato Pseudomo-nas syringae(PstDC3000): evidence for a new genetic factor of large effect. New Phytol.174:172–181.
Kover, P. X., and B. A. Schaal, 2002 Genetic variation for disease
resistance and tolerance amongArabidopsis thalianaaccessions. Proc. Natl. Acad. Sci. USA99:11270–11274.
Lennartsson, T., P. Nilssonand J. Tuomi, 1998 Induction of
over-compensation in the field gentian,Gentianella campestris.Ecology
79:1061–1072.
Marquis, R., 1992 Selective impact of herbivores, pp. 301–325 inPlant
Resistance to Herbivores: Ecology, Evolution and Genetics,edited by R. S. Fritzand E. L. Simms. University of Chicago Press, Chicago.
Mauricio, R., 1998 Costs of resistance to natural enemies in field
populations of the annual plantArabidopsis thaliana. Am. Nat.
151:20–28.
Mauricio, R., and M. D. Rausher, 1997 Experimental
manipula-tion of putative selective agents provides evidence for the role of natural enemies in the evolution of plant defense. Evolution
51:1435–1444.
Mauricio, R., M. D. Rausherand D. S. Burdick, 1997 Variation in
the defense strategies of plants: Are resistance and tolerance mu-tually exclusive? Ecology78:1301–1311.
Peters, A. D., 1999 The effects of pathogen infection and mutation
on life-history characters inArabidopsis thaliana.J. Evol. Biol.12:
460–470.
Puustinen, S., T. Koskelaand P. Mutikainen, 2004 Direct and
eco-logical costs of resistance and tolerance in the stinging nettle. Oe-cologia139:76–82.
Rausher, M. D., 2001 Co-evolution and plant resistance to natural
Reboud, X., V. LeCorre, N. Scarcelli, F. Roux, J. L. Davidet al.,
2004 Natural variation among accessions ofArabidopsis thaliana: Beyond the flowering date, what morphological traits are rele-vant to study adaptation?, pp. 135–142 inPlant Adaptation: Molec-ular Biology and Ecology, edited by Q. C. Cronk, J. Whittonand
I. E. P. Taylor. NRC Research Press, Ottawa, Canada.
Restif, O., and J. C. Koella, 2004 Concurrent evolution of
resis-tance and tolerance to pathogens. Am. Nat.164:E90–E102. Roux, F., J. Gasquezand X. Reboud, 2004 The dominance of the
herbicide resistance cost in severalArabidopsis thalianamutant lines. Genetics166:449–460.
Roy, B.A., and J. W. Kirchner, 2000 Evolutionary dynamics of
path-ogen resistance and tolerance. Evolution54:51–63.
Shen, J., H. Araki, L. Chen, J.-Q. Chenand D. Tian, 2006 Unique
evolutionary mechanism in R-genes under the presence/absence polymorphism inArabidopsis thaliana.Genetics172:1243–1250. Simms, E. L., and J. J. Triplett, 1994 Costs and benefits of plant
re-sponses to disease: resistance and tolerance. Evolution48:1973–1985. Stahl, E. A., G. Dwyer, R. Mauricio, M. Kreitmanand J. Bergelson,
1999 Dynamics of disease resistance polymorphism at theRpm1 locus ofArabidopsis.Nature400:667–671.
Strauss, S. Y., and A. A. Agrawal, 1999 The ecology and evolution of
plant tolerance to herbivory. Trends Ecol. Evol.14:179–185. Tao, Y., Z. Xie, W. Chen, J. Glazebrook, H. S. Chang et al.,
2003 Quantitative nature of Arabidopsis responses during
com-patible and incomcom-patible interactions with the bacterial patho-genPseudomonas syringae.Plant Cell15:317–330.
Tian, D., M. B. Traw, J. Q. Chen, M. Kreitmanand J. Bergelson,
2003 Fitness costs of R-gene-mediated resistance inArabidopsis thaliana.Nature423:74–77.
Tiffin, P., 2000 Are tolerance, avoidance, and antibiosis
evolution-arily and ecologically equivalent responses of plants to herbi-vores? Am. Nat.155:128–138.
Tiffin, P., and M. D. Rausher, 1999 Genetic constraints and
selec-tion acting on tolerance to herbivory in the common morning gloryIpomea purpurea.Am. Nat.154:700–716.
Weinig, C., J. R. Stinchcombeand J. Schmitt, 2003 Evolutionary
genetics of resistance and tolerance to natural herbivory in Ara-bidopsis thaliana.Evolution57:1270–1280.
Weinig, C., J. Johnston, Z. M. German and L. M. Demink,
2006 Local and global costs of adaptive plasticity to density inArabidopsis thaliana.Am. Nat.167:826–836.
Wender, N. J., C. R. Polisetty and K. Donohue, 2005
Density-dependent processes influencing the evolutionary dynamics of dispersal: a functional analysis of seed dispersal in Arabidopsis thaliana(Brassicaceae). Am. J. Bot.92:960–971.
Supporting Information
http://www.genetics.org/cgi/content/full/genetics.109.112383/DC1
Impact of Initial Pathogen Density on Resistance and Tolerance
in a Polymorphic Disease Resistance Gene
System
in
Arabidopsis thaliana
Fabrice Roux
1, Liping Gao and Joy Bergelson
F. Roux et al.
2 SI
Disequilibrium around the Rpm1 resistance gene
Possible local linkage disequilibrium between the Rpm1 locus and the neighboring genes was measured by estimating the r²
statistic among 67 SNP markers genotyped for 179 natural worldwide accessions and located within a 20Kb region around
the Rpm1 locus (GGT 2.0 software; VAN BERLOO 2008). The SNP genotyping data has been fully described elsewhere
(ATWELL et al. 2010). As illustrated in Figure S1, no strong linkage has been detected between Rpm1 and the neighboring
genes.
FIGURE S1.—Heatplot of Linkage Disequilibrium around Rpm1. Arrows indicates the SNP markers located within the
Rpm1 gene and the nearest neighboring genes AT3G07030 and AT3G07050. The r² estimate increases with the brightness of the red color.
ATWELL, S., Y. S. HUANG, B. J. VILHJALMSSON, G. WILLEMS, M. HORTON et al., 2010 Genome-wide association study of 107 phenotypes in a common set of Arabidopsis thaliana inbred lines. Nature (in press).