ISSN(Online): 2319-8753 ISSN (Print): 2347-6710
International Journal of Innovative Research in Science,
Engineering and Technology
(An ISO 3297: 2007 Certified Organization)
Website: www.ijirset.com
Vol. 6, Issue 6, June 2017
Parametric Study of Hydrogen and Oxygen
(Generated Through Alkaline Electrolysis Method)
Addition as a Mixture on Performance
Characteristics of a Diesel Engine
Debjit Ghosh1, Shravan Kotapalli1, Ronak Shah1, Dhruv Patel1*, Ath Singhal2, Absar Lakhdawala2
UG Student, Department of Mechanical Engineering, Institute of Technology, Nirma University, Ahmedabad, India1
Assistant Professor, Department of Mechanical Engineering, Institute of Technology, Nirma University,
Ahmedabad, India2
ABSTRACT: Looking to the crisis for fuel, the need for an alternate fuel which can work effectively in IC Engines has been a topic of research since long. One such fuel that has capability to reduce the dependence on petroleum based fuel is Hydrogen. Enormous research has been done to use hydrogen as fuel IC Engine with different methods.
Current work involves fabrication of a lab scale electrolyser to produce hydrogen and oxygen using alkaline electrolysis. The mixture of hydrogen and oxygen gas is inserted in the intake manifold of a diesel-engine along with diesel fuel. Parametric study has been done to find out the change in performance characteristics of diesel engine.
KEYWORDS: Hydrogen fuel, Alkaline Electrolysis, Internal Combustion Engine.
I. INTRODUCTION
Search for alternative fuels for Internal Combustion engines apart from petroleum synthesized fuel is not new. Due to very limited petroleum resources, demand for carbonless society, increasing cost of existing fuels, need for diluting dependence on crude products etc., the alternative fuel research is an issue that has drawn attention of the entire world towards it. Hydrogen is one such fuel that has the capability to reduce the dependence of diesel and gasoline for IC
Engines. Hydrogen (H2) is widely used as the fuel for combustion over a wide range of industries, including the
aerospace field, due to its high energy density in mass basis, high flame speed, and wide flammability range [1,2]. Hydrogen's unique combustion properties may improve thermal efficiency and emission levels in ICEs, and may be
useful for fuel saving. The diffusion coefficient of hydrogen (0.61 cm2/s) is larger than gasoline (0.16 cm2/s), for that
reason, it improves the homogeneity of combustible mixture. The adiabatic flame speed of hydrogen (237 cm/s) is five times as large as that of gasoline (42 cm/s) and therefore it may improve thermal efficiency [3]. It is also suitable for
diesel fueled engines. Hydrogen offers many advantages as an alternative energy carrier, one of which is the energy
content of hydrogen (118 MJ kg–1 at 298 K), which is much higher than that of most. Furthermore, the use of hydrogen
can moderate the issues associated with the use of fossil fuels: CO2 and other greenhouse gases [4]. Some of the
properties of Hydrogen are listed in Table 1. [5]
IC Engines has superior capability to be able to use hydrogen derived from various procedures such as water electrolysis, steam reforming, and dehydrogenation of organic chemical hydrides. [6,2]
ISSN(Online): 2319-8753 ISSN (Print): 2347-6710
International Journal of Innovative Research in Science,
Engineering and Technology
(An ISO 3297: 2007 Certified Organization)
Website: www.ijirset.com
Vol. 6, Issue 6, June 2017
Property Hydrogen
Molecular weight (g/mol) 2.016
Density (kg/m3) 0.08
Mass diffusivity in air (cm2/s) 0.61
Flammability limits in air (vol%) 4–75
Flammability limits (λ) 10–0.14
Flammability limits (φ) 0.1–7.1
Lower heating value (MJ/kg) 120
Higher heating value (MJ/kg) 142
Stoichiometric air-to-fuel ratio (kg/kg) 34.2
Molecular weight (g/mol) 2.016
Density (kg/m3) 0.08
Table 1 : Hydrogen properties at 300K and 1 atm.
Hydrogen can be extracted from various methods viz : thermal, electrolytic, and photolytic processes from fossil fuels, biomass, and water.[4,3] Water is considered a long-term source for the production of hydrogen due to its wide availability. Hydrogen can be produced from water by various methods, including water splitting and electrolysis. Water splitting can be carried out by a thermo chemical process, chemical conversion of biomass, and photo catalytic water splitting. In water splitting, the water is disassociates into hydrogen and oxygen by a series of consecutive chemical reactions. Water electrolysis is a well-developed technology for the conversion of water into hydrogen and oxygen at low temperatures. Electrolysis can be distinguished according to the type of electrolyte used in the electrolyzer. The two main water electrolysis technologies to produce hydrogen are alkaline electrolysis and proton exchange membrane (PEM) electrolysis [4].
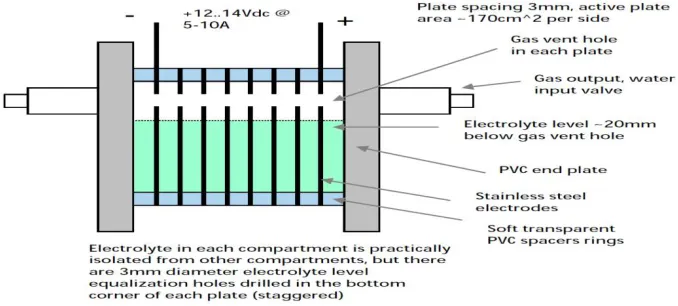
II. ELECTROLYSERDESIGN
Fig. 1. Schematic diagram of electrolyser fabricated for testing
ISSN(Online): 2319-8753 ISSN (Print): 2347-6710
International Journal of Innovative Research in Science,
Engineering and Technology
(An ISO 3297: 2007 Certified Organization)
Website: www.ijirset.com
Vol. 6, Issue 6, June 2017
from the electrolyser through PVC pipes that would be extended through pipes that would lead the gas to the inlet port of the engine. The water level would be maintained by sending water through another supply pipe having many hole in them.
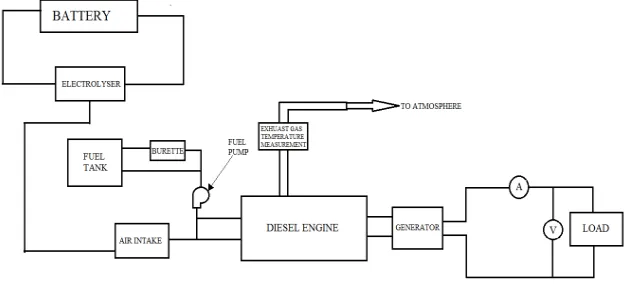
III. EXPERIMENTAL SETUP AND EXPERIMENTATION
A. Experimental Setup
A single cylinder diesel engine developed by Markon, generating 5.5 kW at 1500 rpm, coupled with a generator to generate electricity, is used for the experiment. A load bank is connected to the generator output to obtain different loads. Light bulbs of 200 watt are used as loads. A standard Voltmeter and Ammeter are used to measure the voltage across the loads and current in the circuit which gave the power rating of the engine (V x I) after considering the efficiency of generator which is 90.0% given by the manufacturer. The fuel flow rate is measured on a volumetric basis using burette and stopwatch. The relative humidity is measured using hygrometer.
B. Experimentation
Firstly the electrolyser unit was connected across a 24 volt battery setup and the connection was switched on and the engine was cranked. The engine was made to reach a steady running condition before putting the hydrogen outlet to the inlet manifold of the engine. The speed of the engine was measured using a TACHOMETER. The time required for the consumption of 5 ml of fuel was recorded at the intervals of every 10 minutes. The output power was measured by recording the readings of a VOLTMETER and an AMMETER connected across the generator unit. The above procedure was carried out for the loading conditions of 0%, 20% and 40%.
Fig. 2. Schematic diagram of test setup
C. Standardization of properties
As per Indian Standard IS: 10000 (Part IV) - 1980, which lays down the guidelines for declaring power, efficiency and fuel consumption and specifies relevant correction factors, break power and specific fuel consumption declared. The standard reference conditions as per IS 10000 (Part II) 1980 are mentioned below:
Reference pressure Pr = 100 kPa
Reference temperature Tr = 300 K
ISSN(Online): 2319-8753 ISSN (Print): 2347-6710
International Journal of Innovative Research in Science,
Engineering and Technology
(An ISO 3297: 2007 Certified Organization)
Website: www.ijirset.com
Vol. 6, Issue 6, June 2017
IV. RESULTS AND DISCUSSION
The experiment with only diesel as fuel and duel fuel of diesel and hydrogen gas has been done as per the procedure explained in the previous chapter. The Performance characteristics were studied at different loads on the engine at fixed RPM at regular intervals of time. The results obtained, at 95% confidence level, and the discussion has been presented in this chapter.
The engine was run for a period of 6.5 hours, during which the values of exhaust temperature, engine RPM, fuel consumption, output of generator in form of voltage and ampere, relative humidity and the room temperature are noted at every 15 minutes. The data collected is analyzed statistically by Chauvenet’s criterion and Student’s t chart method. From the data obtained following plots are plotted:
Brake Power v/s Percentage Load
Brake Specific Fuel Consumption v/s Percentage Load
Thermal Efficiency v/s Percentage Load
Willian’s Line (Fuel Consumption v/s Brake Power)
Mechanical Efficiency v/s Percentage Load
A. BRAKE POWER:
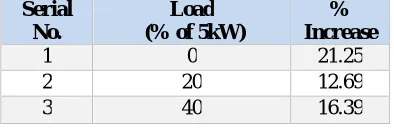
The brake power was calculated at each load by the readings observed on the voltmeter and ammeter connected to the A.C. generator. The figure 3 shows the brake power values for 0%, 20% and 40% load at fixed intervals of time for only diesel fuel and duel fuel of diesel and hydrogen gas. It can be observed from the figure that there is a considerable increase in the brake power. The average increase in at different loads is as follows:
Serial No.
Load (% of 5kW)
% Increase
1 0 21.25
2 20 12.69
3 40 16.39
Table 2: Table of Percentage increase in Brake Power at various loads
The increase in brake power while using duel fuel of diesel and hydrogen can be attributed to the higher calorific value of the hydrogen fuel resulting into a greater output from the engine.
Figure 3: Graph of Brake Power V/S Percentage Load
The increase in brake power has been obtained at 95% confidence level, thereby making the increase quite significant. 0
0.5 1 1.5 2 2.5 3
0 20 40
B
R
A
KE
P
O
W
ER
(KW
)
Only Diesel
ISSN(Online): 2319-8753 ISSN (Print): 2347-6710
International Journal of Innovative Research in Science,
Engineering and Technology
(An ISO 3297: 2007 Certified Organization)
Website: www.ijirset.com
Vol. 6, Issue 6, June 2017
B. BRAKE SPECIFIC FUEL CONSUMPTION:
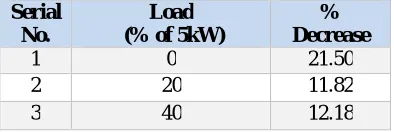
The brake specific fuel consumption (BSFC) was calculated at each load by the available data of power output and the readings of the fuel consumption taken on the burette for samples of 2ml. The figure 4 shows the BSFC values for 0%, 20% and 40% load at fixed intervals of time for only diesel fuel and duel fuel of diesel and hydrogen gas. It can be observed from the figures that there is a decrease in the BSFC. The average decrease in at different loads is as follows:
Serial No.
Load (% of 5kW)
% Decrease
1 0 21.50
2 20 11.82
3 40 12.18
Table 3 : Table of Percentage Decrease in BSFC at various loads
The decrease in BSFC while using duel fuel of diesel and hydrogen can be attributed to the higher power output of the engine at same consumption of diesel fuel. From the figure it can be inferred that the rate of decrease of BSFC is higher at low load condition. As the load is increased the difference between the BSFC reduces.
Figure 4 : Graph of BSFC V/S Percentage Load
C. BRAKE THERMAL EFFICIENCY:
The brake thermal efficiency was calculated at each load by the available data of power output and rate of fuel injection into the cylinder. The figure 5 shows the brake thermal efficiency values for 0%, 20% and 40% load at fixed intervals of time for only diesel fuel and duel fuel of diesel and hydrogen gas. It can be observed from the figures that there is a significant increase in the brake thermal efficiency. The average increase in at different loads is as follows:
Serial No.
Load (% of 5kW)
% Increase
1 0 21.79
2 20 9.89
3 40 11.01
Table 4: Table of Percentage increase of brake thermal efficiency at various loads
0 0.5 1 1.5 2 2.5
0 20 40
B
SF
C
(Kg
/k
W
-h
r)
ONLY DIESEL
ISSN(Online): 2319-8753 ISSN (Print): 2347-6710
International Journal of Innovative Research in Science,
Engineering and Technology
(An ISO 3297: 2007 Certified Organization)
Website: www.ijirset.com
Vol. 6, Issue 6, June 2017
The increase in brake thermal efficiency while using duel fuel of diesel and hydrogen can be attributed to the higher power output of the engine at same consumption of diesel fuel and the extra heat input due to hydrogen fuel. An increase of 11.01% in thermal efficiency at 40% load obtained at 95% confidence level is quite considerable.
Figure 5 : Graph of Brake Thermal Efficiency V/S Percentage Load
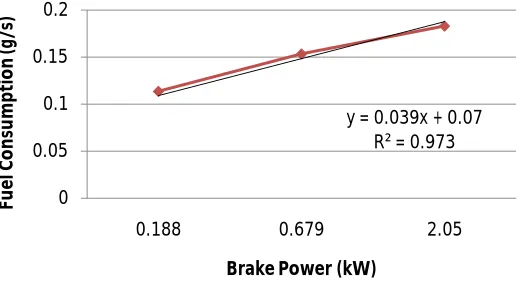
D. WILLIAN’S LINE:
Willian’s Line is the method to find out the friction power of the engine. Graph is plotted between fuel consumption and the brake power. This graph has the “y-intercept”. Thus Willian suggested that if the line is extended on the negative “x-axis”, the intercept would give the power lost in friction. The same has been done for only diesel as fuel and the duel fuel of Diesel and hydrogen.
In figure 6 the Willian’s Line for Diesel fuel has been shown. A trend line has been displayed on the results obtained to show the ‘Best fit line’. This line has been obtained through trial and error method with various intercept values. The best line with the R-squared value of 0.973 has been plotted in Figure 6. From the graph the friction power for diesel fuel is 1.79 kW.
Figure 6 : Graph of Willian’s Line for Diesel Fuel
In similar manner as explained above the trend line for Duel fuel of diesel and hydrogen gas has been plotted on Figure 7 with R-squared value of 0.979. The friction Power obtained from this line is 1.36 kW. A reduction of 24.02% at 95% confidence level in the friction power is quite significant.
0 5 10 15 20 25 30
0 20 40
B
R
EA
K
TH
ER
M
A
L
EF
FI
C
IE
N
C
Y
ONLY DIESEL
DIESEL + HYDROGEN
y = 0.039x + 0.07 R² = 0.973
0 0.05 0.1 0.15 0.2
0.188 0.679 2.05
Fu
e
l C
o
n
su
m
p
ti
o
n
(g
/s
)
ISSN(Online): 2319-8753 ISSN (Print): 2347-6710
International Journal of Innovative Research in Science,
Engineering and Technology
(An ISO 3297: 2007 Certified Organization)
Website: www.ijirset.com
Vol. 6, Issue 6, June 2017
Figure 7 : Graph of Willian’s Line for Duel fuel of diesel and hydrogen gas
E. WILLIAN’S LINE:
In the topic 3-D it is shown that the friction power is reduced by 24.02 %. Now, friction power is in inverse proportion with mechanical efficiency, as indicated power is the summation of brake power and friction power. So, the mechanical efficiency is increased due to decrease in friction power.
The plot of mechanical efficiency at different load and with both the experiments is shown in figure 8 at 0%, 20% and 40% load. An increase of 20.2% is seen at 40% load, which is significant at 95% confidence level.
Figure 8: Graph of Mechanical Efficiency V/S Percentage Load
V. CONCLUSION
The results obtained above concludes the following:
1. The Brake Specific Fuel Consumption (BSFC) of the engine decreases from 12-21% when Hydrogen cum
Diesel mixture is used rather than normal diesel injected engines.
2. For the same Fuel Consumption the Power output of the diesel engine is greater compared to normal Diesel
injected ingines by 13-16%.
3. The exhaust temperatures of the Hydrogen cum diesel injected engines are marginally less or equal to the
engine exhaust temperattures during normal diesel injected engines.
4. There has been observed a rise in Mechanical efficiency of the engine from 47% to about 61% in the
Hydrogen cum Diesel injected Engines.
y = 0.044x + 0.06 R² = 0.979
0 0.05 0.1 0.15 0.2 0.25
0.228 0.765 2.38
Fu
el
C
o
n
su
m
p
ti
o
n
(g
/s
)
Brake Power (kW)
0 0.1 0.2 0.3 0.4 0.5 0.6 0.7
0 20 40
M
e
ch
a
n
ic
al
E
ff
ic
ie
n
cy
Diesel Only
ISSN(Online): 2319-8753 ISSN (Print): 2347-6710
International Journal of Innovative Research in Science,
Engineering and Technology
(An ISO 3297: 2007 Certified Organization)
Website: www.ijirset.com
Vol. 6, Issue 6, June 2017
5. The Friction Power is reduced considerably.
The above conclusions have shown that even a little mixture of Hydrogen-Oxygen mixture with Diesel improves the performance of the engine considerably without any particular changes in the Diesel engine settings.
There are immense possibilities of using Hydrogen as a blend with Diesel in future engines. With perfect fine tuning of the engine parameters such as the injection pressure, injection timing, the Valve timing, the Valve opening and the other methods such as turbocharging or Supercharging, the performance of Diesel engines can be improved exponentially.
The applications of the Hydroxy generator in the future is very High having the following advantages:
1. The medium of electrolysis is Alkaline water and therefore is not much of a problem to store it.
2. The hydrogen is produced on demand therefore the heavy and dangerous pressurised cylinders are no longer
needed to be installed in the future generation Automoblies making them very Safe ti use.
3. The Hydrogen Oxygen mixture have a positive effect in performance of not only thr Diesel engines but also
the Otto Engines or the Engines that run on Gasoline. Therefore makin it an ideal mixture for any kind of vehicle in the market.
4. With more efficient production methods of Hydrogen using Pulsed electrolysis the more and more amounts of
Hydrogen oxygen mixtures can be produced on demand making the vehicle even more clean burning and pollution free.
5. With better reseacrh and manhours dedicated to the concept the Hydrogen generation kits then be developed
that can be capable of producing high volumes of Hydrogen Oxygen Mixtures so as to run the engines on 100% Hydrogen oxygen mixture.
REFERENCES
[1] Choongsik Bae, Jaeheun Kim. "Alternative fuels for internal combustion engines." Proceedings of the Combustion Institute 36 (2017): 3389– 3413.
[2] Roopesh Kumar Mehra, Hao Duan, Romualdas Juknelevičius, Fanhua Ma, Junyin Li. "Progress in hydrogen enriched compressed natural gas (HCNG) internal." Renewable and Sustainable Energy Reviews 80 (2017): 1458–1498.
[3] Y. Karagoz, N. Yuca, T. Sandalcı , A.S.Dalkılıc. "Effect of hydrogen and oxygen addition as a mixture on emissions and performance
characteristics of a gasoline engine." international journal of hydrogen energy 40 (2015): 8750-8760. [4] Vincent, I., Renewable and Sustainable Energy Reviews (2017), http://dx.doi.org/10.1016/j.rser.2017.05.258.
[5] Sebastian Verhelst, Thomas Wallner. "Hydrogen-fueled internal combustion engines." Progress in Energy and Combustion Science 35 (2009): 490–527.
[6] Taku Tsujimura, Yasumasa Suzuki. "The utilization of hydrogen in hydrogen/diesel dual." International journal of hydrogen energy 42 (2017): 14019-14029.