Studies. (Under the direction of Dr. Alison Motsinger-Reif).
In the last decade the endeavor of gaining a better understanding of how genotypes act and interact to form the phenotypes that are disease has experienced an information explosion, brought about by the successful completion of the human genome sequencing project and advances in genotyping technologies. The high volume data produced by these new technologies gave geneticists the opportunity to study the genome from broader perspectives and helped usher in the era of the Genome-Wide association Study (GWAS). These studies allow for hypothesis-free probing of the whole genome in order to find genetic variants that may be associated with disease risk, and as such are attractive for studying complex diseases where genotype to phenotype links are not well understood.
Until recently most researchers have focused mainly on finding additive (main) effects that contribute to disease phenotype. However, it has now been shown that epistatic effects (gene-gene interactions) as well as gene-environment interactions may also play significant roles in determining phenotype. Epistasis is now of special interest since the amounts of genetic variation explained by main effects found from GWAS have so far only accounted for small amounts of variation present in the diseases or traits of interest. In order for the study and detection of epistatic effects to become as common place as main effect testing is in GWAS, more methods have to be developed and improved upon to better handle the statistical and computational challenges that dealing with millions of interactions present.
detect interaction effects in diverse samples when using Multifactor Dimensionality
Reduction (MDR), a popular interaction testing method. Finally I present the results from a candidate-gene study of extrapulmonary tuberculosis as well as a genome-wide association study of the same disease. The findings from the following chapters, demonstrate that in order to have efficient tests for epistasis on a GWAS scale successful methods would need to not only detect interactions but should also have the capability of filtering and prioritizing results in order to increase their adoption by researchers. I also find that population
stratification is a major source of confounding for detection of interaction with MDR and that the consequences of not compensating for it are more severe for interactions than for main effects. The results from the Extrapulmonary Tuberculosis studies also reiterate the
by
Noffisat Oyindamola Oki
A dissertation submitted to the Graduate Faculty of North Carolina State University
in partial fulfillment of the requirements for the degree of
Doctor of Philosophy
Bioinformatics
Raleigh, North Carolina 2012
APPROVED BY:
_______________________________ ______________________________ Alison Motsinger-Reif Jeffrey Thorne
Committee Chair
________________________________ ________________________________
DEDICATION
In honor of my parents Lateef and Olaide Oki, thank you for your prayers, kind words of encouragement and for always believing in me even when I wasn’t sure what to believe. You have been my pillars, inspired me to reach for the extraordinary and not to settle for less, and
for that I would be always grateful, thank you.
To my family, thank you for your love, support, care packages and numerous phone calls to check in on me over the years. You have helped to make my journey on the path less
travelled easier and I am grateful.
BIOGRAPHY
Noffisat Oyindamola Oki is a native of Lagos, Nigeria and born to parents, Lateef and Olaide Oki. She spent her childhood and teenage years in Lagos where she attended Corona primary school and later Queens College for her secondary education. She received
admission to Shaw University, Raleigh North Carolina in 2002 and came to the United States to pursue a bachelor’s degree in Math and Computer Science. During her time at Shaw, she discovered her passion for research and teaching young children. She also came to the realization that she wanted to help the under-served and wanted a career that could provide her with a sense of purpose and of fulfillment in knowing she was contributing to a greater good. These realizations guided her decision to continue on to graduate school and pursue a degree in Bioinformatics where she could continue building on the skills she learned in her time as an undergraduate, and work in an area that can have impact human health outcomes. In 2006, she was accepted into the Bioinformatics program at North Carolina State
ACKNOWLEDGMENTS
I thank my advisor Dr. Alison Motsinger-Reif for giving me the opportunity to work with her and who was always insightful enough to give me projects that I could get excited about and always find the extra motivation to keep working on. You have been a great mentor to me and your support and encouragement helped make my time in graduate school more rewarding and I am very grateful. Seeing your accomplishments and work ethic in your short time at NC State, have also helped me in setting a standard for my road ahead.
I also want to thank my other committee members Dahlia Nielsen, Jeffrey Thorne and Matthew Breen who always had time in their busy schedules to meet with me and help me towards the completion of this degree. I extend my gratitude to Dr. Zhao-bang Zeng and Dr. John Godwin who helped in providing my financial support and other administrative
assistance for my graduate education. I also acknowledge the BRC graduate assistants over the years, especially Siarra Dickey who has helped me stay on top of situations and is never too busy to help out with a problem.
To the BRC faculty, staff, students and post-docs, thank you for making the BRC a welcoming environment and for the sense of community you provided with your open doors, warm smiles, and never being too busy for a quick question.
TABLE OF CONTENTS
LIST OF TABLES ...x
LIST OF FIGURES ... xii
CHAPTER 1: INTRODUCTION ...1
Genome-wide association studies (GWAS) as a tool for understanding the complexities of the genome and disease ...2
What is epistasis? ...5
Importance and prevalence of epistasis ...6
Challenges in studying epistasis ...7
Detecting Epistasis ...8
Logistic regression ...9
Multifactor Dimensionality Reduction (MDR) ...10
Random Forests (RF), Relief-F and Evaporative Cooling (EC) ...11
References ...16
CHAPTER 2: Multifactor Dimensionality Reduction as a Filter-Based Approach for Genome-Wide Association Studies ...22
Abstract ...23
Introduction ...24
Materials and Methods ...27
Data Simulations ...28
One-locus main effect models ...29
Two-locus interaction (epistatic) models ...30
Two-locus models with main effects ...30
Null model ...31
Data Analysis ...31
Multifactor dimensionality reduction ...31
Logistic Regression ...32
Evaporative cooling ...33
Genetic association interaction network ...34
Ranking filter ...35
Power analysis for the MDR filter ...35
False positive rate of MDR filter ...36
Large dataset analysis ...36
Implementation………....37
Results………...37
One-locus (main effect) models ...37
EC ranks for interacting loci for two-locus models ...38
Two-locus interaction (purely epistatic) models...38
Two-locus main effect and interaction models ...39
Null model ...40
Power analysis of MDR results...40
Large dataset results ...41
Conflict of Interest Statement ...50
Acknowledgements ...50
Footnotes ...50
References ...62
CHAPTER 3: A Covariate Adjustment for Population Stratification in Multifactor Dimensionality Reduction (MDR) ...69
Abstract ...69
Introduction ...70
Transmission-Disequilibrium Test (TDT) ...73
Genomic Control ...74
Structured Association ...75
Principal Components Analysis (PCA) ...76
Mixed Models ...77
Methods...79
Multifactor Dimensionality Reduction (MDR) ...79
Generalized Multifactor Dimensionality Reduction (GMDR) ...81
Sampling-based covariate adjustment for MDR ...82
Principal components analysis ...83
Application to HapMap Datasets ...84
Data simulations...84
One-locus Simple Mendelian (homogenic) models (M1 and M2) ...85
Two-locus XOR model (XOR) ...85
Implementation ...87
Results ...88
Model 1 (M1) ...88
Model 2 (M2) ...88
XOR model (XOR) ...89
Discussion ...89
References ...98
CHAPTER 4: Polymorphisms in IL-1β, vitamin D receptor Fok1, and Toll-like receptor 2 are associated with extrapulmonary tuberculosis102 Abstract ...103 Background ...103 Method ...103 Results ...103 Conclusions ...104 Background ...104 Results ...106
Clinical and Demographic Characteristics...106
SNPs Associated with Tuberculosis in Previous Studies ...106
SNPs in Candidate Genes ...107
Discussion ...108
Conclusions ...112
Study Participants ...112
Sample Collection ...114
SNP Genotyping ...114
Microsatellite Genotyping ...114
Candidate Gene Genotyping ...115
Quality Control ...116
Statistical Analysis ...116
Competing interests ...118
Author’s contributions ...118
Acknowledgements ...119
References ...127
CHAPTER 5: Novel Human Genetic Variants Associated with Extrapulmonary Tuberculosis: a Pilot Genome Wide Association Study ...133
Abstract ...134 Background ...134 Findings...134 Conclusions ...135 Introduction ...135 Methods...137 Study participants...137
Laboratory techniques ...138
Genome-wide DNA genotyping ...138
Quality control ...139
Statistical analysis ...140
Results ...142
Extrapulmonary tuberculosis vs. PPD+ controls ...144
Extrapulmonary tuberculosis vs. pulmonary tuberculosis ...144
Any tuberculosis vs. PPD+ controls ...144
Discussion ...144
Conclusions ...148
Abbreviations ...149
Competing interests ...149
Author’s contributions ...149
Acknowledgements ...150
References ...163
CHAPTER 6: CONCLUSION ...168
An MDR filter for prioritizing interactions ...170
Population stratification and MDR ...171
A candidate-gene study of Extrapulmonary Tuberculosis ...171
A pilot genome-wide association study of Extrapulmonary Tuberculosis ...172
The road ahead ...173
References ...176
APPENDICES ...178
LIST OF TABLES
Table 3.1 Penetrance models used for disease locus simulations ...92
Table 3.2 Power results per model for covariate adjusted MDR methods ...94
Table 3.3 Power results per method of covariate adjusted MDR ...95
Table 4.1 Clinical and Demographic Characteristics of the Study Population ...120
Table 4.2 Polymorphisms Tested that had Previously Been Reported as Associated with Tuberculosis ...121
Table 4.3 Of the Polymorphisms Tested that had Previously Been Reported as Associated with Tuberculosis (Table 4.2), the SNPs Associated with Tuberculosis in this Study ...123
Table 4.4 Polymorphisms in the Affymetrix GeneChip® Human Mapping 50K Xba Array in Genes Hypothesized to be Associated with Tuberculosis Pathogenesis ...124
Table 4.5 Of the SNPs Listed in Table 4.4, the SNPs Associated with Tuberculosis in this Study Population ...124
Table 4.6 Odds Ratios that Could Have Been Detected Given the Sample Size and Minor Allele Frequency in the Study Population...125
Table 5.1 Clinical and Demographic Characteristics of the Study Population ...151
Table 5.2 Statistically Significant SNPs Identified in Extrapulmonary Tuberculosis Cases vs. PPD + Controls ...152
Table 5.3 Linkage Disequilibrium (LD) scores of Statistically Significant SNPs Identified in the Same Gene or chromosome ...153
Table 5.4 Statistically Significant SNPs Identified in Extrapulmonary Tuberculosis Cases vs. Pulmonary Tuberculosis Controls ...154
Table 5.5 Statistically Significant SNPs Identified in Patients with Any Tuberculosis (Pulmonary or Extrapulmonary) vs. PPD + Controls ...155
Table A1 Penetrance functions for one-locus dominant main effect models ...179
Table A3 Penetrance functions for one-locus additive main effect models ...181 Table A4 Penetrance functions for two-locus interaction (epistatic) effect
models with minor allele frequency of 0.2 ...182 Table A5 Penetrance functions for two-locus interaction (epistatic) effect
models with minor allele frequency of 0.4 ...183 Table A6 Penetrance functions for two-locus interaction (epistatic) and main
LIST OF FIGURES
Figure 2.1 Summary of MDR implementation ...51
Figure 2.2 Ranking of the simulated disease locus for the one-locus dominant main effect model ...52
Figure 2.3 Ranking of the simulated disease locus for the one-locus recessive main effect model ...53
Figure 2.4 Ranking of the simulated disease locus for the one-locus additive main effect model ...54
Figure 2.5 EC Ranking of the simulated disease locus combination for the two-locus joint main and interaction effect model ...55
Figure 2.6 EC Ranking of the simulated disease locus combination for the two-locus pure interaction effect model ...56
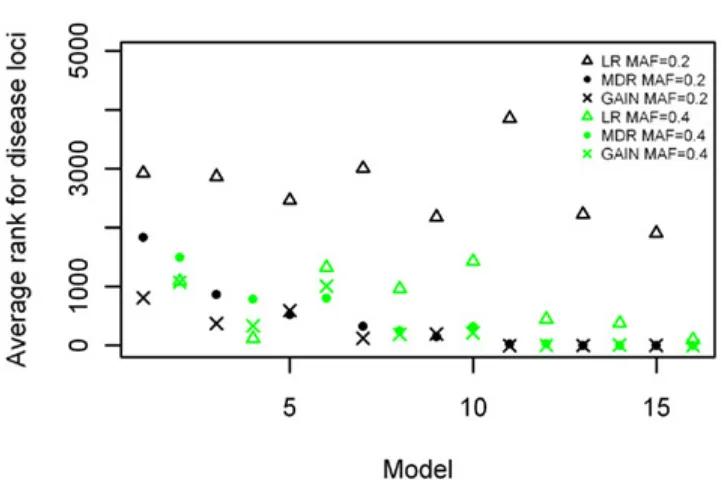
Figure 2.7 Ranking of the simulated disease locus for the two-locus pure interaction effect model ...57
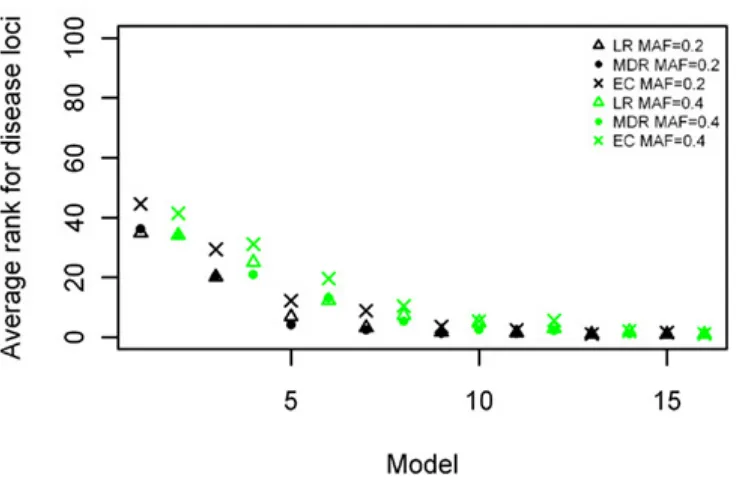
Figure 2.8 Ranking of the simulated disease locus combination for the two-locus main and interaction effect ...58
Figure 2.9 Ranking of LR, GAIN and MDR on the null model...59
Figure 2.10 Power of MDR for detecting correct disease loci ...60
Figure 2.11 False positive rate of MDR as filter ...61
Figure 3.1 Population substructure within the HapMap samples from the plot of the top two eigen vectors obtained from Eigenstrat ...93
Figure 3.2 Power of eigen-GMDR and cluster-GMDR ...96
Figure 3.3 Power of covariate-MDR and stratified-MDR ...96
Figure 3.4 Power of stratified MDR for CEU and YRI populations ...97
Figure 5.1 Figure 5.1 Population Sub-structure within our Study Population
Using the Top Two Eigen Vectors Calculated by EIGENSTRAT ...156 Figure 5.2 Distribution of p-values from the Logistic Regression Test of
Extrapulmonary Tuberculosis Cases vs. PPD+ Controls ...157 Figure 5.3 Distribution of p-values from the Logistic Regression Test of
Extrapulmonary Tuberculosis Cases vs. Pulmonary Tuberculosis
Controls ...158 Figure 5.4 Distribution of p-values from the Logistic Regression Test of all
Tuberculosis Patients (Pulmonary and Extrapulmonary) vs.
PPD + Controls ...159 Figure 5.5 Q-Q plot of the expected versus observed -2log(p-values) for
Extrapulmonary TB vs. PPD+ ...160 Figure 5.6 Q-Q plot of the expected versus observed -2log(p-values) for
Extrapulmonary TB vs. Pulmonary TB ...161 Figure 5.7 Q-Q plot of the expected versus observed -2log(p-values) for
CHAPTER 1 INTRODUCTION
The completion of the human genome project and the advances made in
high-throughput genotyping technologies have heralded an exciting new era of opportunity in the always evolving field of human genetics. These technologies have provided us with a wealth of data on the human genome and have also introduced new ways of interrogating the basis of genetic disease. The Human genome can now be investigated at greater depth and with more precision, and access to a detailed genome sequence has made it possible to ask and answer questions that may have been theoretically possible but practically infeasible two decades ago. In order to analyze, understand and tell a cohesive story about the origins and nature of genetic disease from the vast and varying types of genetic information now available, new and highly interdisciplinary fields have emerged such as bioinformatics, functional genomics, and systems biology that tackle different aspects of the exploration and analysis of these data.
The study of human diseases has especially benefitted from these new developments and is now a highly interdisciplinary effort involving methods extrapolated from several disciplines such as computer science and physics. It is the hope that the combination of more information and new and improved ways of making sense of it all can lead to a better
Genome wide association Studies (GWAS) as a tool for understanding the complexities of the genome and disease
It is now possible and indeed the norm to conduct genome wide scale studies to find associations between disease phenotypes and genetic variants that may predispose to disease. The studies typically use the new high-throughput platform to collect large amounts of genotype data from hundreds of thousands of genetic variants, typically in the form of single nucleotide polymorphisms (SNPs) and now more recently larger DNA or RNA sequence variants, from affected and unaffected individuals in order to find associations between the genetic variants and the disease. Many of these studies have been quite successful (Manolio 2008) and genes have been implicated in diseases such as type 2 diabetes (Scott 2007), breast cancer (Hunter 2007), HIV (Fellay 2007), cardiovascular disease (McPherson 2007), and prostate cancer (Gudmundsson 2007) to name a few. However, while there have been much success, there have also been many studies that fell short in providing the clues and answers they were expected to find. The GWAS approach is not without its challenges (McCarthy 2008), some of the most problematic of which include the high rate of failure in replicating findings from initial studies and the small amount of heritability explained by those findings that do replicate. This failure in replication has been attributed to several reasons (Chanock 2007), one of which is an insufficient sample size in the initial study leading to a higher probability of false positives and loss of power to find true positives, therefore causing poor or no replication in a follow-up sample. Another problem lies in using a mixed population sample without correcting for population stratification causing associations based on
design problems of using cases that are not properly matched to controls (Chanock 2007) or replication samples are not properly matched to the initial population, causing population specific risk variants that may have been found in the initial sample but may not replicate in another different population; thus leading to the mislabeling of true positive findings as false and their subsequent exclusion from any further analysis. These population specific risks variants may have been created from significantly different linkage disequilibrium patterns, allelic variations and even subtle phenotypic differences between the replication sample and the initial sample.
It was once thought that the availability of large amounts of genetic data would make the challenge of finding the genes responsible for complex human genetic disease easier (Risch 1996) as the limited technology for genotyping large amounts of variants was thought to be the main obstacle. Today the technologies are now vastly improved and can produce large amounts of raw genetic data, which have made GWAS possible. While they have proven to be quite useful and successful in finding genes that predict disease risk, many of these genome wide studies have presented even more questions than they were able to
current approaches in GWAS have not explained a large amount of the genetic variation seen, they have however introduced more questions. GWAS are now increasingly becoming a hypothesis generating tool and have led to increased interest in studying other types of genetic variants such as structural variants that have not traditionally been considered for genome wide studies (Frazer 2009; Manolio 2009). There are still other reasons why the current GWAS methods have not yielded the successes that many had thought they would, some of which include:
1. Our inability to reliably include or control for other factors that may be contributing to the disease phenotype into the genetic association analysis is a source of concern as it is now a widely held belief that environmental factors such as exposure to toxic agents may also influence the phenotype of a disease (Brennan 2002; Le Marchand 2008; Thomas 2010) and as such it is becoming increasingly important to find ways to include or account for such contribution or confounding in GWAS.
2. The use of the statistical models of significance as a determinant of causal properties of a genetic variant without adequate consideration of their biological interpretation may also lead to low success with functional validation of GWAS findings (Cordell 2002; Moore 2005; Cordell 2009).
investigated, only variants that were shown to have significant main effects were tested for interactions. Studies have now shown that this is not always the case (Greene 2009; Wade 2001; Hirschhorn 2002) and that gene-gene interactions as well as gene-environment interactions can have significant effects on the phenotype even in the absence of any significant main effects of those same variants or any others (Culverhouse 2002; Marchini 2005).
While these are the main reasons that have been put forward to explain the lack of success of some of these studies, with more yet to be discovered, there is still a lot of effort being put towards finding not only better analysis methods but also addressing the previously mentioned problems associated with GWAS. Of the above mentioned factors, epistasis has shown promise of having a significant impact on finding more associations between genetic variants and disease, and it may have further implications for how we study the genetics of disease as well as for personalized medicine.
What is Epistasis?
The first definition of epistasis was given by William Bateson who described it as a deviation from Mendelian inheritance (Bateson 1909); it is now more commonly defined as interactions between genes at different loci, where the effects of an allele at one locus are masked by an allele at another locus. The effects of epistasis could be beneficial, producing no disease phenotype or a less severe manifestation of the phenotype or it could be harmful in varying degrees.
lead to different ways of approaching and studying gene-gene interactions by statisticians and biologists. While biologists may view epistasis as physical and biochemical reactions that occur between genes and their regulatory networks, statisticians typically take the view of it being a deviation from additivity (as described by Fisher (Fisher 1918)) in some statistical model that defines the relationship between the different genotypes and phenotypes of a population. Biological epistasis can occur in several ways: through the interaction between transcription factors or promoter sequence, or through enzymes in a metabolic pathway (Moore 2005). An example of such a form of epistasis is in sickle cell disease where there is a difference in biomolecular interactions of β-globin proteins between sick and healthy individuals (Weatherall 2001; Templeton 2000; Giblett 1969).
Importance and prevalence of epistasis
Epistasis is now increasingly assumed to be a significant factor in understanding the genetic architecture of complex disease (Moore 2003) and there are a number of studies on complex diseases in which evidence of epistasis has been found (Ritchie 2001; Zee 2002; Tsai 2004; Kroymann 2005; Shao 2008). Such results are beginning to show that epistasis may be more prevalent and widespread than originally thought, and one of the reasons why it is now thought to be an important factor not only for failed replications of GWAS (Greene 2009) but even more so for why the main effects that are found in GWAS account for a small amount of heritability in the disease (Eichler 2010). It has also now been shown that even diseases that have been described as simple Mendelian (monogenic) such as Sickle Cell Anemia (Templeton 2000), Cystic Fibrosis (Dipple 2000) and Hirschsprung disease
to produce the variation in phenotypes that have been observed, making epistasis an important factor in determination of the phenotypes for these diseases.
Challenges in studying epistasis
statistical methods need to be developed that can better handle the non-additive components of these interactions while also allowing for the inclusion of other factors such as the
environmental factors. These methods would need to be capable of filtering and prioritizing with preference for biological relevance and not only statistical significance, while also maintaining computational efficiency as this becomes an issue when large numbers of genetic variants and their interactions have to be analyzed with constraints of time and a limited availability of computational resources.
Detecting Epistasis
Several methods have been proposed and developed to study epistasis (Motsinger 2007; Wang 2011) including regression based methods such as logistic regression (Hosmer DW 2000) and penalized regression (Park 2008); data mining and machine learning
approaches such as Random Forests (RF) (Breiman 2001), Grammatical Evolution Neural Networks (GENN) (Motsinger-Reif 2008), Recursive Elimination of Features-F (Relief-F) (Robnik-Sikonja 2003), Tuned Relief-F (Moore 2007), Evaporative Cooling (EC)
(McKinney 2007), Multifactor Dimensionality Reduction (MDR) (Ritchie 2001; Hahn 2003); and others methods such as Restricted Partitioning Method (RPM) (Culverhouse 2004) and Combinatorial partitioning (Nelson 2001). In this dissertation I provide a brief overview of a few of these methods, specifically logistic regression, MDR, Random Forests and
Logistic Regression: Regression based methods have traditionally been the methods used for analyzing epistatic interactions in association studies. They use a statistical model to describe the relationship between the linear combination of predictor variables in this case the genetic variants, and the outcome which here is the disease phenotype. Logistic regression is used when the outcome of the disease is binary (i.e. case or control), and probability (p) of having the disease is then modeled on a log odds scale: ln (p/ (1-p)) = a+ β1x1+β2x2 +β3 x1x2
Where the equation models the relationship between the explanatory variables or predictors (x1 and x2) and the interaction between them (x1x2). Logistic regression can also be used for variable selection as in stepwise regression (Hosmer DW 2000), where the variants with significant main effects are first selected and then included in a second step to find the interactions between them. This process however eliminates the possibility of finding
interactions between variants with no main effects. Logistic regression also suffers when data are highly dimensional as it often is the case when searching for interactions in a genetic association study, thus leading to high rates of false positives due to parameter estimates with large standard errors. There are statistical software packages available for performing logistic regression on a genome-wide scale, one of which is the whole genome analysis tool PLINK (Purcell 2007) that provides the option of using logistic regression for an association analysis on biallelic data.
interactions in genetic association studies (He 2009; Ritchie 2003). In brief, the MDR
process involves first dividing the data into N (where 1≤ N≤10) cross validation intervals for training and testing in order to prevent model over-fitting such that our final model can predict for all data. In the next step, a list of all possible n-loci combinations to be evaluated is created (where n is the order of interactions). Each of these locus combinations is then placed in a contingency table of k-dimensions having all possible genotype combinations obtained from the n-loci combinations. The ratio of the number of cases to controls for each genotype is then calculated and compared to a set threshold. Those with ratios below the threshold are labeled as low-risk, while those above it are labeled as high risk. This process effectively reduces this high dimensional data to two levels, high and low risk. The balanced accuracy (Velez 2007) (for imbalanced datasets where there are an unequal number of cases and controls) or classification accuracy of the model in the training set as well as its
prediction accuracy in the testing set is calculated. The prediction accuracy gives a measure of how well the model predicts disease risk in the testing set. This process is repeated for all possible n-locus combinations of the data and for each cross validation interval. The model that maximizes the testing accuracy and the cross validation consistency (a measure of how often a model is found to be the best model in the N intervals) is then selected as the best model. Permutation testing is finally used for hypothesis testing of the best model. A more detailed description of MDR is included in chapter 2.
valuable feature lies in its ability to reduce highly dimensional multilocus genotypes into two levels high and low risk without making any assumptions about the genetic model. It has also been shown to be powerful and robust to genotyping errors and missing data (Ritchie 2003). On the other hand MDR is impaired in the presence of heterogeneity as it loses power to detect the best model. In theory, the MDR algorithm can handle any number of high order interactions, and there are computationally efficient implementations for all pairwise interactions (Bush 2006; Sinnott-Armstrong 2009) for up to 100,000 variants, however without a super computer, it is currently too computationally intensive for genome-wide scale studies investigating interactions of greater orders.
Random Forests (RF), Relief-F and Evaporative Cooling (EC): Unlike MDR and logistic regression which do exhaustive searches, RF (Breiman 2001), Relief-F (Robnik-Sikonja 2003; Moore 2007) and EC (McKinney 2007) are machine learning methods that use some combination of recursion, heuristics, iterative and filtering algorithms to select models with best potential for interactions. The Random Forests method (Breiman 2001) builds
which could be based on some metric of genetic similarity between the classes of phenotypes (case or control for GWAS). An importance score is then estimated for each predictor
variable based on the difference in values between pairs. While Relief-F is very powerful and can handle large datasets, it struggles when there are a lot of noise variables, which becomes an acute problem when analyzing GWAS data. The Relief-F algorithm is flexible enough to be implemented with other methods and it has been implemented in the MDR software package along with a modified version Tuned Relief-F (Turf) (Moore 2007).
The Evaporative Cooling feature selection algorithm (McKinney 2007) builds on the strengths of Random forests and Relief-F and combines them with thermodynamic principles involved in the cooling of atoms. Its aim is to increase the feature-space of density by
evaporating (iteratively removing) noise variants, where this feature-space contains the variants with most potential for interaction. More details about the Evaporative Cooling algorithm are also discussed in chapter 2.
Finally, due to large amounts of variables involved in genetic association studies and the exponentially large amount of interactions that may need to be probed in the investigation of epistasis, it is now clear that methods need to be developed that would not only find statistically significant interactions but also allow for flexibility in filtering the results. I attempt to address some of these issues in successive chapters of this dissertation by look at a subset of issues relating to the overall improvement of the utility of GWAS.
As stated previously, many of the traditional statistical methods for genetic
variables while also testing for interactions without main effects (Moore 2002). Therefore they require large sample sizes in order to have greater power in detecting interactions, the costs of which may be prohibitive. They also typically assume a statistical or genetic model in their hypothesis, which may not always be appropriate for the data being analyzed. Thus, our lack of complete understanding of human genetic architecture and the costs associated with collecting a large enough sample size, puts such methods at a disadvantage for analyzing human genetic data, which is one reason why MDR is of particular interest.
The concept of a non-parametric (no hypothesis is made based on a statistical parameter) and genetic model-free approach to detecting gene-gene and gene-environment interactions with the added advantage of being adaptable for higher-order interactions is one that makes MDR attractive for real data analysis. The basis of the method makes it applicable to not only genetic association analysis, but also for pharmacogenomic studies such as in drug testing where outcomes are typically dichotomous (e.g. response/nonresponse). While the data reduction algorithm of MDR is relatively simple, it is also quite powerful in
detecting interaction effects and can do so in the presence or absence of significant marginal effects (Ritchie 2005). In this dissertation I draw heavily on the utility of MDR as a data reduction mechanism for analyzing GWAS data and employ it as a tool for exploring and solving some of the problems associated with GWAS when considering epistatic effects.
If one was to consider minimal number of epistatic associations that may be
statistically significant associations to be found and as such it is no longer enough to simply find all significant interactions, there would also be a need for some additional methods that can filter the results and select what may be the most useful results. The MDR algorithm can accomplish the task of testing all possible interactions in a dataset, and will not only select the single best model based on prediction accuracy, but its framework also allows for the retention of all models for further analysis since it performs an exhaustive search. This property of MDR also allows for the development of a filtering method; a general concept which I later adapt for two other methods (Logistic regression and Evaporative cooling) for comparison to MDR.
Population stratification, a source of confounding in GWAS is another problem for which an optimal solution has not been devised where MDR analysis is concerned. The most popular approach is to stratify the data into the appropriate number of subpopulations before analysis with MDR. This subdivision may be done along ethnic/racial lines or through some other empirical form of population clustering such as with principal components analysis. This method inevitably results in separate analysis for each population and reduces the effective sample size for the whole study (as it would for any other method). I explore the possibility of simultaneously running the MDR procedure with a covariate that may correct for population stratification confounding and the success of which may eliminate the need for prior divisions of the dataset.
References
Bateson, W. 1909. Mendel's Principles of Heredity. Cambridge: Cambridge University press. Breiman,L. (2001). Random Forests. Machine Learning 45 (1) 5-32.
Brennan,P. (2002). Gene–environment Interaction and Aetiology of Cancer: What does it Mean and how can we Measure it? Carcinogenesis 23 (3) 381-387.
Bush,W. S., Dudek,S. M., and Ritchie,M. D. (2006). Parallel Multifactor Dimensionality Reduction: A Tool for the Large-Scale Analysis of gene–gene Interactions. Bioinformatics 22 (17) 2173-2174.
Campbell,C. D., Ogburn,E. L., Lunetta,K. L., Lyon,H. N., Freedman,M. L., Groop,L. C., Altshuler,D., Ardlie,K. G., and Hirschhorn,J. N. (2005). Demonstrating Stratification in a European American Population. Nat.Genet. 37 (8) 868-872.
Chanock,S. J., Manolio,T. A., Boehnke,M., Boerwinkle,E., Hunter,D. J., Thomas,G., Hirschhorn,J. N., and et al. (2007). Replicating Genotype-Phenotype Associations. Nature 447 (7145) 655-660.
Chung,Y., Lee,S. Y., Elston,R. C., and Park,T. (2007). Odds Ratio Based Multifactor-Dimensionality Reduction Method for Detecting gene–gene Interactions. Bioinformatics 23 (1) 71-76.
Cordell,H. J. (2009). Detecting Gene-Gene Interactions that Underlie Human Diseases. Nat.Rev.Genet. 10 (6) 392-404.
Cordell,H. J. (2002). Epistasis: What it Means, what it Doesn't Mean, and Statistical Methods to Detect it in Humans. Human Molecular Genetics 11 (20) 2463-2468.
Culverhouse,R., Klein,T., and Shannon,W. (2004). Detecting Epistatic Interactions Contributing to Quantitative Traits Genet.Epidemiol. 27 (2) 141-152.
Culverhouse,R., Suarez,B. K., Lin,J., and Reich,T. (2002). A Perspective on Epistasis: Limits of Models Displaying no Main Effect. Am.J.Hum.Genet. 70 (2) 461-471.
Dipple,K. M. and McCabe,E. R. B. (2000). Modifier Genes Convert “Simple” Mendelian Disorders to Complex Traits. Mol.Genet.Metab. 71 (1–2) 43-50.
Fellay,J., Shianna,K. V., Ge,D., Colombo,S., Ledergerber,B., Weale,M., Zhang,K., Gumbs,C., Castagna,A., Cossarizza,A., Cozzi-Lepri,A., De Luca,A., Easterbrook,P., Francioli,P., Mallal,S., Martinez-Picado,J., Miro,J. M., Obel,N., Smith,J. P., Wyniger,J., Descombes,P., Antonarakis,S. E., Letvin,N. L., McMichael,A. J., Haynes,B. F., Telenti,A., and Goldstein,D. B. (2007). A Whole-Genome Association Study of Major Determinants for Host Control of HIV-1. Science 317 (5840) 944-947.
Fisher, R. A. (1918). The Correlation between Relatives on the Supposition of Mendelian Inheritance. Trans.Roy.Soc.Edinb. 52, 399-433
Frazer,K. A., Murray,S. S., Schork,N. J., and Topol,E. J. (2009). Human Genetic Variation and its Contribution to Complex Traits. Nat.Rev.Genet. 10 (4) 241-251.
Giblett, E. R. 1969. Genetic Markers in Human Blood. Philadelphia: FA Davis Co.
Greene,C. S., Penrod,N. M., Williams,S. M., and Moore,J. H. (2009). Failure to Replicate a Genetic Association may Provide Important Clues about Genetic Architecture. PLoS ONE 4 (6) e5639.
Gudmundsson,J., Sulem,P., Manolescu,A., Amundadottir,L. T., Gudbjartsson,D., Helgason,A., Rafnar,T., Bergthorsson,J. T., Agnarsson,B. A., Baker,A., Sigurdsson,A., Benediktsdottir,K. R., Jakobsdottir,M., Xu,J., Blondal,T., Kostic,J., Sun,J., Ghosh,S., Stacey,S. N., Mouy,M., Saemundsdottir,J., Backman,V. M., Kristjansson,K., Tres,A., Partin,A. W., Albers-Akkers,M., Godino-Ivan Marcos,J., Walsh,P. C., Swinkels,D. W., Navarrete,S., Isaacs,S. D., Aben,K. K., Graif,T., Cashy,J., Ruiz-Echarri,M., Wiley,K. E., Suarez,B. K., Witjes,J. A., Frigge,M., Ober,C., Jonsson,E., Einarsson,G. V., Mayordomo,J. I., Kiemeney,L. A., Isaacs,W. B., Catalona,W. J., Barkardottir,R. B., Gulcher,J. R.,
Thorsteinsdottir,U., Kong,A., and Stefansson,K. (2007). Genome-Wide Association Study Identifies a Second Prostate Cancer Susceptibility Variant at 8q24. Nat.Genet. 39 (5) 631-637.
Hahn,L. W., Ritchie,M. D., and Moore,J. H. (2003). Multifactor Dimensionality Reduction Software for Detecting Gene-Gene and Gene-Environment Interactions. Bioinformatics 19 (3) 376-382.
He,H., Oetting,W., Brott,M., and Basu,S. (2009). Power of Multifactor Dimensionality Reduction and Penalized Logistic Regression for Detecting Gene-Gene Interaction in a Case-Control Study. BMC Med. Genet. 10 (1) 127.
Hirschhorn,J. N., Lohmueller,K., Byrne,E., and Hirschhorn,K. (2002). A Comprehensive Review of Genetic Association Studies. Genet. Med. 4 (2) 45-61
Hunter,D. J., Kraft,P., Jacobs,K. B., Cox,D. G., Yeager,M., Hankinson,S. E., Wacholder,S., Wang,Z., Welch,R., Hutchinson,A., Wang,J., Yu,K., Chatterjee,N., Orr,N., Willett,W. C., Colditz,G. A., Ziegler,R. G., Berg,C. D., Buys,S. S., McCarty,C. A., Feigelson,H. S., Calle,E. E., Thun,M. J., Hayes,R. B., Tucker,M., Gerhard,D. S., Fraumeni,J. F., Hoover,R. N.,
Thomas,G., and Chanock,S. J. (2007). A Genome-Wide Association Study Identifies Alleles in FGFR2 Associated with Risk of Sporadic Postmenopausal Breast Cancer. Nat.Genet. 39 (7) 870-874.
Kroymann,J. and Mitchell-Olds,T. (2005). Epistasis and Balanced Polymorphism Influencing Complex Trait Variation. Nature 435 (7038) 95-98.
Lee,S.Y., Chung,Y., Elston,R. C., Kim,Y., and Park,T. (2007). Log-Linear Model-Based Multifactor Dimensionality Reduction Method to Detect gene–gene Interactions.
Bioinformatics 23 (19) 2589-2595.
Le Marchand,L. and Wilkens,L. R. (2008). Design Considerations for Genomic Association Studies: Importance of Gene-Environment Interactions. Cancer Epidemiology Biomarkers & Prevention 17 (2) 263-267.
Lewontin,R. C. (2006). Commentary: Statistical Analysis Or Biological Analysis as Tools for Understanding Biological Causes. International Journal of Epidemiology 35 (3) 536-537. Lewontin,R. (1974). Annotation: The Analysis of Variance and the Analysis of Causes. Am.J.Hum.Genet. 26 (3) 400-411.
Lou, Xiang-Yang, Guo-Bo Chen, Lei Yan, Jennie Z. Ma, Jun Zhu, Robert C. Elston, and Ming D. Li. 2007. A Generalized Combinatorial Approach for Detecting Gene-by-Gene and Gene-by-Environment Interactions with Application to Nicotine Dependence. Am.J.
Hum.Genet. 80 (6) 1125-1137.
Manolio,T. A., Brooks,L. D., and Collins,F. S. (2008). A HapMap Harvest of Insights into the Genetics of Common Disease. J.Clin.Invest. 118 (5) 1590-1605.
Manolio,T. A., Collins,F. S., Cox,N. J., Goldstein,D. B., Hindorff,L. A., Hunter,D. J., McCarthy,M. I., Ramos,E. M., Cardon,L. R., Chakravarti,A., Cho,J. H., Guttmacher,A. E., Kong,A., Kruglyak,L., Mardis,E., Rotimi,C. N., Slatkin,M., Valle,D., Whittemore,A. S., Boehnke,M., Clark,A. G., Eichler,E. E., Gibson,G., Haines,J. L., Mackay,T. F. C.,
McCarroll,S. A., and Visscher,P. M. (2009). Finding the Missing Heritability of Complex Diseases. Nature 461 (7265) 747-753.
McCarthy,M. I., Abecasis,G. R., Cardon,L. R., Goldstein,D. B., Little,J., Ioannidis,J. P. A., and Hirschhorn,J. N. (2008). Genome-Wide Association Studies for Complex Traits: Consensus, Uncertainty and Challenges. Nat.Rev.Genet. 9 (5) 356-369.
McKinney,B. A., Reif,D. M., White,B. C., Crowe,J. E., and Moore,J. H. (2007). Evaporative Cooling Feature Selection for Genotypic Data Involving Interactions. Bioinformatics 23 (16) 2113-2120.
McPherson,R., Pertsemlidis,A., Kavaslar,N., Stewart,A., Roberts,R., Cox,D. R., Hinds,D. A., Pennacchio,L. A., Tybjaerg-Hansen,A., Folsom,A. R., Boerwinkle,E., Hobbs,H. H., and Cohen,J. C. (2007). A Common Allele on Chromosome 9 Associated with Coronary Heart Disease. Science 316 (5830) 1488-1491.
Moore,J. H. and Williams,S. M. (2009). Epistasis and its Implications for Personal Genetics. Am.J.Hum.Genet. 85 (3) 309-320.
Moore,J. H. (2003). The Ubiquitous Nature of Epistasis in Determining Susceptibility to Common Human Diseases. Hum .Hered. 56 73-82.
Moore,J. H. and Williams,S. M. (2002). New Strategies for Identifying Gene-Gene Interactions in Hypertension. Ann.Med. 34 (2) 88-95.
Moore,J. H. and Williams,S. M. (2005). Traversing the Conceptual Divide between Biological and Statistical Epistasis: Systems Biology and a More Modern Synthesis. Bioessays 27 (6) 637-646.
Moore, Jason and Bill White. (2007). Tuning ReliefF for Genome-Wide Genetic Analysis. In Evolutionary Computation, Machine Learning and Data Mining in Bioinformatics, edited by Elena Marchiori, Jason Moore and Jagath Rajapakse. Vol. 4447, 166-175: Springer Berlin / Heidelberg. doi:10.1007/978-3-540-71783-6_16.
Motsinger,A. A., Ritchie,M. D., and Reif,D. M. (2007). Novel Methods for Detecting Epistasis in Pharmacogenomics Studies. Pharmacogenomics 8 (9) 1229-1241.
Motsinger-Reif,A. A., Dudek,S. M., Hahn,L. W., and Ritchie,M. D. (2008). Comparison of Approaches for Machine-Learning Optimization of Neural Networks for Detecting Gene-Gene Interactions in Gene-Genetic Epidemiology. Gene-Genet.Epidemiol. 32 (4) 325-340.
Nelson,M. R., Kardia,S. L. R., Ferrell,R. E., and Sing,C. F. (2001). A Combinatorial Partitioning Method to Identify Multilocus Genotypic Partitions that Predict Quantitative Trait Variation. Genome Research 11 (3) 458-470.
Purcell,S., Neale,B., Todd-Brown,K., Thomas,L., Ferreira,M. A. R., Bender,D., Maller,J., Sklar,P., de Bakker,P. I. W., Daly,M. J., and Sham,P. C. (2007). PLINK: A Tool Set for Whole-Genome Association and Population-Based Linkage Analyses. 81 (3) 559-575. Risch,N. and Merikangas,K. (1996). The Future of Genetic Studies of Complex Human Diseases. Science 273 (5281) pp. 1516-1517.
Ritchie,M. D., Hahn,L. W., and Moore,J. H. (2003). Power of Multifactor Dimensionality Reduction for Detecting Gene-Gene Interactions in the Presence of Genotyping Error, Missing Data, Phenocopy, and Genetic Heterogeneity. Genet.Epidemiol. 24 (2) 150-157. Ritchie,M. D., Hahn,L. W., Roodi,N., Bailey,L. R., Dupont,W. D., Parl,F. F., and Moore,J. H. (2001). Multifactor-Dimensionality Reduction Reveals High-Order Interactions among Estrogen-Metabolism Genes in Sporadic Breast Cancer. Am.J.Hum.Genet. 69 (1) 138-147. Ritchie,M. D. and Motsinger,A. A. (2005). Multifactor Dimensionality Reduction for Detecting Gene-Gene and Gene-Environment Interactions in Pharmacogenomics Studies. Pharmacogenomics. 6 (8) 823-834.
Robnik-Sikonja,M. and Kononenko,I. (2003). Theoretical and Empirical Analysis of ReliefF and RReliefF. Machine Learning 53 (1) 23-69.
Scott,L. J., Mohlke,K. L., Bonnycastle,L. L., Willer,C. J., Li,Y., Duren,W. L., Erdos,M. R., Stringham,H. M., Chines,P. S., Jackson,A. U., Prokunina-Olsson,L., Ding,C., Swift,A. J., Narisu,N., Hu,T., Pruim,R., Xiao,R., Li,X., Conneely,K. N., Riebow,N. L., Sprau,A. G., Tong,M., White,P. P., Hetrick,K. N., Barnhart,M. W., Bark,C. W., Goldstein,J. L., Watkins,L., Xiang,F., Saramies,J., Buchanan,T. A., Watanabe,R. M., Valle,T. T.,
Kinnunen,L., Abecasis,G. R., Pugh,E. W., Doheny,K. F., Bergman,R. N., Tuomilehto,J., Collins,F. S., and Boehnke,M. (2007). A Genome-Wide Association Study of Type 2 Diabetes in Finns Detects Multiple Susceptibility Variants. Science 316 (5829) 1341-1345. Shao,H., Burrage,L. C., Sinasac,D. S., Hill,A. E., Ernest,S. R., O'Brien,W., Courtland,H., Jepsen,K. J., Kirby,A., Kulbokas,E. J., Daly,M. J., Broman,K. W., Lander,E. S., and
Nadeau,J. H. (2008). Genetic Architecture of Complex Traits: Large Phenotypic Effects and Pervasive Epistasis. Proc.Nat.Acad.Sci. 105 (50) 19910-19914.
Sinnott-Armstrong,N. A., Greene,C. S., Cancare,F., and Moore,J. H. (2009). Accelerating Epistasis Analysis in Human Genetics with Consumer Graphics Hardware. BMC Res.Notes 2 149.
The International Hapmap Consortium. (2005). A Haplotype Map of the Human Genome. Nature 437 (7063) 1299-1320.
Thomas,D. (2010). Gene-Environment-Wide Association Studies: Emerging Approaches. Nat.Rev.Genet. 11 (4) 259-272.
Tian,C., Gregersen,P. K., and Seldin,M. F. (2008). Accounting for Ancestry: Population Substructure and Genome-Wide Association Studies. Hum.Mol.Genet. 17 (R2) R143-R150. Tsai,C., Lai,L., Lin,J., Chiang,F., Hwang,J., Ritchie,M. D., Moore,J. H., Hsu,K., Tseng,C., Liau,C., and Tseng,Y. (2004). Renin-Angiotensin System Gene Polymorphisms and Atrial Fibrillation. Circulation 109 (13) 1640-1646.
Velez,D. R., White,B. C., Motsinger,A. A., Bush,W. S., Ritchie,M. D., Williams,S. M., and Moore,J. H. (2007). A Balanced Accuracy Function for Epistasis Modeling in Imbalanced Datasets using Multifactor Dimensionality Reduction. Genet.Epidemiol. 31 (4) 306-315. Wade,M. J. (2001). Epistasis, Complex Traits, and Mapping Genes. Genetica 112-113 (1) 59-69.
Wahlsten,D. (1990). Insensitivity of the Analysis of Variance to heredity-environment Interaction. Behav.Brain Sci. 13 (1) 109-161.
Wang,Y., Liu,G., Feng,M., and Wong,L. (2011). An Empirical Comparison of several Recent Epistatic Interaction Detection Methods. Bioinformatics 27 (21) 2936-2943
Weatherall,D. J. (2001). Phenotype-Genotype Relationships in Monogenic Disease: Lessons from the Thalassaemias. Nat.Rev.Genet. 2 (4) 245-255.
Weiss, K. M. 1995. Genetic Variation and Human Disease: Principles and Evolutionary Approaches. New York: Cambridge University Press.
CHAPTER 2
Multifactor Dimensionality Reduction as a Filter-Based Approach for Genome Wide Association Studies
Noffisat O. Oki1 and Alison A. Motsinger-Reif1,2*
1 Bioinformatics Research Center, North Carolina State University, Raleigh, NC, USA 2 Department of Statistics, North Carolina State University, Raleigh, NC, USA
*Correspondence: Alison A. Motsinger-Reif, Department of Statistics, Bioinformatics Research Center, North Carolina State University, 840 Main Campus Drive, CB 7566, Raleigh, NC 27695-7566, USA. e-mail: motsinger@stat.ncsu.edu
Abstract
Advances in genotyping technology and the multitude of genetic data available now provide a vast amount of data that is proving to be useful in the quest for a better
understanding of human genetic diseases through the study of genetic variation. This has led to the development of approaches such as genome wide association studies (GWAS)
designed specifically for interrogating variants across the genome for association with disease, typically by testing single locus, univariate associations. More recently it has been accepted that epistatic (interaction) effects may also be great contributors to these genetic effects, and GWAS methods are now being applied to find epistatic effects. The challenge for these methods still remain in prioritization and interpretation of results, as it has also become standard for initial findings to be independently investigated in replication cohorts or
functional studies. This is motivating the development and implementation of filter-based approaches to prioritize variants found to be significant in a discovery stage for follow-up for replication. Such filters must be able to detect both univariate and interactive effects. In the current study we present and evaluate the use of multifactor dimensionality reduction (MDR) as such a filter, with simulated data and a wide range of effect sizes. Additionally, we
compare the performance of the MDR filter to a similar filter approach using logistic regression (LR), the more traditional approach used in GWAS analysis, as well as
LR for various two-locus epistatic models, while it has equivalent results as EC for the epistatic models. The results of this study demonstrate the potential of MDR as a filter to detect gene–gene interactions in genome wide association studies.
Introduction
signals has prompted the use of a replication sample as a standard in the study designs of GWAS (Moore and Williams 2002; Calle 2008; Kraft 2009), highlighting the need to be able to investigate potential interactions in the discovery stage of GWAS, which could then be further evaluated in replication sample(s).
In order to find the most promising candidates for replication, a broad number of methods have been developed, using a range of variable selection and statistical modeling techniques (Hoh and Ott 2003; Culverhouse 2007; Brinza 2010). While the majority of these approaches have been applied to candidate gene studies, the potential of a few methods have been investigated at a genome-wide level (Brinza 2010). Encouragingly, using traditional logistic regression (LR) analysis with a multistage approach has been evaluated in simulation studies, with the general conclusion that even after correcting for the large number of tests associated with searches for interactions in high-throughput data, there is high power to detect interactions (Burton 2007).
second approach will only be able to detect interactions with at least one-locus having a significant main effect, but will fail to detect purely epistatic effects (interactions with no marginal effects). The third approach will only be able to detect interactions with no main effects and will fail to characterize interactions with marginal effects. More recently, the idea of using filters that incorporate some prior biological knowledge such as biochemical
pathways in order to limit the subset of variants considered in the initial analysis or as a means of prioritizing results have started to gain traction (Moskvina 2011; Ritchie 2011), and are being used in some combination with the filtering approaches mentioned above. The specific performance characteristics of these approaches motivate the use of a method that can inclusively detect interactions with a range of stringency: a method needs to filter both purely epistatic effects, and main effects with interactions. Multifactor dimensionality reduction (MDR) is a highly successful method that was designed to detect gene–gene and gene–environment effects, and is capable of detecting a wide range of epistatic models (Ritchie 2001; Hahn 2003). It has shown high power to detect a range of effect sizes and genetic models in a broad range of simulation studies (Ritchie 2003; Motsinger and Ritchie 2006; He 2009) and real data applications (Ritchie 2001; Park 2007). The main limitation to the application of MDR to GWAS was originally computation time (since it uses an
exhaustive combinatoric search approach), but recent parallel applications and GPU implementations (Greene 2010) make this a reasonable approach to investigate two-locus interactions in genome-wide association studies.
the commonality of two-stage study designs, with the use of discovery and replication cohorts to identify and then replicate models, we evaluate the potential of MDR as a filter-based approach, using MDR modeling to evaluate and rank all univariate effects and two-locus epistatic effects. We compare the use of MDR as a filter approach, to evaporative cooling (EC), another machine learning filtering method (McKinney 2009), which we use in conjunction with the Genetic Association Interaction Network (GAIN) first proposed by McGill (1954) to find multivariate epistatic models. We also compare our approach to a more traditional filter approach using LR modeling, the de facto standard in genetic association studies. We compare these approaches in simulations with a range of genetic main effects and interaction effects, and show the better performance of MDR for filtering gene–gene interactions.
Materials and Methods
were tested, and all possible interactions effects were also analyzed for the two-locus models. For each distinct model the marginal locus or multi-locus combinations (for two-locus
models) were then ranked according to classification error (for MDR), p-values (for LR) and significance scores (for GAIN) separately. Additionally, error rates were calculated for the two-locus interactions analyzed with MDR to assess the false positive rates and reliability of our filter.
Data Simulations
Three types of disease models (one-locus main effect, two-locus epistatic effects, and two-locus models with joint epistatic and main effects) were simulated to include the disease causing SNP or SNPs for main effects and interaction effects. All simulations were done assuming SNPs are biallelic. All the models were simulated with specific penetrance functions (where the penetrance is the risk of disease given a genotype) to reflect the “odds ratios” and heritabilities desired. For the single locus models, a classical definition of an odds ratio was used. The odds ratios were calculated as the ratio of the odds of being affected to the odds of being unaffected, with the reference allele being the minor allele, e.g., for the dominance model and minor allele “A” the odds ratio is calculated by
((oddsAA + oddsAa) /2) / oddsaa Affected Unaffected
The GenomeSim software (Dudek, 2006) package was used for all data simulations. A null model with no disease causing SNP was also simulated to be used for assessing the false positive rates of the filter. While our study involves relatively small datasets, other studies have shown that the results of large genome-wide association studies analyzed with MDR are highly consistent, regardless of the number of noise SNPs simulated (Edwards, 2009), so our results hopefully should also apply to GWAS data. Unfortunately,
computational limitations prevent a large-scale simulation experiment with extremely large numbers of SNPs (at a true GWAS level).
One-locus main effect models
We simulated additive, recessive and dominant genetic effects for the main effects models. Odds ratios for the simulations ranged from 1.2 to 3.0 and heritabilities of 1 and 5%, as well as minor allele frequencies of 0.2 and 0.4 for the disease causing SNP. The
process created a combined total of 4,800 datasets of one-locus (univariate) models (1,600 within each inheritance mode).
Two-locus interaction (epistatic) models
We simulated a total of 16 two-locus epistatic models, with each model having a distinct penetrance function used for its dataset simulation. The penetrance functions were generated with “odds ratios” ranging from 1.2 to 3.0 (in increments of 0.2), heritabilities close to 1 and 5%, and minor allele frequencies of 0.2 and 0.4 for the disease causing SNPs separately (shown in Tables A4 and A5 in Appendix A). This resulted in two sets of two-locus models, one with minor allele frequencies of 0.2 and the other with 0.4. Penetrance functions, with purely epistatic effects (with no marginal main effects for either SNP) were found using a genetic algorithm implemented in the SimPen software (Moore 2002). SimPen uses a genetic algorithm that minimizes marginal penetrance variance to find penetrance functions with minimal to no main effects. The program accepts specified user parameters including heritability, “odds ratio,” marginal penetrance, allele frequency, etc., and gives the function with the best fitness. For each penetrance model 100 replicate datasets were
simulated, with each dataset having 250 cases, 250 controls, and 100 independent SNPs (no recombination or LD between SNPs). This process created a total of 1,600 two-locus datasets.
Two-locus models with main effects
an individual is affected if they are homozygous for the disease allele (in this case the minor allele) from the main effect locus regardless of what alleles they carry at the second locus, or if they are heterozygous at the main effect locus and heterozygous or homozygous for the minor allele at the secondary locus. As with the purely epistatic models, two sets of disease models were simulated, one with minor allele frequency of 0.2 and the other with 0.4. Each set had eight models for a total of 16 models, with 100 replicates within each model. As with previous models, the penetrance functions were estimated with “odds ratios” varying from 1.2 to 3.0 (in increments of 0.2), but with heritabilities ranging from 0.02 to 8.4% using the modifying effect model as a template (Table A6 in Appendix A). There were 100 replicate datasets for each model, each with 250 cases, 250 controls, and 100 SNPs per dataset, which were also independent (no recombination or LD between SNPs).
Null model
In addition to the disease model simulations, a null model was also simulated, with 100 replicate datasets having 250 cases, 250 controls, and 100 independent SNPs. The model was simulated with no penetrance function or heritability, as well as no main or interaction effect loci, such that all loci are noise loci with no disease status association.
Data Analysis
Multifactor dimensionality reduction
our filter implementation we saved and ranked all models (as opposed to selecting the top single model as traditionally done). For the one-locus models this yields 100 possible main effects for each replicate within each model and 4,950 two-way models within each replicate for the two-locus interaction models. For each locus within each dataset a contingency table (1 by 3 for one-locus and 3 by 3 for two-way interactions) of all possible genotypes for that locus/locus combination is made and the number of cases and controls within each cell in the table (genotype combination) is counted. The ratio of cases to controls is taken and compared to a threshold, which was set to 1 as is the standard for MDR when using balanced data where there are an equal number of cases and controls (Velez 2007). Each cell was then classified as high-risk if the ratio is greater than 1 and low-risk if less than 1. The
classification error for each model is based on the number cases in cells that were classified as low-risk and the number of controls in those that were classified as high-risk. Figure 1 illustrates the MDR method for two-locus combinations. The classification error of each model was used to rank the models, where lower error was given a better rank (with a rank of 1 representing the top model).
Logistic regression
parameters for the dummy encoding), where lower p-values resulted in higher ranks. For testing the two-locus interaction models, terms for each dummy variable were entered as terms in the model, and terms for the interaction effects of each combination of variables were also entered.
The specific LR model used for the two-locus models is: log[y/(1-y)] = α + β1x1i + β2xij + β3x2i + β4x2j +β5x1ix2i
+ β6x1ix2j + β7x1jx2i + β8x1jx2j + e where: y = 1 if case; 0 if control.
α = intercept.
β1 = main effect of SNP 1, dummy variable i. β2 = main effect of SNP 1, dummy variable j. β3 = main effect of SNP 2, dummy variable i. β4 = main effect of SNP 2, dummy variable j.
β5–8 = interaction effects of the dummy encoded variables of SNPs 1 and 2.
This model was applied to all SNP pairs and the SNP pairs were then ranked based on the most significant p-values. The p-values were from the joint test of the overall LR model. The two-locus LR analysis was implemented in R software package version 2.8.12
Evaporative cooling
The EC algorithm is motivated by the statistics of the thermodynamic process of cooling a gas through evaporation (Hess 1986), and was adapted by McKinney et al. (2007) for selection of variants involved in interactions. It is based on a linear combination
(RF; Breiman 2001), and it works by integrating and optimizing the importance scores from Relief-F and RF in order to find the most relevant variants to the phenotype.
In brief, it optimizes F = E − TS, where (F) is the free energy which is analogous to relevance of a group of SNPs to the phenotype (in our study this is case/control status). E is determined by statistical interactions (the Relief-F score). Independent/main effects are S (RF score) and the noise variants are T which are also used as a coupling constant. Since EC is designed to find the SNPs with the highest potential for interaction and not the specific interactions themselves, we expected it to give the main effect SNP a high rank in both the one-locus and two-locus datasets. We use EC to analyze the one-locus models as well as the two-locus models to see if the main effect locus (in the one-locus model) or both the main effect locus and the secondary interacting locus (in the two-locus joint main and interaction effect models) would rise to the top in the rankings, as these would have been the SNPs that may have been considered for further tests of interaction in a real study. We expect that the most significant interaction models would contain the main effect SNP especially for the two-locus joint main and interaction effect models, and as such should rank high in the EC results. The software package provided by the McKinney et al. (2009) was used for this analysis.
Genetic association interaction network
Genetic association interaction network (GAIN) calculates the pair-wise interaction information (I), which quantifies interaction gains between the variants and case/control status. It works based on the following model:
where Ii,j,y = interaction information between SNPs i and j, and the phenotype (case/control) y.
Iij,y = information gained about y when considering loci i and j jointly.
Ii,y = information gained about y when locus i is measured. Ij,y = information gained about y when locus j is measured.
We performed a GAIN search for the two-locus datasets to rank all possible two-way interactions and compare the results to the MDR and LR analysis. The GAIN tool software package was used for this analysis (McKinney 2009).
Ranking filter
For each simulated model, MDR, EC, and LR analysis was performed, using the level of interaction (one or two-way interactions) simulated for each model, and the rank was calculated. The average rank of the simulated model was calculated across the 100 replicates of each model. For the single locus model, the possible ranks ranged from 1 (highest) to 100 (lowest). For the two-locus models, the possible ranks range from 1 (highest) to 4,950 (lowest). The average ranks for the non-causal loci were also calculated across each model for comparative purposes, and to get a feeling for the distribution of ranks expected by chance. These experiments were performed to compare how the “signal” raises out of the “noise” for the two methods.
Power analysis for the MDR filter
very loose filter) to 35% (a more stringent filter). The number of times the classification error score of our disease locus combination, passed through the filter for all 100 replicates was counted and converted to percentage points to estimate power.
False positive rate of the MDR filter
We then estimated the false positive rate of the two-locus epistatic models for the MDR method. To find this rate we calculated the frequency of noise (the non-disease two-locus combinations) passing through the classification error filter. For each replicate within each purely epistatic model the number of non-disease locus combinations that passed through the filter at the six different levels of the filter from 35 (the most stringent) to 45 (a score that could be expected by chance), was counted. The average for each error filter level, within each model was then calculated by averaging over the counts collected from the 100 replicates in that model; these scores were then converted to percentage points.
Large dataset analysis
seen in the simulation experiment might extrapolate to larger data, with a GWAS number of SNPs.
Implementation
Multifactor dimensionality reduction was implemented in C++, the two-locus LR was implemented in R, and the EC and GAIN algorithms are both implemented in JAVA. All simulations and analysis were run on quad-core Core2 Xeon processors (8 processors, each at 3 GHz and with 4 GB of memory). A java implementation of MDR software is publicly available through www.epistatis.org and an R implementation is available through
http://cran.r-project.org/ (Winham and Motsinger-Reif 2010). Java implementations of EC and GAIN were used from software provided by (McKinney 2009).
Results were tested for significance using a mixed model analysis of variance approach. The analysis of variance model used checked for effects of allele frequency, analysis method (MDR, EC, or LR), models (effect sizes), and effect of association between allele frequency and analysis method on ranks. Note that the p-values reported from the ANOVA are raw (uncorrected for multiple comparisons) since these tests are meant to help interpret the results and not meant as strict statistical hypotheses.
Results
One-Locus (Main Effect) Models
The ranking results for the disease causing SNP in the one-locus models based on the MDR, EC, and LR analyses are shown in Figures 2–4, for the dominant, additive, and
the x-axis) for all methods, and for both minor allele frequencies models. As expected, the average rank of the causal locus model improves as the effect sizes increase. There was not a significant difference between the average ranks of LR and MDR for the additive, dominant, or recessive models (p = 0.609, p = 0.748, and p = 0.117 respectively). There was also no significant difference between the MDR and EC results for the dominant and recessive models (p = 0.818 and p = 0.062 respectively), however there was a difference in the results for the recessive model (p = 3.83 × 10⁻⁶). Also, though not shown, the average ranking for the noise loci (non-disease causing) ranged between 45 and 55 on a scale of 1–100 for all models (data not shown).
EC ranks for interacting loci for two-locus models
For the two-locus joint main and interaction effect models, the two disease loci were ranked in the top 20% for the models with “odds ratios” greater than 2.0 (Figure 5). The main effect locus was in the top 20 for 57% of the total models while the second locus was in the top 20 for about 28% of the models. For the purely epistatic models, there was only one model in which EC ranked the 2 interacting loci in the top 20%. The ranks were generally between 40 and 50 for most models in this group (Figure 6).
Two-locus interaction (purely epistatic) models
The results of the rankings for the purely epistatic models are shown in Figure 7. Again the models are ranked in order of increasing effect size on the x-axis. For all 16 epistatic models, the non-disease locus combinations had rankings expected by chance, ranging between 2,000 and 3,000 on a scale of 1–4,950 (not shown). These results
better rankings than LR for most of the models and especially so for the larger effect sizes (p = 3.046 × 10⁻⁸). The comparison between the MDR and GAIN results were better for GAIN when the effect sizes were smaller, but were about the same for both methods when the effect sizes were larger. The analysis of variance showed a significant difference between the two methods (MDR and EC) for this analysis (p = 0.0005). There was also a significant
difference between the rankings for the models with minor allele frequencies of 0.2 and those of 0.4 for the LR method (p = 1.267 × 10⁻⁵) but there was no significant difference between effects of allele frequency on ranks for the MDR and GAIN analysis. The results show a strong trend of improving ranks as effect sizes increases for MDR and GAIN, but it is clear that there is little improvement in rank for the LR results. The average rankings for the models with allele frequency of 0.2, for the LR analysis were not better than what could be expected by chance as they had similar rankings as those for the null model.
Two-locus main effect and interaction models
The ranking results for the two-locus models with significant main effects are shown in Figure 8, again arranged based on effect size of the models simulated. The results are similar to those shown in Figure 5, with MDR having better rankings than LR (p = 4.916 × 10⁻¹¹), and about the same rankings for the comparison with GAIN. The ranking improves as effect size increases, with the MDR and GAIN results. There was again a significant