CENTRAL COMPOSITE DESIGN TO DEVELOP A ROBUST REVERSED-PHASE THIN-LAYER
CHROMATOGRAPHY/DENSITOMETRY METHOD FOR QUANTIFICATION OF PARABENS IN
COSMETIC PREPARATIONS
KAVITHA JAYASEELAN, KARUNANIDHI SANTHANA LAKSHMI*
Department of Pharmaceutical Analysis, SRM College of Pharmacy, SRM University, Kattankulathur, Kancheepuram - 603 203, Tamil Nadu, India. Email: [email protected]
Received: 23 May 2017, Revised and Accepted: 28 June 2017 ABSTRACT
Objective: The current study was framed with a view to develop a simple, sensitive and a rapid reversed-phase thin-layer chromatography (RP-TLC)/ densitometry method for quantification of parabens (methyl, ethyl, propyl, and butyl) in various cosmetic preparations available in local market. Moreover, robustness testing was planned to be performed applying a central composite design (CCD).
Methods: The desired chromatographic separation was achieved on RP-TLC/densitometry plates precoated with Silica gel 60 GF254 on aluminum sheet,
employing methanol:toluene:acetonitrile:glacial acetic acid as mobile phase in the ratio of 3:5:1.8:0.2 v/v/v/v and detection was carried out at 256 nm.
Results: The mobile phase used gave an excellent resolution of all the four separated parabens. The method was found linear over a wide range of 6.25-400 ng/spot. The optimized method was validated by measuring various validation parameters. CCD was employed to check the robustness of the method at three-factor levels. The developed and optimized method was used to quantify parabens in 30 different cosmetic products procured from local market.
Conclusion: The proposed and developed RP-TLC/densitometry method can be applied for routine analysis of all the parabens in cosmetic products and can also be extended to the analysis in pharmaceuticals and food products.
Keywords: Central composite design, Cosmetic preparations, Parabens, Reversed-phase thin-layer chromatography/densitometry, Validation.
INTRODUCTION
Cosmetics are products people use to cleanse or change the look of the face or body, and they have become the need of society. Today, makeup plays a key role for both men and women everywhere. There are many ingredients loading in the cosmetics products; parabens (methyl, ethyl, propyl, and butyl) are one of the important ingredients loaded in most of the cosmetic products, as preservatives due to its excellent antimicrobial property and low toxicity [1]. However, recent study shreds of evidence that parabens may not be as safe as initially thought, and suggest that, they have a potential estrogenic effect on animals and human reproductive system [2-5]. On the other hand, none of the cosmetic product contains a proper label claim of these ingredients in their cover; hence, the need for quantifying these harmful ingredients in cosmetics has been put forth.
Recently, reversed-phase thin-layer chromatography (RP-TLC)/ densitometry method is widely employed for the quantification of drugs because it has several advantages over liquid chromatographic methods such as low maintenance cost, short run time, low mobile phase consumption per sample, and multiple/repeated scanning of chromatograms [6]. Added to the above, it facilitates automated application of sample and scanning of the plate. Moreover, it is flexible enough to analyze different kinds of samples [7].
The design of experiments is based on the principles of use of experimental design. Experimental design procedures are very useful in pharmaceutical development including formulation development, analytical method optimization, and validation. They are more efficient than the traditional one-variable-at-a-time approach [8]. In this study, CCD is chosen as the best experimental design due to its flexibility and can be applied to optimize chromatographic conditions by gaining a better understanding of factor’s and their interaction effects [9].
The literature collected reveals that there are many analytical methods reported of the estimation of parabens alone and together with other drugs or excipients by high-performance liquid chromatography (HPLC), ultra performance liquid chromatography, capillary electrophoresis and gas chromatography mass spectrometry in cosmetics, pharmaceuticals, and environmental samples [10-15].
The current research article focuses on the determination of robustness of RP-TLC/densitometry analytical method by CCD and simultaneous quantification of four parabens in cosmetic products.
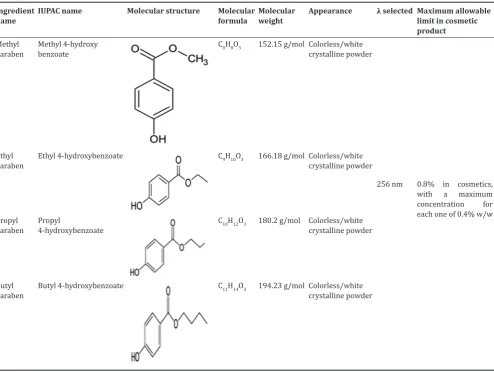
Hence, a modest, rapid, accurate, precise, sensitive, robust and more economical RP-TLC/densitometry method, with simple sample preparation technique was developed for the simultaneous estimation and quantification of methyl, ethyl, propyl, and butyl parabens in various cosmetic preparations, with the aid of CCD design for robustness testing. The general properties of methyl, ethyl, propyl, and butyl parabens are listed in Table 1.
EXPERIMENTAL
Chemicals and reagents employed
The reference standard of methyl, ethyl, propyl, and butyl parabens are purchased from Sigma-Aldrich (India). All other reagents used in the study were procured from Merck Laboratories and S.D. Fine Chemicals Ltd. Double distilled water was utilized throughout the process of analysis. All the cosmetic products analyzed were purchased from local markets of Chennai.
Instrumentation
The RP-TLC/densitometry instrument used consisted of the following components: Camag Sample Applicator – Linomat5, Twin trough Chamber, Camag Scanner, and Camag Document photo. The other apparatus employed for the study includes - digital balance Sartorius, © 2017 The Authors. Published by Innovare Academic Sciences Pvt Ltd. This is an open access article under the CC BY license (http://creativecommons. org/licenses/by/4. 0/) DOI: http://dx.doi.org/10.22159/ajpcr.2017.v10i10.20160
ultrasonic bath sonicator, centrifuge, and vortexer. Throughout the analysis, all the dilutions were performed employing Class “A” grade glassware’s only.
Software’s employed
WINCATS 5 (Software for handling RP-TLC/densitometry instrument) was employed. Experimental design, data analysis, and desirability function calculations were performed using Design-Expert® trial
version 7.1.6 (Stat-Ease Inc., Minneapolis) and MS- Excel 2010.
Preparation of stock standard solutions
A stock solution containing 1 mg/ml was prepared by dissolving 50 mg of parabens, in 50 ml of methanol, individually and in combination. The stock solution was diluted with methanol for further analysis.
Chromatographic development
Based on various trials carried out, the following chromatographic conditions were selected for validation. The optimum separation was achieved using Camag RP-TLC/densitometry instrument. Camag Twin through glass chamber (20×10) was used for the development which was saturated for 30 minutes with the vapors of methanol:toluene:acetonitrile:glacial acetic acid as mobile phase in the ratio of (3:5:1.8:0.2 v/v/v/v). Linomat V with Camag 100 µl syringe was used to spot 1 µl of the prepared standard, and spiked sample on RP-TLC/densitometry plates (Merck) precoated with Silica gel 60 GF254 on aluminum sheets, dried and subjected to development
at ambient temperature. The developed plates were scanned using Camag TLC scanner III at 256 nm and quantified employing WINCAT Software.
Extraction of parabens from cosmetic preparations
About 30 cosmetic products (including shampoo, soap, toothpaste, cream, and shaving cream) were procured. 5 g of cosmetic preparations were accurately weighed into 20 ml centrifuge tube. 10 ml of methanol was added and mixed for 5 minutes. The mixture was extracted in an ultrasonic bath for 30 minutes. The extract was centrifuged for 10 minutes at 4000 rpm. The supernatant was removed, and further 10 ml of methanol was added to the residue and extraction was carried second time in the same manner. The two supernatants were combined, and the final volume was made up to 25 ml with methanol. The above solution was mixed well and filtered through 0.22 µm Millipore membrane filter. The resultant solution was utilized for further analysis.
Method validation
Linearity
Concentrations of 6.25, 12.5, 25, 50, 100, 200, and 400 ng/spot for all the parabens individually versus their respective peak areas were subjected to linear regression equation to calculate regression and correlation coefficient data.
Precision
Intra- and inter-day precision studies were conducted by spotting the mixed working standard solution containing 50 µg/ml of all the parabens and estimating the concentration response 6 times on the same day and three different days.
Accuracy
The ingredients of known concentrations (at three concentration levels of 6.25, 50, and 400 µg/ml in triplicate) were added into the
Table 1: General properties of methyl, ethyl, propyl, and butyl parabens Ingredient
name IUPAC name Molecular structure Molecular formula Molecular weight Appearance λ selected Maximum allowable limit in cosmetic product
Methyl
paraben Methyl 4-hydroxy benzoate C8H8O3 152.15 g/mol Colorless/white crystalline powder
256 nm 0.8% in cosmetics, with a maximum concentration for each one of 0.4% w/w Ethyl
paraben Ethyl 4-hydroxybenzoate C9H10O3 166.18 g/mol Colorless/white crystalline powder
Propyl
paraben Propyl 4-hydroxybenzoate C10H12O3 180.2 g/mol Colorless/white crystalline powder
Butyl
corresponding blank cosmetic product, and 1 µl was spotted for analysis after the same procedure carried out under the extraction of parabens from cosmetic products. The percentage recovery was calculated from the average peak area ratio of sample to the standard.
Robustness
A total of 20 experiments with six center points were conducted by selection of three factors, methanol content in mobile phase (A), developing distance (B), and spot size (C) and retention factor was selected as the response for the four parabens at the levels described in Table 2. The nominal value of all these three factors A, B, and C was 3 ml, 8 cm, and 5 mm, respectively. Statistical analysis of ANOVA was performed using Design Expert (Version 7.1.6 Stat-Ease Inc) software.
RESULTS AND DISCUSSION
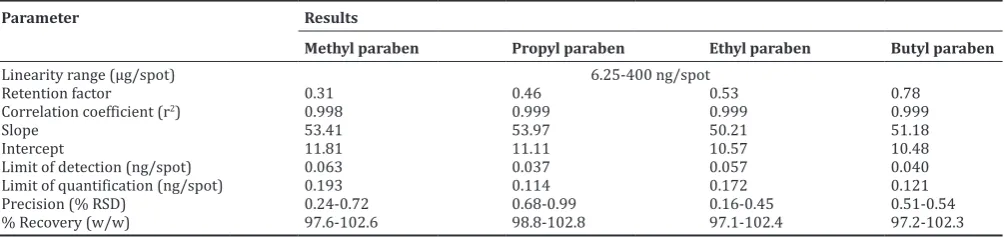
Combinations of solvents in different ratios such as water, methanol, toluene, acetonitrile, chloroform, and ethyl acetate were tried for resolving the peaks of all the four parabens efficiently. Finally, methanol:toluene:acetonitrile:glacial acetic acid in the ratio of 3:5:1.8:0.2 v/v/v/v, gave a well-defined and good resolved peaks for the parabens. Glacial acetic acid was added to improve the peak characteristics. An increase in the volume of methanol made the parabens move toward the solvent front, irrespective of the type of paraben. An addition of toluene made the parabens run at a slower rate and inclusion of acetonitrile resulted in the occurrence of well-defined peaks. The selected mobile phase gave an excellent resolution, and the parabens were eluted at different retention time of about 0.31±0.013, 0.46±0.009, 0.53±0.004, and 0.78±0.009 for methyl, propyl, ethyl, and butyl parabens, respectively, at the detection wavelength of about 256 nm (Fig. 1a and b).
All the four parabens showed a good correlation coefficient value of about 0.998 for methyl paraben and 0.999 for ethyl, propyl, and butyl paraben in the concentration range of 6.25-400 ng/spot for all the parabens, respectively. The limit of detection and limit of
quantification values were found to be 0.063 and 0.193 ng/spot for methyl paraben, 0.037 and 0.114 ng/spot for propyl paraben, 0.057 and 0.172 ng/spot for ethyl paraben, 0.040 and 0.121 ng/spot for butyl paraben, respectively.
Intra- and inter-day precision studies were conducted, and the percentage relative standard deviation was found to be <2%.
The accuracy of the method was performed by standard addition method, at three levels of concentrations in triplicate. The percentage recovery was calculated and was found within the range of 97.0-103.0% w/w for all the parabens, which suggests the suitability of the method to perform routine analysis of any of these parabens.
The data representing overall method validation results were listed in Table 2, indicating acceptable precision concerning repeatability of peak area measurement and sample application.
All the experiments in CCD model were performed in a randomized manner. The results were shown in Table 3.
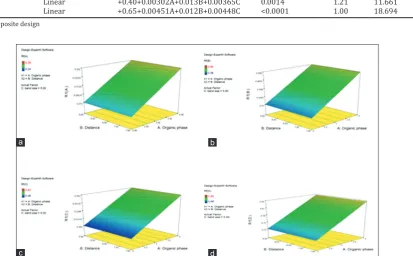
The experimental results obtained were computed. The polynomial equation models for Y for parabens were tabulated in Table 4. To evaluate the effect of factors selected on response (retention factor) of all the parabens, response surface plots were constructed. Fig. 2 depicts that the change in the content of organic phase (methanol content) has the most significant effect on retention factor. Whereas, the other examined factors such as developing distance and bandwidth were not found to have any significant effect on response. Variation in retention factor was observed due to change in the ratio of methanol (increase in methanol content in mobile phase increases the retention factor) content in the mobile phase, which was considered acceptable, as evidence created from the plot and the developed method was reported to be robust.
The content of parabens in 30 different cosmetic preparations procured from the local markets was calculated after extraction. The obtained
Table 2: Overall results of method validation
Parameter Results
Methyl paraben Propyl paraben Ethyl paraben Butyl paraben
Linearity range (µg/spot) 6.25-400 ng/spot
Retention factor 0.31 0.46 0.53 0.78
Correlation coefficient (r2) 0.998 0.999 0.999 0.999
Slope 53.41 53.97 50.21 51.18
Intercept 11.81 11.11 10.57 10.48
Limit of detection (ng/spot) 0.063 0.037 0.057 0.040 Limit of quantification (ng/spot) 0.193 0.114 0.172 0.121 Precision (% RSD) 0.24-0.72 0.68-0.99 0.16-0.45 0.51-0.54 % Recovery (w/w) 97.6-102.6 98.8-102.8 97.1-102.4 97.2-102.3
RSD: Relative standard deviation
Fig. 1: Densitogram of mixed standard solution of parabens (a) and extracted sample - toothpaste 1 (b)
results evidently prove that parabens are commonly loaded in most of the cosmetic products such as shampoo, soap, toothpaste, and creams which were selected for analysis. Out of four parabens analyzed, methyl paraben is predominately found in almost the entire range of cosmetic products taken under investigation, propyl paraben is present in 75 % of the analyzed products, followed by butyl paraben and it was found that, and ethyl paraben was found only in 5 out of 30 products. The concentration predicted was found to be well below the maximum allowable limit in the cosmetic preparations (Fig. 3).
CONCLUSION
A well-validated RP-TLC/densitometry method for routine analysis of parabens in cosmetics products with the aid of CCD for robustness study has been developed. Moreover, the major advantage of RP-TLC/densitometry method is that several components can be run simultaneously, and quantification of compounds can be carried out using minimal analysis time, using small amount of mobile phase and need for minimum sample clean-up procedure unlike HPLC, and other
Table 3: Design of CCD and their response Run A - Organic
phase (ml) distance (cm)B - Developing C - Spot size (mm) Rparabenf of methyl parabenRf of propyl Rparabenf of ethyl Rparabenf of butyl
1 3.00 8.00 5.00 0.31 0.46 0.53 0.78
2 2.00 7.00 6.00 0.28 0.41 0.50 0.72
3 4.00 9.00 4.00 0.35 0.50 0.59 0.83
4 2.00 9.00 4.00 0.28 0.41 0.5 0.72
5 3.00 8.00 6.68 0.31 0.46 0.53 0.78
6 4.00 7.00 4.00 0.35 0.5 0.59 0.83
7 3.00 8.00 5.00 0.31 0.46 0.53 0.78
8 3.00 8.00 5.00 0.31 0.46 0.53 0.78
9 1.32 8.00 5.00 0.24 0.38 0.48 0.68
10 3.00 9.68 5.00 0.31 0.46 0.53 0.78
11 2.00 9.00 6.00 0.28 0.41 0.50 0.72
12 4.00 9.00 6.00 0.35 0.50 0.59 0.83
13 4.68 8.00 5.00 0.39 0.56 0.63 0.89
14 4.00 7.00 6.00 0.35 0.50 0.59 0.83
15 3.00 8.00 5.00 0.31 0.46 0.53 0.78
16 3.00 8.00 5.00 0.31 0.46 0.53 0.78
17 2.00 7.00 4.00 0.28 0.41 0.50 0.72
18 3.00 8.00 3.32 0.31 0.46 0.53 0.78
19 3.00 6.32 5.00 0.31 0.46 0.53 0.78
20 3.00 8.00 5.00 0.31 0.46 0.53 0.78
CCD: Central composite design
Table 4: Predicted response models and statistical parameters obtained from ANOVA for CCD
Response (Rf value) Type of model Polynomial equation model for Y Model p value %CV Adequate precision Methyl paraben Linear +0.21+0.00210A+0.011B+0.00121C <0.0001 1.06 17.92
Propyl paraben Linear +0.34+0.00245A+0.012B+0.00334C 0.0013 2.01 21.124 Ethyl paraben Linear +0.40+0.00302A+0.013B+0.00365C 0.0014 1.21 11.661 Butyl paraben Linear +0.65+0.00451A+0.012B+0.00448C <0.0001 1.00 18.694
CCD: Central composite design
Fig. 2: Three-dimensional plots of the response surface methodology for Rf value of methyl paraben (a), propyl paraben (b), ethyl paraben (c), and butyl paraben (d)
d c
advanced analytical techniques with low maintenance cost per analysis adds up credit to this study. The application of CCD on robustness was to examine the variation of different factors simultaneously on the selected response. The robustness study conducted employing CCD, evidence that the change in methanol content in total mobile phase appeared to have a significant effect on the response (retention factor), compared to the other two factors such as development distance and spot size selected for the study. Hence, it was important that the significant factor (methanol content in mobile phase) be carefully controlled. It was concluded that the use of experimental design and response surface methodology is a flexible procedure and can be employed to reduce the number of required experiments for robustness study for the developed RP-TLC/densitometry method. Finally, the developed and validated method allows easy quantification of the selected four parabens in various marketed cosmetic preparations, which was found to be well within the maximum allowable limits for cosmetics laid by FDA regulations. The method was found to be suitable and repeatable for routine quality control analysis of parabens in cosmetic, food, and pharmaceutical products.
ACKNOWLEDGMENT
The authors are grateful to the management of SRM College of Pharmacy, SRM University, for providing necessary facilities to carry out this research work successfully.
REFERENCES
1. Haag T, Loncrini DF. Esters of para-hydroxybenzoic acid. Cosmet Sci Technol Serv 1984;1:63-77.
2. Vo TT, Yoo YM, Choi KC, Jeung EB. Potential estrogenic effect(s) of parabens at the prepubertal stage of a postnatal female rat model. Reprod Toxicol 2010;29(3):306-16.
3. Boberg J, Taxvig C, Christiansen S, Hass U. Possible endocrine disrupting effects of parabens and their metabolites. Reprod Toxicol 2010;30(2):301-12.
4. Oishi S. Effects of propyl paraben on the male reproductive system. Food Chem Toxicol 2002;40(12):1807-13.
5. Oishi S. Effects of butyl paraben on the male reproductive system in mice. Arch Toxicol 2002;76(7):423-9.
6. Ambekar AM, Kuchekar BS. Application of a validated stability-indicating HPTLC method for simultaneous quantitative determination of candesartan cilexetil and hydrochlorothiazide in pharmaceutical dosage form. Int J Pharm Pharm Sci 2016;8(5):151-7.
7. Kaul N, Agrawal H, Paradkar AR, Mahadik KR. HPTLC method for determination of nevirapine in pharmaceutical dosage form. Talanta 2004;62(4):843-52.
8. Swarbrick J. Encyclopedia of Pharmaceutical Technology. 1st ed.,
Vol. 1. London, UK: Informa Healthcare Inc.; 2007. p. 2452-67. 9. Ravichandiran V, Sumithra M. Application of quality by design (CCD
technique) for simultaneous estimation of cefixime and ofloxacin by HPTLC method. Int J Pharm Pharm Sci 2016;8(7):200-28.
10. Uysal UD, Guray T. Determination of parabens in pharmaceutical and cosmetic products by capillary electrophoresis. J Anal Chem 2008;63:982-6.
11. Noguera-Orti JF, Villanueva-Camanas RM, Ramis-Ramos G. Determination of parabens in cosmetics without previous extraction by micellar liquid chromatography. J Chromatogr Sci 1999;37:83-7. 12. Lokhnauth JK, Snow NH. Determination of parabens in pharmaceutical
formulations by solid-phase microextraction-ion mobility spectrometry. Anal Chem 2005;77(18):5938-46.
13. Hao YS, Hai LJ, Hong LM, Gang P, Lu Z, Yun FC. Simultaneous determination of seven phthalates and four parabens in cosmetic products using HPLC-DAD and GC-MS methods. J Sep Sci 2007;30:48-54.
14. Grosa G, Del Grosso E, Russo R, Allegrone G. Simultaneous, stability indicating, HPLC-DAD determination of guaifenesin and methyl and propyl-parabens in cough syrup. J Pharm Biomed Anal 2006;41(3):798-803.
15. Canosa P, Perez-Palacios D, Garrido-Lopez A, Tena MT, Rodriguez I, RubI E, et al. Pressurized liquid extraction with in-cell clean-up followed by gas chromatography-tandem mass spectrometry for the selective determination of parabens and triclosan in indoor dust. J Chromatogr A 2007;1161:105-12.
Methyl Paraben Ethyl Paraben Propyl Paraben Butyl paraben