R E S E A R C H
Open Access
An efficient cluster-based power saving scheme
for wireless sensor networks
Jau-Yang Chang
*and Pei-Hao Ju
Abstract
In this article, efficient power saving scheme and corresponding algorithm must be developed and designed in order to provide reasonable energy consumption and to improve the network lifetime for wireless sensor network systems. The cluster-based technique is one of the approaches to reduce energy consumption in wireless sensor networks. In this article, we propose a saving energy clustering algorithm to provide efficient energy consumption in such networks. The main idea of this article is to reduce data transmission distance of sensor nodes in wireless sensor networks by using the uniform cluster concepts. In order to make an ideal distribution for sensor node clusters, we calculate the average distance between the sensor nodes and take into account the residual energy for selecting the appropriate cluster head nodes. The lifetime of wireless sensor networks is extended by using the uniform cluster location and balancing the network loading among the clusters. Simulation results indicate the superior performance of our proposed algorithm to strike the appropriate performance in the energy consumption and network lifetime for the wireless sensor networks.
Keywords:cluster, distance, power consumption, lifetime, sensor networks
1. Introduction
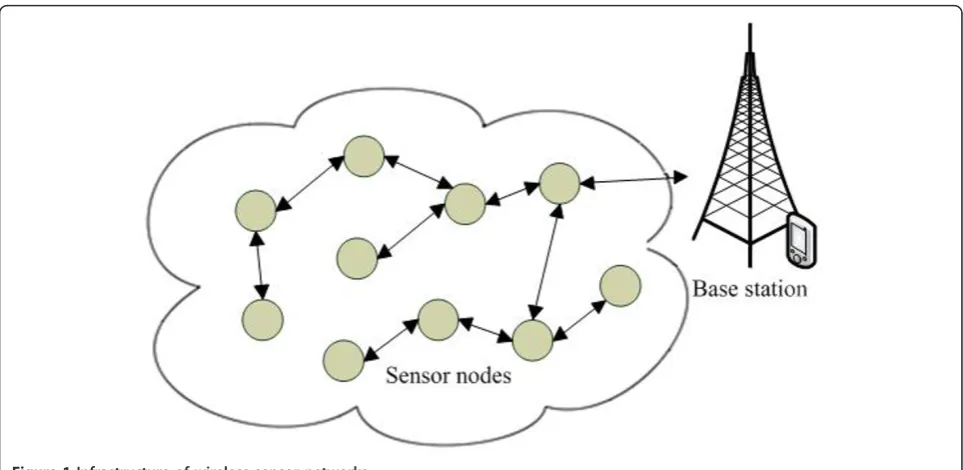
Recently, there has been a rapid growth in the wireless communication technique. Inexpensive and low-power wireless micro-sensors are designed and widely used in wireless and mobile environments [1-3]. A wireless sen-sor network consists of a large number of sensen-sor nodes. Each sensor node has sensing, computing, and wireless communication capability. All sensor nodes play the role of an event detector and the data router. Sensor nodes are deployed in the sensing area to monitor speci-fic targets and collect data. Then, the sensor nodes send the data to sink or base station (BS) by using the wire-less transmission technique. Wirewire-less sensor networks have been pervasive in various applications including health care system, battlefield surveillance system, envir-onment monitoring system, and so on. Figure 1 shows an infrastructure of wireless sensor networks. Power saving is one of the most important features for the sen-sor nodes to extend their lifetime in wireless sensen-sor net-works. A sensor node consumes mostly its energy in transmitting and receiving packets. In wireless sensor
networks, the main power supply of the sensor node is battery. However, in most application scenarios, users are usually difficult to reach the location of sensor nodes. Due to a large number of sensor nodes, the replacement of batteries might be impossible. However, the battery energy is finite in a sensor node and a sensor node draining of its battery may make sensing area uncovered. Hence, the energy conservation becomes a critical concern in wireless sensor networks. In order to increase energy efficiency and extend the network life-time, new and efficient power saving algorithms must be developed [4-6].
Low Energy Adaptive Clustering Hierarchy (LEACH) is a typical cluster-based protocol using a distributed clustering formation algorithm [5]. In LEACH, the large number of sensor nodes will be divided into several clusters. For each cluster, a sensor node is selected as a cluster head. The selection of cluster head nodes is based on a predetermined probability. Other non-cluster head nodes choose the nearest cluster to join by receiv-ing the strength of the advertisement message from the cluster head nodes. A non-cluster head node can only monitor the environment and send data to its cluster head node. The cluster head node is responsible for * Correspondence: [email protected]
Department of Computer Science and Information Engineering, National Formosa University, Hu-Wei, Yun-Lin, Taiwan
Chang and JuEURASIP Journal on Wireless Communications and Networking2012,2012:172 http://jwcn.eurasipjournals.com/content/2012/1/172
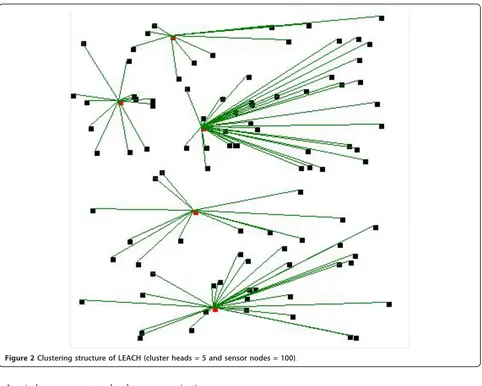
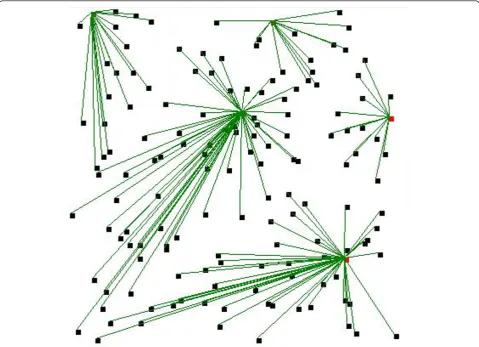
collecting the information of non-cluster head nodes in the cluster. Then, it processes data and sends data to the BS. As a non-cluster head node cannot send data directly to the BS, the data transmission distance of the sensor node is shrunk. Therefore, the energy consump-tion is reduced in the wireless sensor networks. How-ever, the random selection of the cluster head node may obtain a poor clustering setup, and cluster head nodes may be redundant for some rounds of operation. The distribution of cluster head nodes is not uniform, thus some sensor nodes have to transfer data through a longer distance and the reasonable energy saving is not obtained in wireless sensor networks. LEACH-centra-lized (LEACH-C) is proposed as an improvement of LEACH which uses a centralized clustering algorithm to create the clusters [6]. In LEACH-C, the BS collects the information of the position and energy level from all sensor nodes in the networks. Based on this informa-tion, the BS calculates the number of cluster head nodes and configures the network into clusters. In [7], the authors propose the hybrid, energy-efficient, distributed (HEED) clustering protocol to prolong the network life-time and support scalable data aggregation. In this pro-tocol, the cluster heads are probabilistically selected based on their residual energy and the sensor nodes join the clusters according to their power level. The cluster-based power saving methods have been proposed in [8-11], which have been validated to some extent through simulation. However, the critical problem is that the cluster size is also not uniform in these schemes. The energy consumption cannot improve effectively. Figures 2 and 3 show the extreme cases of
clustering structure for a certain round in the simulation by using LEACH.
In this article, we propose a saving energy clustering algorithm (SECA) to provide efficient energy consump-tion in wireless sensor networks. In order to make an ideal distribution for sensor node clusters, we calculate the average distance between the sensor nodes and take into account the residual energy for selecting the appro-priate cluster head nodes. The lifetime of wireless sensor networks is extended by using the uniform cluster loca-tion and balancing the network loading among the clus-ters. The main benefits of proposed scheme are that the energy consumption is reduced and better network life-time can be carried out.
The rest of this article is organized as follow. In Sec-tion 2, we present the system model of wireless sensor networks. In Section 3, we illustrate the proposed scheme in detail. In Section 4, we present our simula-tion model and analyze the comparative evaluasimula-tion results of the proposed scheme through simulations. Finally, some conclusions are given in Section 5.
2. System model
The system infrastructure is composed of a BS and some sensor nodes. We classify all sensor nodes into non-cluster head nodes and cluster head nodes. The non-cluster head nodes operate in sensing mode to monitor the environment information and transmit data to the cluster head node. Also, the sensor node becomes a cluster head to gather data, compresses it and for-wards to the BS in cluster head mode. The system fra-mework of this article is shown in Figure 1.
In wireless sensor networks, data communications sume a large amount of energy. The total energy con-sumption consists of the average energy dissipated by data transmission of the non-cluster head nodes and the cluster head nodes. In addition, the energy consumption for data collection and aggregation of cluster head nodes is consid-ered. Figure 4 illustrates the radio energy dissipation model in wireless sensor networks [5-7]. In this model, to exchange anL-bit message between the two sensor nodes, the energy consumption can be calculated by.
ETx(L,d) =Eelec×L+εamp×L, (1)
ERx(L) =Eelec×L, (2)
wheredis the distance between the two sensor nodes, ETx(L, d) is the transmitter energy consumption, and
ERx(L) is the receiver energy consumption.Eelecis the electronics energy consumption per bit in the transmit-ter and receiver sensor nodes. εamp is the amplifier energy consumption in transmitter sensor nodes, which can be calculated by
εamp=
εfs∗d2, whend≤d0
εmp∗d4, whend>d0 ,
(3)
where d0 is a threshold value. If the distancedis less than d0, the free-space propagation model is used. Otherwise, the multipath fading channel model is used.
εfsand εmpare communication energy parameters. Using the previously described in the literature [5,6], theεfsis set as 10 pJ/bit/m2
and εmpis set as 0.0013 pJ/bit/m4. Also, the energy for data aggregation of a cluster head node is set as EDA = 5 nJ/bit/signal and the initial energy of a sensor node is set as Einit = 2 J. Suppose that a non-cluster head nodeNtransmitsLN bits to the BS. Let dN, CHbe the distance between the non-cluster head node Nand its cluster head nodeCH. Let dCH, BS be the distance between the cluster head node CHand the BS. Due to the multi-hop communication, a non-cluster head node only sends data to its non-cluster head node. The residual energy of the non-cluster head node Nis equal toEinit-ETx(LN,dN,CH). In addition, the resi-dual energy of the cluster head nodeCHis equal toEinit - ERx(LN) -EDA- ETx(LN, dCH, BS), because the cluster Figure 2Clustering structure of LEACH (cluster heads = 5 and sensor nodes = 100).
Chang and JuEURASIP Journal on Wireless Communications and Networking2012,2012:172 http://jwcn.eurasipjournals.com/content/2012/1/172
head node must collect and process the information of non-cluster head nodes in the cluster, and then send data to the BS.
It is obvious that the data transmission between sen-sor nodes takes most of the energy consumption in the wireless sensor networks. Taking into account the energy consumption of sensor nodes, the data transmis-sion distance must be reduced and the packets delay should be avoided. Hence, the energy consumption and routing design become an important issue in the wire-less sensor networks.
3. Proposed methods: SECA
In order to increase energy efficiency and extend the lifetime of the sensor nodes in wireless sensor networks, efficient power saving algorithm must be developed and designed. Based on the centralized clustering architec-ture, we propose a SECA to provide efficient energy consumption and better network lifetime in the wireless sensor networks. In the proposed scheme, we assume that the BS receives the information of location and residual energy for each sensor node and the average residual energy can be calculated. When the residual energy of sensor node is higher than the average resi-dual energy, the sensor node becomes a candidate of
Figure 3Clustering structure of LEACH (cluster heads = 5 and sensor nodes = 150).
cluster head. We modifyk-means algorithm to make an ideal distribution for sensor node clusters by using the information of location and residual energy for all sen-sor nodes [12,13]. In this algorithm, the operation includes two phases: set-up and steady-state phases.
3.1. Set-up phase
The main goal of this phase is to create clusters and find cluster head nodes. During the set-up phase, the BS collects the information of the position and energy level from all sensor nodes in the networks. Based on the characteristics of stationary sensor nodes, the suitable initial means of points for clusters can be obtained. Let C be the center location for all sensor nodes. If there are n sensor nodes in the wireless sensor networks,C can be calculated by
C=
n i=1Xi
n , (4)
whereXiis the coordinate of sensor nodei.
LetRbe the average distance betweenC and all sen-sor nodes, which can be calculated by
R=
n
i=1|Xi−C|
n . (5)
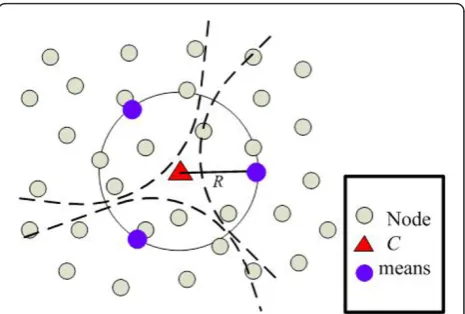
According to CandR, the locations of initial mean of point mi(mix,miy)for the clusteriis calculated by Figure 5 shows the example of the initial means of points, wherekis equal to 3. The initial value kmust be decided in the initial set-up phase. According to the definition of optimum number of clusters in LEACH-C [6],kcan be calculated by
k=
where Mis the side of the given square field. The dto
BS is the average distance from the cluster head nodes to the BS which is defined in LEACH-C. However, the cluster head nodes are selected by creating some clus-ters in our proposed algorithm. Hence, we re-definedto
BS which is the average distance from the all sensor nodes to the BS.
The setting of initial means of points is very impor-tant. It can reduce the iteration time for creating clus-ters significantly. After the initial means of points are
set, based on the location of all sensor nodes, the BS creates some clusters. We use thek-means algorithm to partition the n sensor nodes into kclusters in which each sensor node belongs to the cluster with the nearest mean of point. If there are kclusters in the system, the k-means function can be expressed by
avgSmin
where Si is the cluster i, Xj is coordinate of sensor nodej andmiis the coordinate of mean of point. The main reason for this expression is to obtain the mini-mum average distance between the means of points and the sensor nodes for all clusters.
In order to create uniform distributed clusters, the mini-mal distance between the means of points and all sensor nodes is calculated. Then, the sensor nodes are classified into the cluster according to the minimal distance. If the Xjis the closest to themiin thetth execution, the sensor nodejwill join the clusteri, which can be expressed by
S(t)i =
where each sensor node joins exactly one cluster. The main goal of this expression is to decide which cluster the sensor nodejbelongs to in thetth execution.
When the classification of all nodes is done, the new mean of point is created which is calculated by
m(t+1)i = 1
cluster i. Figure 6 shows the example of the new means of points.
Figure 5Example of the initial means of points. Chang and JuEURASIP Journal on Wireless Communications and Networking2012,2012:172
http://jwcn.eurasipjournals.com/content/2012/1/172
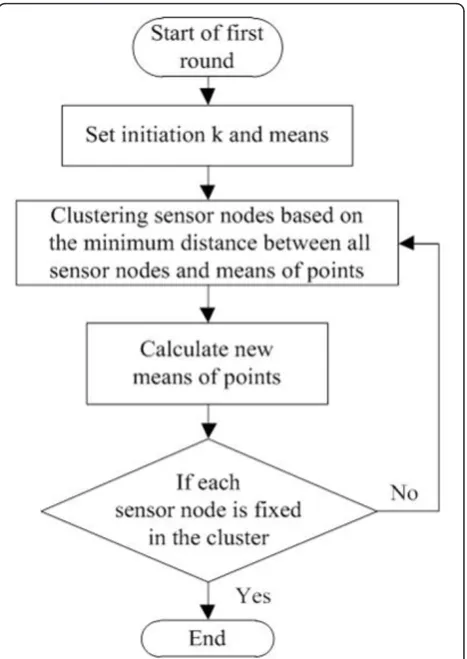
Because the means of points are changed, all sensor nodes are re-classified by executing Equations (9) and (10) iteratively to obtain the minimum average distance between the means of points and the sensor nodes for all clusters. The final clusters are formed when each sensor node is fixed in the cluster. Figure 7 shows the flowchart of the initial cluster processing for our pro-posed scheme. The cluster head is a sensor node which is closer to the final mean of point and the resi-dual energy of the sensor node is higher than the aver-age residual energy in each cluster. Finally, the cluster architecture is created. The BS broadcasts the routing information of the clusters to all sensor nodes. Hence, each sensor node has its own routing table and knows its task (e.g., cluster head or non-cluster head). Also, each sensor node knows the distances from any other sensor node in its cluster and thereby calculates the transmission power. Based on the number of the sen-sor nodes within the cluster, the cluster head node cre-ates a schedule based on Time Division Multiple Access (TDMA) to allocate the time for the cluster members.
3.2. Steady-state phase
Once the clusters are created and the TDMA schedule is fixed, data transmission can begin. The non-cluster head nodes send data to cluster head node during their allocated transmission time. When all the data have been received, the cluster head node performs signal processing to compress the data into a single signal. Then, this signal is sent to the BS. The amount of infor-mation is reduced due to the data aggregation done at the cluster head node. This round is done and the next round begins with set-up and steady-state phases repeatedly.
To avoid unnecessary nodes control messages trans-mission and control overhead of the BS, the clusters are
re-created only when the sensor node cannot work in a certain round. So, the calculating overhead is only clus-ter head selecting in the most set-up phase.
4. Performance analysis
In this section, we evaluate the performance of our pro-posed SECA using a simulation model. We describe our simulation model and illustrate the simulation results, and compare our scheme with the LEACH, HEED, and LEACH-C. We design a simulation environment by using C#. The assumptions for our simulation study are as follows.
Figure 6Example of the new means of points.
Figure 7Flowchart of the initial cluster processing.
Table 1 Parameters used in simulation mode
Parameter Value
Electronics energy (Eelec) 50 nJ/bit Energy for data aggregation (EDA) 5 nJ/bit/signal Initial energy of node (Einit) 2 J
Packet size 2000 bits
Number of nodes (n) 50, 100, 150 Position of BS (X,Y) (50, 175)
• The simulation environment is composed of a BS and some sensor nodes.
• The BS is fixed and located far from the sensor nodes.
•The location of each sensor node is randomly dis-tributed in the sensing area.
•The non-cluster head node can monitor the environ-ment and send data to the cluster head node.
•The cluster head node can gather data, compress it, and forward to the BS.
•All sensor nodes are stationary and the initial energy is the same for each sensor node. All the parameters used in our simulation are listed in Table 1[5,6].
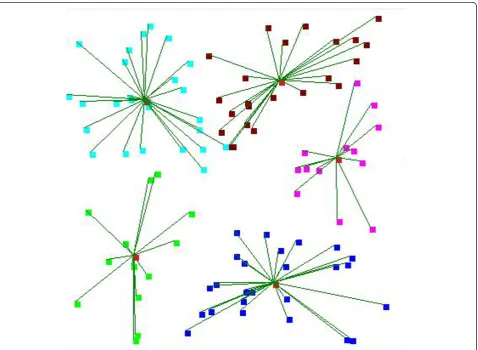
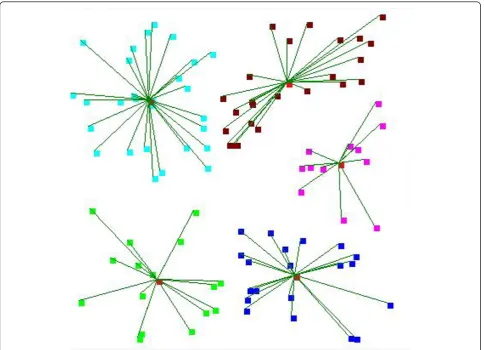
These performance measures obtained on the basis of ten simulation runs are plotted as a function of the rounds and total network energy. A round is defined as the receiving data form all sensor nodes to the BS. The total network energy is defined as the sum of residual energy at all sensor nodes. For fair comparison, we set the number of clusters is equal to 5 which is defined in LEACH-C. Figures 8, 9, and 10 show the clustering
structure for a certain round in the simulation by using LEACH-C, HEED, and our proposed SECA scheme. According to SECA features, it is intuitive that each cluster size is almost the same and cluster heads locate more closely to the cluster centers. Hence, our proposed algorithm reduces the data transmission distances of sensor nodes and results in the lower energy consump-tion in the wireless sensor networks.
Figure 11 shows the total network energy when the number of sensor nodes is 50 and the sensing area is 100 m × 100 m. It is evident that the residual energy of our proposed SECA scheme is higher than that of LEACH, HEED, and LEACH-C schemes after 900 runs. This is because our proposed SECA scheme provides the uniform cluster location and better cluster forma-tion. The data transmission distance from each sensor node to its cluster head node is minimized. Thus, the energy consumption is saved.
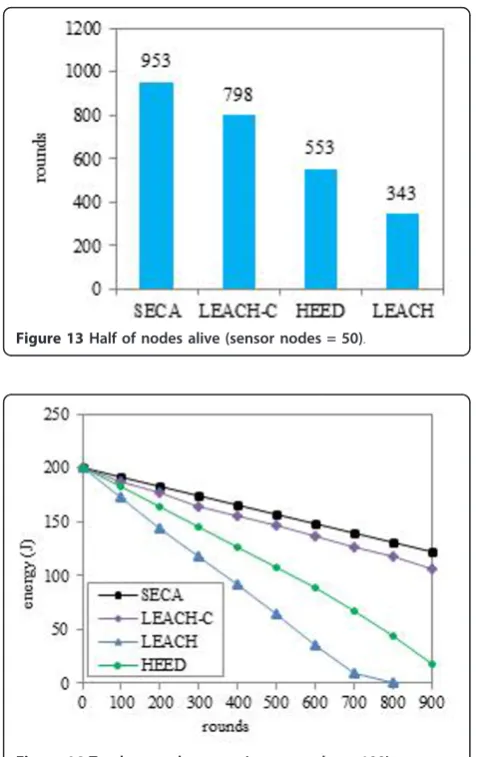
Figures 12 and 13 show the first sensor node dead and half of the sensor nodes alive for four methods when the number of sensor nodes is 50 and the
Figure 8Clustering structure of LEACH-C (sensor nodes = 100).
Chang and JuEURASIP Journal on Wireless Communications and Networking2012,2012:172 http://jwcn.eurasipjournals.com/content/2012/1/172
sensing area is 100 m × 100 m. According to Figures 12 and 13, the lifetime of the sensor node of our pro-posed SECA scheme is better than that of LEACH, HEED, and LEACH-C schemes. The reason for this behavior is that the data communications consume a large amount of energy in wireless sensor networks. However, the transmission distance between non-clus-ter head node and clusnon-clus-ter head node is suitable by using our scheme. The transmission power of non-cluster head nodes is reduced. Also, in order to prove our proposed scheme is well designed, we increase the number of sensor nodes in the simulation environ-ment. Figure 14 shows the total network energy when the number of sensor nodes is 100 and the sensing area is 100 m × 100 m. Due to the better energy sav-ing approach in the proposed scheme, accordsav-ing to SECA features, it is intuitive that the proposed scheme results in higher residual energy than LEACH, HEED, and LEACH-C schemes when the sensor node increases in the same sensing area.
Furthermore, we extend the sensing area to 200 m × 200 m in the simulation environment. Figure 15 shows the total network energy when the number of sensor nodes is 150. The distributions of clusters in LEACH and HEED are not uniform and some clusters consist of huge number of sensor node in a large area. Hence, the cluster head of the cluster with huge number of sensor nodes will suffer from heavy traffic load and result in significant energy consumption. According to Figure 15, the curves indicate that our scheme improves the energy utility more significantly than LEACH, HEED, and LEACH-C schemes when the sensing area is extended. From the simulation results, it is clear that our proposed scheme strikes the appropriate performance in the energy consumption and network lifetime for the wire-less sensor networks.
5. Conclusions
The energy saving is a challenging issue in the wireless sensor networks. To increase energy efficiency and
extend the lifetime of sensor node, new and efficient energy saving schemes must be developed. In the pro-posed scheme, we calculate the average distance between the sensor nodes and take into account the
residual energy for selecting the appropriate cluster head nodes. The lifetime of wireless sensor networks is extended by using the uniform cluster location and bal-ancing the network loading among the clusters. Simula-tion results indicate our proposed algorithm achieves
Figure 10Clustering structure of SECA (sensor nodes = 100).
Figure 11Total network energy (sensor nodes = 50). Figure 12First node dead (sensor nodes = 50). Chang and JuEURASIP Journal on Wireless Communications and Networking2012,2012:172
http://jwcn.eurasipjournals.com/content/2012/1/172
the low energy consumption and better network lifetime in the wireless sensor networks.
Competing interests
The authors declare that they have no competing interests.
Received: 13 February 2012 Accepted: 16 May 2012 Published: 16 May 2012
References
1. IF Akyildiz, W Su, Y Sankarasubramaniam, E Cayirci, A survey on sensor networks. IEEE Commun Mag.40(8), 102–114 (2002). doi:10.1109/ MCOM.2002.1024422
2. M Tubaishat, S Madria, Sensor networks: an overview. IEEE Potentials.22(2), 20–23 (2003)
3. JN Al-Karaki, AE Kamal, Routing techniques in wireless sensor networks: a survey. IEEE Wirel Commun.11(6), 6–28 (2004). doi:10.1109/
MWC.2004.1368893
4. A Chamam, S Pierre, On the planning of wireless sensor networks: energy-efficient clustering under the joint routing and coverage constraint. IEEE Trans Mob Comput.8(8), 1078–1086 (2009)
5. WR Heinzelman, A Chandrakasan, H Balakrishnan, Energy-efficient communication protocol for wireless microsensor networks, inProc 33rd Hawaii International Conference on System Sciences, pp. 1–10 (January 2000) 6. WB Heinzelman, P Chandrakasan, H Balakrishnan, An application-specific
protocol architecture for wireless microsensor networks. IEEE Trans Wirel Commun.1(4), 660–670 (2002). doi:10.1109/TWC.2002.804190
7. O Younis, S Fahmy, HEED: a hybrid, energy-efficient, distributed clustering approach for ad hoc sensor networks. IEEE Trans Mob Comput.3(4), 366–379 (2004). doi:10.1109/TMC.2004.41
8. S Babaie, AK Zadeh, MG Amiri, The new clustering algorithm with cluster members bounds for energy dissipation avoidance in wireless sensor network, inProc Computer Design and Applications (ICCDA), pp. 613–617 (June 2010)
9. Q Xuegong, C Yan, A control algorithm based on double cluster-head for heterogeneous wireless sensor network, inProc Industrial and Information Systems (IIS), pp. 541–544 (July 2010)
10. Y-U Yun, J-K Choi, N Hao, S-J Yoo, Location-based spiral clustering for transmission scheduling in wireless sensor networks, inProc Advanced Communication Technology (ICACT), pp. 470–475 (February 2010) 11. HD Tarigh, M Sabaei, A new clustering method to prolong the lifetime of
WSN, inProc Computer Research and Development (ICCRD), pp. 143–148 (March 2011)
12. T Kanungo, DM Mount, NS Netanyahu, CD Piatko, R Silverman, AY Wu, An efficient k-means clustering algorithm: analysis and implementation. IEEE Trans Pattern Anal Mach Intell.24(7), 881–892 (2002). doi:10.1109/ TPAMI.2002.1017616
13. J Zhu, H Wang, An improved K-means clustering algorithm, inProc 2nd IEEE International Conference on Information Management and Engineering (ICIME), pp. 190–192 (2010)
doi:10.1186/1687-1499-2012-172
Cite this article as:Chang and Ju:An efficient cluster-based power saving scheme for wireless sensor networks.EURASIP Journal on Wireless Communications and Networking20122012:172.
Figure 13Half of nodes alive (sensor nodes = 50).
Figure 14Total network energy (sensor nodes = 100).