STANDARDIZATION AND COMPARATIVE EVALUATION OF AYURVEDIC POLYHERBAL GHRITA
FORMULATION WITH MODERN EXTRACTION TECHNIQUE FOR EXTRACTION EFFICIENCY
USING REVERSED PHASE-HIGH-PERFORMANCE LIQUID CHROMATOGRAPHY
SHELAR M
1, SATHIYANARAYANAN L
1, MAHADIK K
1*, GADGIL S
21Department of Pharmaceutical Chemistry, Bharati Vidyapeeth University, Poona College of Pharmacy, Pune - 411 038, Maharashtra, India. 2Department of Rasashastra Bhaishajyakalpana, College of Ayurved, Bharati Vidyapeeth University, Pune - 411 043, Maharashtra, India.
Email: [email protected]
Received: 05 May 2018, Revised and Accepted: 16 June 2018 ABSTRACT
Methods: SG was processed as per the traditional method, whereas ethanolic extract (EE) and hydroalcoholic extract (HAE) were obtained by the conventional method and lipid-based extract (LE) was prepared by modern extraction method. SG and all extracts were standardized using newly developed high-performance liquid chromatography (LC) with respect to bebeerine, piperine, 6-shogaol, β-asarone, and chebulinic acid. All extracts were analyzed for pesticides, and heavy metal content by LC/mass spectrometry (MS/MS) and inductively coupled plasma/MS, respectively, screened for total polyphenols and flavonoids content, in vitro antioxidant potential, and for assessing its stability over time.
Results: The better extraction was observed with maceration extraction using ethanol compared to ayurvedic method and LE method. All extracts were found to have a negligible amount of pesticide and heavy metals and found to be stable for 6 months under accelerated storage condition. Better polyphenols and flavonoid content and in vitro antioxidant potential were resulted in EE.
Conclusion: EE showed a better potential in comparison with SG and LE.
Keywords: Ghrita, 6-shogaol, Bebeerine, Labrasol ALF, Gelucire 50/13, Labrafil M2125CS.
INTRODUCTION
Herbal products play a vital role in the treatment of various diseases due to their fewer side effects and attract the attention of researchers globally. Especially, the medicinal plants act as a rich source of natural products. Extraction and characterization of a number of active phytoconstituents from medicinal plants help in the discovery of new potent drugs. There are different extraction techniques such as infusion, decoction, digestion, maceration, percolation, and successive solvent extraction used for the extraction of active principles from herbs. Ayurveda, an ancient Indian medicinal system, also mentions the method of extraction of phytoconstituents from plants. One of the popular formulations in Ayurveda is ghrita. In a ghrita preparation, ghee is used as a main extracting agent to extract the phytoconstituents from plants. During the preparation, ghee is boiled with prescribed keshaya (decoction), svarasa (fresh juice), or kalka (paste of crude plant powder in water) of drug according to ayurvedic formula [1].
Sarasvata ghrita (SG) is well-known polyherbal preparation used as a memory enhancer. According to the Ayurvedic Pharmacopoeia of India, SG contains Piper nigrum L. (black pepper), Terminalia chebula Retz. (Hirda), Piper longum L. (Pippali), Zingiber officinale Roscoe (ginger), Acorus calamus L. (vekhand), Cissampelos pareira L. (Dhakti padaval),and Moringa pterygosperma Gaertn. (drumstick)[2], and the principal constituents of which are piperine (PIP) [3], chebulinic acid (CA) [4], PIP [5], 6-shogaol (SHO) [6], β-asarone (ASA) [7], bebeerine (BEB) [8],and carotene [9],respectively. Literature survey reveals that there is a lack of standardization techniques for SG.
Ghee is 100% fat, and regular use of ghee may increase the chance of coronary artery disease [10-12]. Moreover, existing conventional methods of extraction suffer from drawbacks such as time-consuming process, presence of residual solvents, sticky extracts, and difficulty in handling inflammable solvents. Hence, it is necessary to develop a novel method for extraction of the phytoconstituents to exclude above mention drawbacks but to utilize the traditional knowledge. In our previous study, we reported a new method for extraction using different grades of hydrophilic lipids which resulted in promising results for the extraction of phytoconstituents from herbs [1].
Hence, in the present study, a comparative evaluation of extraction in SG, conventional methods, and lipid based extract (LE) was attempted. Labrasol ALF, Gelucire 50/13, and Labrafil M2130CS are such lipids which were used to enhance oral bioavailability of poorly water-soluble drugs [13-16].
Prompted by these facts, it was decided to prepare conventional extract and LE using ingredients of SG and to compare the extraction of active principles with SG using suitable analytical method. The literature survey revealed that no analytical method available for the standardization of SG and simultaneous analysis of active principles of SG. Hence, an attempt has been made to develop a new high-performance liquid chromatographic (HPLC) method for the simultaneous determination of selected markers of plant ingredients of SG. The developed method was validated and successfully applied for standardization and monitoring manufacturing process of SG. © 2018 The Authors. Published by Innovare Academic Sciences Pvt Ltd. This is an open access article under the CC BY license (http://creativecommons. org/licenses/by/4. 0/) DOI: http://dx.doi.org/10.22159/ajpcr.2018.v11i10.27128
Research Article
Thus, the aim of the present study is to compare the extraction efficiency of traditional method with conventional extraction and LE methods. Further, SG was compared with other extracts for antioxidant potential, total polyphenols, flavonoids, pesticides, and heavy metal content. Stability studies have been carried out to control and regulate the efficiency of the formulation.
MATERIALS AND METHODS Plant material
All plants Z. officinale Roscoe (specimen voucher no. MUS 01), T. chebula Retz. (specimen voucher no. MUS 06), P. longum L. (specimen voucher no. MUS 02), P. nigrum L. (specimen voucher no. MUS 03), A. calamus L. (specimen voucher no. MUS 04), C. pareira L. (specimen voucher no. MUS 07), and M. pterygosperma Gaertn. (specimen voucher no. MUS 05) were collected from Manakarnika Aushadhalay, Pune. All these plants were authenticated by the Botanical Survey of India, Pune, Maharashtra, India.
Chemicals and reagents
All chemicals used were of analytical grade and purchased from Merck, USA. BEB (purity: 98.3% by HPLC) was purchased from Baoji Herbest Bio-Tech Co., Ltd., China. CA-β (purity: 83.7% by HPLC), shogaol (purity: 97.8% by HPLC), asarone (purity: 97.7% by HPLC), and PIP (purity: 98.7% by HPLC) were purchased from Natural Remedies Pvt., Ltd., Bengaluru.
Different grades of lipid were kindly gifted by Gattefosse, Saint-Priest, France, and supplied by Colorcon Asia Pvt. Ltd., Mumbai, India.
Preparation of extracts
SG [2]
SG formulation was manufactured according to procedure disclose in the Ayurvedic Pharmacopoeia of India. All the plant parts, i.e., T. chebula Retz. (whole plant), Z. officinale Roscoe. (rhizome), P. nigrum L. (fruit), C. pareira L. (root), A. calamus L. (rhizome), P. longum L. (fruit), and M. pterygosperma Gaertn. (root bark) were cleaned, dried, crushed, and sieved through sieve number 85. In wet grinder, equal quantity of all powder and rock salt was taken (2.4 g/100g), and this mixture was grind with an adequate quantity of water to form uniform blend which is called as Kalka as per Ayurveda. The sample was collected at this stage and designated as sample 1. Cow’s clarified butter (76.8 g for 100 g) was heated in stainless still container, and to this, kalka was added. The goat milk and water 307 ml/100 g of each were added to the above mixture and heating was continued for 3 h with a constant stirring. During this procedure, the temperature was retained between 50 and 90°C. Sample collected after 3 h was designated as sample 2. The heating was stopped and reserved overnight, and the sample was collected which was designated as sample 3. Heating was again continued in next day till the kalka forms varti (varti was prepared by gently sloping the kalka between fingers to form wick like shape) and subsidence of forth. The absence of crackling sound when varti was heated on flame indicates the absence of moisture in the formulation. The above mixture was filtered with the help of muslin cloth and allowed to chill. The filtrate was designated as sample 4. The residue after filtration was designated as sample 5. All samples were analyzed by HPLC for monitoring the manufacturing process of ghrita formulation.
Ethanolic extract (EE)
All plant parts were cleaned with water, dried, crushed, and sieved through sieve number 85. EE was prepared by cold maceration technique, in which 100 g of each plant powder was kept in contact with 2.5 L of 90% ethanol for 15 days. After 15 days, the above mixture was filtered and evaporated to dryness to get EE.
Hydroalcoholic extract (HAE)
All plant parts were washed, dried, powdered, and passed through sieve number 85. 100 g of each powder plant was subjected to cold maceration with 2.5 L mixture of 50% ethanol and 50% distilled
water for 15 days. Then, the extract was obtained after filtration and evaporation of the solvent under vacuum evaporator.
Lipid extract using different grades of LE
All powdered plant materials were taken in equal amount and mixed; this mixture was extracted with different grades of hydrophilic lipid (Labrasol ALF, Gelucire 50/13, and Labrafil M2130CS) in different proportions of drug and lipid in the ratio of 1:0.5, 1:1, 1:1.5, and 1:2. For the Labrasol ALF and Labrafil M2130CS, mixture of plant powder and lipids was vortexed for 10 min, and for the Gelucire 50/13, lipid was melted to which the plant powder was mixed into this and then cooled. Water was added, to disperse the lipid, filtered through the 0.45 μm membrane syringe filter, and the filtrate was evaporated. The optimization of the grade of lipids and the proportion of drug and lipid were done using HPLC analysis of the extract with respect to active constituents.
Standardization of SG, EE, HAE, and LE
HPLC conditions
Total polyphenolic content (TPC)
Total polyphenol content of SG, EE, HAE, and LE was quantified by Folin–Ciocalteu colorimetric method. In brief, sample (1 ml) was mixed with Folin–Ciocalteu’s phenol reagent (1 ml), followed by addition of sodium carbonate (7%, 10 ml), and volume was adjusted to 25 ml with distilled water. After incubation for 90 min in the dark at room temperature, absorbance was measured at 760 nm using UV-Vis spectrometer (Jasco International Co., Ltd., Tokyo, Japan). The total polyphenol content was expressed in terms of gallic acid equivalent/g of extract [17-20].
Total flavonoid content (TFC)
TFC of SG, EE, HAE, and LE was determined by the aluminum chloride colorimetric method. To sample extract (1 ml), distilled water (4 ml) and 0.3 ml of sodium nitrite (5%) were added. Aluminum chloride (0.3 ml, 10%) and sodium hydroxide (2 ml, 1 M) were added after 5 min and 6 min, respectively. Volume was adjusted to 10 ml with distilled water. The absorbance was measured using UV-Vis spectrometer at 510 nm. TFC of the extract was expressed in terms of quercetin equivalent/g of extract [18,19,21,22].
Pesticide content
Pesticide contents were determined using 410 Proster Binary LC with 500 MS IT PDA detectors, Varian Inc., with APC or ESI. [23,24]. In 2 g of sample, water (8 ml) and acetonitrile (10 ml in 1% acetic acid) were added. To this, 6 g of anhydrous magnesium sulfate and 1.5 g anhydrous sodium sulfate were added. After heating at 150°C for 5 min, the mixture was kept in desiccator for cooling. This was vortexed for 3 min and centrifuged at 4000 rpm for 5 min. 5 ml of supernatant was mixed with 25 mg of primary secondary amine in 15 ml polypropylene centrifuge tube, shaken for 30 s, and centrifuged for 5 min at 10,000 rpm. 2 ml of supernatant from that was mixed with 200 µL of 10% diethylene glycol solution and evaporated to dryness under nitrogen at 35°C. This solution was reconstituted with 1 ml of 0.1% acetic acid and 1 ml of methanol filtered through 0.2 µm membrane filter and injected (5–20 µL) into LC-mass spectrometry (MS)/MS.
Heavy metal content
Heavy metals analysis for arsenic (As), copper (Cu), and lead (Pb) was carried out according to PerkinElmer Corporation (1982) modified method. Ash was obtained by heating 0.5 g of extract first at 100°C, to decrease the moisture amount, and then at 500°C, to get constant weight of crucible. Three selected metals Cu, As, and Pb were measured using Agilent Technologies 7700 series, Inductively Coupled Plasma/MS. Solutions containing As, Cu, and Pb ions were obtained by dissolution of their ash in nitric acid (5 ml, concentration), water (5 ml), and hydrogen peroxide (1 ml). As, Cu, and Pb were determined directly in the ash solution. Calibration curves were prepared using dilutions of stock solutions. Following wavelengths were used for the studied metals: Cu 324.8 nm, AS 525.0 nm, and Pb 232.0 nm [24,25].
Simultaneous quantification of markers
20 µL of sample solutions were injected for the quantification purpose. The peak areas were recorded, and the concentrations of all phytoconstituents were calculated using the calibration curve. The analysis was carried out in triplicate.
Standard stock solution
In standard volumetric flask, accurately weighed 10 mg of marker compound was transferred and dissolved by adding small amount of methanol and diluted up to 10 ml with methanol to get concentration 1000 µg/ml.
The solutions required for the calibration curve were prepared by appropriate dilutions of the standard stock solution in 10 ml volumetric flask
Sample preparation for SG
Sample preparation for EE, HAE, and LE
Accurately weighed 250 mg of extract was dissolved in 10 ml of methanol by sonication for 10 min. The solution was filtered through a 0.45 μm membrane syringe filter before analysis.
Method validation [26,27]
The proposed method was validated according to the ICH guidelines. The method was validated for linearity, accuracy, precision, selectivity, limit of detection (LOD), limit of quantification (LOQ), and robustness.
Linearity
LOD and LOQ
The LOD and LOQ were estimated using the formula:
LOD=3.3×(standard deviation of intercept/slope of the calibration plot). LOQ=10×(standard deviation of intercept/slope of the calibration plot).
Precision
Intra- and inter-day precision was evaluated on standard marker compound and SG preparation. The analysis was done using three different concentrations into six replicate applications on the same day for intraday precision and on different days for interday precision. The result was expressed as the percentage relative standard deviation (% RSD) for peak area was determined for standards CA, ASA, PIP, SHO, and BEB by repeated analysis (n=6).
Accuracy by recovery
Accuracy was done by standard addition method, and the experiment was conducted in triplicate. Standard marker compounds were spiked with SG for recovery analysis.
Selectivity and specificity
Specificity was ascertained by analyzing standard compounds and samples. The peaks for sample solutions were confirmed by comparing the retention time (Rt) those of the standards.
Robustness
Robustness study of the method was done in six replicates. Robustness was studied by introducing small changes in the mobile phase flow rate, different analyst, and different manufacture of column. The % RSD of peak Rt was calculated.
Stability studies [28]
Stability studies were carried out as per the ICH guidelines. Stability of the Ayurvedic formulation and other extracts were monitored for 6 months after packaging and storing them at 40°C±2°C of temperature and 75%±5% humidity. Samples were withdrawn for analysis after 3 months and 6 months. The samples were tested for stability in terms of drug content and physicochemical parameter.
In vitro antioxidant activity
EE, HAE, and LE solutions were prepared in different concentrations (10–60 µg/ml), and SG solution was prepared in concentration (100– 600 µg/ml).
2,2-diphenyl-1-picrylhydrazyl (DPPH) radical scavenging activity
The free radical scavenging activity of SG, EE, HAE, and LE was measured by DPPH [29,30]. 0.1 mM solution of DPPH was prepared in methanol. 1 ml of DPPH solution was mixed to 3 ml of different concentrations of extract. The mixture was shaken and kept for 30 min at room temperature. The absorbance was measured using UV-Vis spectrophotometer at 517 nm. DPPH scavenging effect was calculated using the equation:
% scavenging effect=[(A0–A1)/A0]×100
Where A0 is the absorbance of control reaction and A1 is the absorbance in presence of standard or test solution.
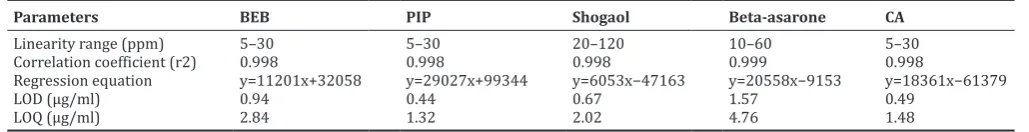
Table 1: Validation data from calibration curves of the standards - BEB, PIP, SHO, ASA, and CA
Parameters BEB PIP Shogaol Beta-asarone CA
Linearity range (ppm) 5–30 5–30 20–120 10–60 5–30
Correlation coefficient (r2) 0.998 0.998 0.998 0.999 0.998
Regression equation y=11201x+32058 y=29027x+99344 y=6053x−47163 y=20558x−9153 y=18361x−61379
LOD (μg/ml) 0.94 0.44 0.67 1.57 0.49
LOQ (μg/ml) 2.84 1.32 2.02 4.76 1.48
LOD: Limit of detection, LOQ: Limit of quantification, SHO: 6-shogaol, CA: Chebulinic acid, ASA: β-asarone, PIP: Piperine, BEB: Bebeerine
The sample preparation for SG and the samples were collected during manufacturing process of ghrita was optimized to get a well resolved peaks and to efficiently extract the phytoconstituents from the samples. The optimized method was given below: 5 g of accurately weighed formulations were transferred to separating funnel and to 20 ml of methanol, and 20 ml of hexane was added. The mixture was shaken vigorously and kept for 5 min for separation of two layers. The methanolic layer was separated and again treated with 10 ml of hexane to remove remaining fat. Hexane layers were discarded. The final volume of methanolic layer was made up to 25 ml with methanol. This solution was filtered through 0.45 μm syringe filter before analysis.
Scavenging of hydrogen peroxide [31]
A solution of 40 mM hydrogen peroxide was prepared in phosphate buffer (pH). 0.6 ml of 40 mM solution of hydrogen peroxide was added to 1 ml of test solution, and absorbance was measured by UV-Vis spectrophotometer at 230 nm after incubation for 19 min against blank solution in phosphate buffer without hydrogen peroxide.
H2O2 scavenging effect was calculated using the equation:
% scavenged=[(A0–A1)/A0]×100
Where A0 is the absorbance of control reaction, and A1 is the absorbance in presence of standard or test solution.
Total reduction capability [32]
2.5 ml of test solution was added in 2.5 ml of phosphate buffer (0.2 M, pH 6.6) and potassium ferricyanide (1% w/v), and this mixture was incubated for 20 min at 50°C after addition of 10% w/v trichloroacetic acid. After incubation, the mixture was centrifuged for 10 min at 3000 rpm. 2.5 ml of the upper layer was mixed with 2.5 ml of distilled water and 0.5 ml of ferric chloride (0.1% w/v), and absorbance was measured by spectrophotometer at 700 nm.
Ferrous ion chelating ability=[A0–A1)/A0]×100
Where A1 is the absorbance of sample solution and A0 is the absorbance of control.
Chelating effects on ferrous ions [33]
0.5 ml of the test solution was added to 0.5 ml of ferrous sulfate (0.12 mM) and 0.5 ml of ferrozine (0.6 mM) solution. After incubation at room temperature for 10 min, absorbance was measured using UV-Vis spectrophotometer at 562 nm. Distilled water instead of ferrozine was used as blank, and for control test, solution is omitted.
Ferrous ion chelating ability (%)=[A0−A1)/A0]×100
Where A0 is the absorbance of control reaction and A1 is the absorbance in the presence of standard or test solution.
RESULTS AND DISCUSSION Optimization of chromatography
SG is one of the popular formulations in Ayurveda used for the treatment of speech delay and as memory enhancer. This formulation basically uses ghee as a main extractant for extraction of chemical constituents
from plant ingredients. SG is a polyherbal formulation that consists of 7 plant ingredients. The major challenge with standardization of herbal formulations is their complex chemical constituents. Unlike synthetic drugs, the complexity of chemical constituents made difficult for developing suitable analytical methods for standardization. Further, the lack of availability of chemical markers made this task much difficult. As per the literature survey characteristics, phytochemical and physiochemical parameters of SG have been reported by Patil et al., 2010 [34]. There is no attempt reported for the standardization of SG yet. Hence, there is a uncertainty about the safety and efficacy of SG. Not only the complexity of SG but also the presence of highly lipidic ghee are the challenges in analytical method development. Recently, marker based standardization has become popular and been accepted as one of the useful techniques for the standardization of polyherbal formulation. Hence, in the present study, a novel HPLC method has been developed for simultaneous identification of five major phytoconstituents present in herbs of SG, namely BEB, CA, PIP, SHO, and ASA, for the standardization of SG.
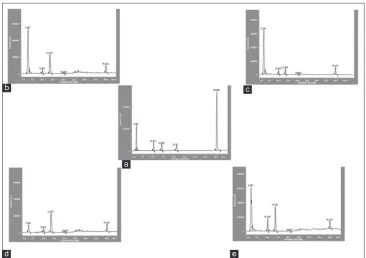
Different mobile phase containing various ration of methanol, acetonitrile, triethylamine, phosphate buffer, and double-distilled water were tried for separation of the pure compounds. Finally, the optimized mobile phase which gave well-resolved peaks was double-distilled water (solvent A) and methanol (solvent B) using linear gradient system; initial 70% B for 16 min, 70–95% B in 10 min, followed by 95% B till 45 min. Solvent B was decreased to 70% over the next 3 min and held constant till the end of 10 min of run. Optimum wavelength 282 nm was selected for the detection and quantification. The retention time for CA, ASA, PIP, SHO, and BEB was found to be 2.0 min, 10.1 min, 13.7 min, 20.7 min, and 40.3 min, respectively. The densitogram obtained is shown in Fig. 1.
HPLC method validation
Linearity, LOD, and LOQ
CA, PIP, and BEB were found to be linear in the range of 5–30 ppm, and for ASA and SHO, the range was found to be 10–60 ng/band and 20–120 ppm, respectively. These values revealed a good correlation coefficient for the developed method, and LOD and LOQ are mentioned in Table 1.
Precision
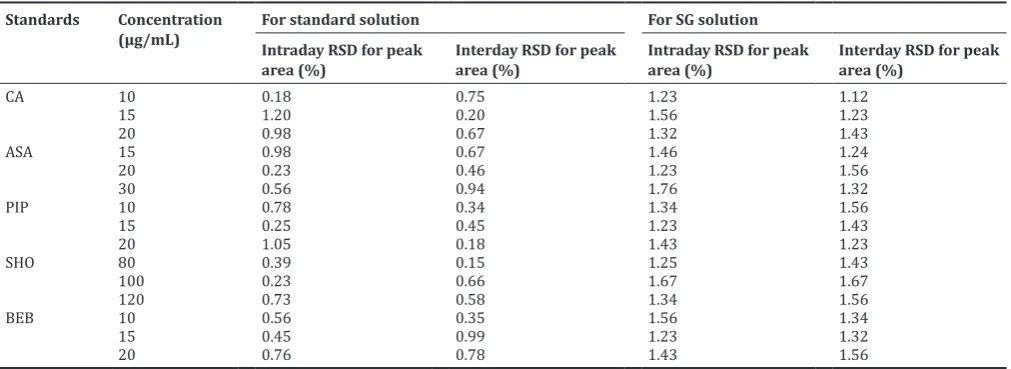
The intra- and inter-day precision expressed as the % RSD for peak area was determined for standards CA, ASA, PIP, SHO, and BEB by repeated analysis (n=6). Intra- and inter-day RSD of CA, ASA, PIP, SHO, and BEB was found < 2% which indicates that the method is precise. The results are summarized in Table 2.
Table 2: Intra-and inter-day precision (n=6) Standards Concentration
(μg/mL) For standard solutionIntraday RSD for peak For SG solution
area (%) Interday RSD for peak area (%) Intraday RSD for peak area (%) Interday RSD for peak area (%)
CA 10 0.18 0.75 1.23 1.12
15 1.20 0.20 1.56 1.23
20 0.98 0.67 1.32 1.43
ASA 15 0.98 0.67 1.46 1.24
20 0.23 0.46 1.23 1.56
30 0.56 0.94 1.76 1.32
PIP 10 0.78 0.34 1.34 1.56
15 0.25 0.45 1.23 1.43
20 1.05 0.18 1.43 1.23
SHO 80 0.39 0.15 1.25 1.43
100 0.23 0.66 1.67 1.67
120 0.73 0.58 1.34 1.56
BEB 10 0.56 0.35 1.56 1.34
15 0.45 0.99 1.23 1.32
20 0.76 0.78 1.43 1.56
Recovery
The recovery experiments of the CA, ASA, PIP, SHO, and BEB were performed by spiking standards at known concentration in SG in triplicate. The recoveries of the standards were found to be 99.45– 100.13%, 99.12–100.78%, 100.34–100.53%, 99.28–101.4%, and 99.67–99.89% for CA, ASA, PIP, SHO, and BEB, respectively, as shown in Table 3.
Robustness
% RSD for all the five standards, namely CA, ASA, PIP, SHO, and BEB, after changing the mobile phase flow rate, different analyst, different column manufacturer, and %RSD for peak Rt was calculated and found to be <2% as shown in Table 4.
TPC and flavonoid content
Nowadays, the analysis of flavonoids in medicinal herbs is gained importance due to its higher antioxidant properties [35]. Due to its antioxidant activity, it is helpful in neurodegenerative disease, cancer, and diabetes mellitus [36]. In the present study, polyphenol and flavonoid contents were estimated in the different extract. The results of TPC and TFC of all extracts are represented in Table 5. The TPC and TFC were found to be higher in EE as compared with other extracts. The TPC was expressed in mg equivalent of gallic acid/g, and TFC was expressed in mg equivalent of quercetin/g. TPC was estimated by linear regression equation (y=0.158x−0.006), which was obtained from the standard calibration curve of gallic acid, and TFC was estimated by linear regression equation (y=0.050x−0.082), which was obtained from the standard calibration curve of quercetin.
Heavy metal content
Polyphenols present in extract may bind with heavy metals because of its complex nature. These compounds after ingestion may metabolize in the body leaving heavy metals inside the body or polyphenols may also act as a barrier for the transportation heavy metals and may cause toxicity [37]. Hence, in the present study, heavy metal analysis was carried out. By measuring the peak area of the selected analytes with respect to the internal standard control, quantification of samples was done. This ratio was taken onto the linear calibration curves traced for each standard solution. Heavy metal analysis showed arsenic level
below detection limit. Pb was found in the concentration of 0.14 ppm, 0.16 ppm, 0.23 ppm, and 0.18 ppm for SG, LE, HAE, and EE, respectively. Cu was found in the concentration of 0.15 ppm, 0.20 ppm, 0.25 ppm, and 0.18 ppm for SG, LE, HAE, and EE, respectively, but both were of negligible quantity, so they could not be considered as contaminant.
Table 3: Percent recovery of BEB, PIP, SHO ASA, and CA from SG Standards Amount added (μg/mL) Average recovery (%)±SD*
CA 5 99.45±0.71
10 100.13±1.49
15 99.82±1.80
ASA 5 100.21±0.45
10 99.12±1.06
15 100.78±1.24
PIP 5 100.45±1.59
10 100.53±1.82
15 100.34±1.11
SHO 5 101.4±1.53
10 99.28±1.42
15 99.90±1.35
BEB 5 99.67±1.12
10 99.89±1.01
15 99.78±0.12
*Values represented with average recovery±SD of the means of three
independent experiments (n=3), SHO: 6-shogaol, CA: Chebulinic acid,
ASA: β-asarone, PIP: Piperine, BEB: Bebeerine, SD: Standard deviation
Table 4: Robustness (n=6), concentration - 20 μg/ml
S. No. Parameter % RSD
CA A PIP SHO BEB
1 Mobile phase
flow rate 0.98 1.25 1.70 0.69 0.75
2 Different analyst 1.45 1.56 1.4 0.78 1.2
3 Different column
manufacture 1.21 0.87 0.64 1.37 1.34
SHO: 6-shogaol, CA: Chebulinic acid, ASA: β-asarone, PIP: Piperine,
BEB: Bebeerine, RSD: Relative standard deviation
c
Fig. 1: Chromatogram obtained from (a) mixed standard solutions of chebulinic acid, β-asarone, piperine, 6-shogaol, and bebeerine, (b) prepared alcoholic extract, (c) prepared hydroalcoholic extract, (d) prepared SG formulation, (e) prepared lipid extract
a b
d e
Pesticide content determination
About 113 pesticides were tested including phorate, edifenphos, myclobutanil, triazophos, tricyclazole, phosphamidon, butachlor, atrazine, malathion, dimethoate, bifenazate, mandipropamide, azadiractin, spirodiclofen, and malaoxon. Myclobutanil was found in the concentration of 0.008 ppm, 0.011 ppm, 0.022 ppm, and 0.026 ppm for SG, LE, HAE, and EE, respectively. All other pesticides were found to be absent in the sample. From the results obtained, it was found that SG contains the lowest amount of myclobutanil as compare to other extract.
Evaluation of extraction process of SG
Ghrita is prepared by boiling of ghee with fresh juice, decoction, or paste of crude plant powder. Ghee is glycerides of fatty acids, which reacts with liquid during the preparation of ghrita and breaks into fatty acid and glycerol. These fatty acids are amphipathic in nature, thus water-soluble constituents binds with hydrophilic end, and oil soluble constituents bind with hydrophobic end. The continuous agitation and heating during preparation enhance the extraction of phytoconstituents. After evaporation of the water, ghee contains both oil and water-soluble ingredients. The HPLC results of the different samples which were collected during the SG preparation are shown in Table 6. Sample 2 showed the fewer amounts of phytoconstituents indicate
poor extraction by ghee; however, sample 3 showed slightly increased amount of phytoconstituents than sample 2 indicating the extraction due to the contact of phytoconstituents with ghee for overnight. The final ghrita showed the better content of phytoconstituents after filtration compared to samples 2 and 3. However, complete extraction was not achieved as the residue (sample 5) showed the presence of phytoconstituents.
Determination of extraction efficacy
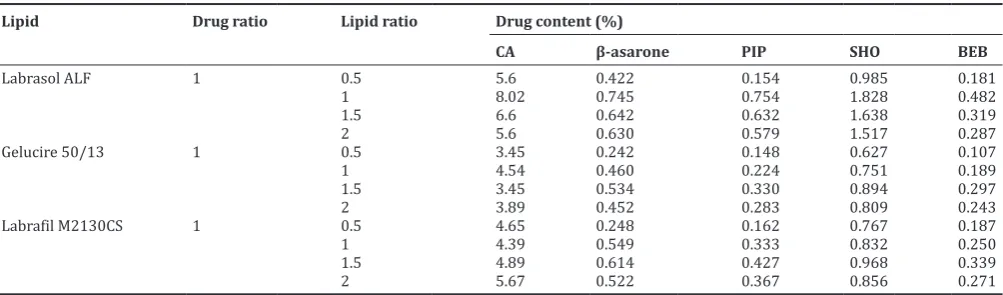
The HPLC results of SG, EE, HAE, and various grades of lipids are shown in Tables 7 and 8. The results showed that Labrasol ALF lipid in proportion 1:1 extracted maximum amount of the active constituent than other lipids. Hence, it was used for the further study. EE and LE showed the highest percentage of active constituents. The overall results suggest the poor extraction by ayurvedic method compared to other extracts.
Stability studies
For the stability study samples were collected after 3 months and 6 months. The samples were analyzed for the stability in terms of drug content and physicochemical parameter, and the results are shown in Table 9.
Antioxidant potential
It is very difficult to analyze antioxidant activity by single method because of oxidative process. Hence, antioxidant potential was evaluated by DPPH scavenging, hydrogen peroxide scavenging, total reduction capability, and chelating effect on ferrous ion methods.
DPPH scavenging
Hydrogen peroxide scavenging
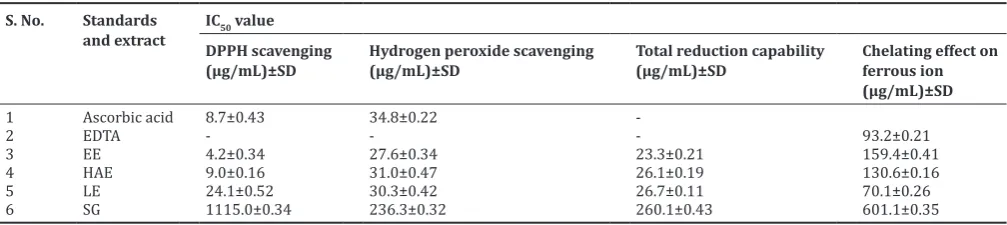
H2O2 is very important as it easily penetrates biological membranes. H2O2 may produce hydroxyl free radical in the cells, which may be toxic to cells. EE showed highest hydrogen peroxide scavenging activity when compared with ascorbic acid and other extract; hydrogen peroxide scavenging activity was concentration dependent. The IC50 value of EE, LE, HAE, ascorbic acid, and SG was 27.5, 30, 31, 34.8, and 236.3 μg/ml, respectively.
Table 5: TPC and TFC in four different extracts
S. No. Extract TPC
(mg GAE/g)±SD* TFC (mg QE/g)±SD*
1 SG 0.03±0.34 4.39±0.09
2 Alcoholic extract 30.08±0.39 20.38±0.54
3 HAE 23.76±0.17 14.07±0.85
4 Lipid extract 3.65±0.29 9.73±0.55
*Values represented with mean±SD of the means of three independent
experiments (n=3). SG: Sarasvata ghrita, HAE: Hydroalcoholic extract, GAE: Gallic acid equivalent, TPC: Total polyphenolic content, TFC: Total flavonoid content, SD: Standard deviation, QE: quercetin equivalent
Table 6: Content of CA, ASA, PIP, and BEB in different samples of the SG formulation collected during preparation Standards Drug content (%)
Sample 1 Sample 2 Sample 3 Sample 4 Sample 5
CA 10.23 0.012 0.145 0.23 9.32
β-asarone 3.457 0.075 0.133 0.214 2.865
PIP 6.090 0.035 0.150 0.204 5.661
SHO 1.125 0.316 0.531 0.734 0.391
BEB 0.513 0.018 0.215 0.417 0.103
SG: Sarasvata ghrita, SHO: 6-shogaol, CA: Chebulinic acid, ASA: β-asarone,
PIP: Piperine, BEB: Bebeerine
Table 7: Content CA, ASA, PIP, SHO, and BEB extracted with various grades of lipids with different proportion with crude drug
Lipid Drug ratio Lipid ratio Drug content (%)
CA β-asarone PIP SHO BEB
Labrasol ALF 1 0.5 5.6 0.422 0.154 0.985 0.181
1 8.02 0.745 0.754 1.828 0.482
1.5 6.6 0.642 0.632 1.638 0.319
2 5.6 0.630 0.579 1.517 0.287
Gelucire 50/13 1 0.5 3.45 0.242 0.148 0.627 0.107
1 4.54 0.460 0.224 0.751 0.189
1.5 3.45 0.534 0.330 0.894 0.297
2 3.89 0.452 0.283 0.809 0.243
Labrafil M2130CS 1 0.5 4.65 0.248 0.162 0.767 0.187
1 4.39 0.549 0.333 0.832 0.250
1.5 4.89 0.614 0.427 0.968 0.339
2 5.67 0.522 0.367 0.856 0.271
SHO: 6-shogaol, CA: Chebulinic acid, ASA: β-asarone, PIP: Piperine, BEB: Bebeerine
Total reduction capability
EE showed prominent reduction capability than HAE, LE, and SG. The reducing capability of EE, HAE, LE, and SG was increased with increase in concentration. The IC50 value of EE, HAE, LE, and SG was 23.3, 26.1, 26.7 and 260.1 μg/ml, respectively.
Chelating effect on ferrous ion
An antioxidant shows the activity by slowing down the oxidation reaction by various mechanisms. Of these, the most important mechanism of action of secondary antioxidant is chelation of metal. Iron and other metal such as chromium, cobalt, Cu, arsenic, nickel, and cadmium act as catalyst in free radical reactions. Chelation of these metal ions stabilizes the oxidized form of the metal and helps in discontinue the free radical reaction.
Ferrozine forms complex with Fe2+, but samples that have chelating ability decrease the formation of complex, and hence, decrease in the color intensity helps in the estimation of the chelating ability of samples. In the present study, LE showed the highest chelating effect as compared with EE, HAE, SG, and ethylenediaminetetraacetic (EDTA). The IC50 value of LE, EDTA, HAE, EE, and SG was 70.1, 93.2, 130.6, 159.4, and 601.1 μg/ml, respectively. LE showed higher activity than EDTA, HAE, EE, and SG. The chelating activity was concentration dependent,
and thus, chelating ability was increased with increased concentration of sample.
The IC50 values of extracts and standard for the DPPH scavenging, hydrogen peroxide scavenging ability, total reduction capability, and chelating effect on ferrous ion are shown in Table 10.
CONCLUSION
Extraction efficiency of SG was compared with LE and conventional extraction methods. It was found that extraction of phytoconstituents by the process of ghrita preparation is poor and EE method was found to be the most efficient method. This study proved the negligible amount of heavy metals and pesticides in SG, EE, HAE, and LE. Thus, it can be considered as safe for use. The study also determined polyphenols and flavonoid content, suggesting its potential for use in oxidative stress. The proposed analytical method is simple, precise, accurate, and specific for quantification and identification of CA, BEB, PIP, SHO, and ASA. Stability study results indicate that SG, EE, HAE, and LE were stable for 6 months under accelerated storage condition. In conclusion, EE can be preferred compared to ayurvedic SG and lipid extracts in terms of extraction and in vitro antioxidant potential. However, it is essential to compare the in vivo memory enhancing activity which is underway in our laboratories.
Table 8: Content of CA, ASA, PIP, SHO, and BEB in sg formulation, conventional extracts, and Labrasol ALF (1:1)
Standard Drug content (%)
SG formulation Alcoholic extract HAE Lipid extract using labrasol
CA 0.23 10.12 8.23 8.02
β-asarone 0.214 4.296 1.347 0.745
PIP 0.204 11.617 3.147 0.754
SHO 0.732 1.110 0.635 1.828
BEB 0.476 0.447 0.0234 0.482
SG: Sarasvata ghrita, SHO: 6-shogaol, CA: Chebulinic acid, ASA: β-asarone, PIP: Piperine, BEB: Bebeerine
Table 9: Stability data
Name of samples Months Drug content (%) Color
CA ASA PIP SHO BEB
SG Initial 0.23 0.214 0.204 0.732 0.417 Yellowish green
3 months 0.20 0.208 0.196 0.729 0.413 Yellowish green
6 months 0.18 0.206 0.189 0.725 0.401 Yellowish green
EEM Initial 10.12 4.296 11.617 1.110 0.447 Dark green
3 months 9.98 4.271 11.463 1.094 0.413 Dark green
6 months 9.54 4.149 11.315 1.082 0.390 Dark green
LE Initial 8.02 0.745 0.754 1.826 0.482 Dark brown
3 months 7.68 0.729 0.748 1.808 0.473 Dark brown
6 months 7.56 0.713 0.742 1.779 0.466 Dark brown
SG: Sarasvata ghrita, CA: Chebulinic acid, ASA: β-asarone, PIP: Piperine, SHO: 6-shogaol, BEB: Bebeerine
Table 10: The IC50 values of extracts and standard for the DPPH scavenging, hydrogen peroxide scavenging ability, total reduction capability, and chelating effect on ferrous ion
S. No. Standards
and extract ICDPPH scavenging 50 value
(μg/mL)±SD Hydrogen peroxide scavenging (μg/mL)±SD Total reduction capability (μg/mL)±SD Chelating effect on ferrous ion (μg/mL)±SD
1 Ascorbic acid 8.7±0.43 34.8±0.22
-2 EDTA - - - 93.2±0.21
3 EE 4.2±0.34 27.6±0.34 23.3±0.21 159.4±0.41
4 HAE 9.0±0.16 31.0±0.47 26.1±0.19 130.6±0.16
5 LE 24.1±0.52 30.3±0.42 26.7±0.11 70.1±0.26
6 SG 1115.0±0.34 236.3±0.32 260.1±0.43 601.1±0.35
Values represented with mean±SD of the means of three independent experiments (n=3), IC50: Half maximal inhibitory concentration, EDTA: Ethylenediaminetetraacetic,
ACKNOWLEDGMENTS
We are grateful to Dr. Asmita Wele, Head of The Department of Rasashastra Bhaishajyakalpana, College Of Ayurved, Bharati Vidyapeeth Deemed University, Pune, India, for support in this work.
FUNDING
This work was supported by University Grants Commission-Basic Scientific research [Grant number F. 7-23/2007(BSR)].
AUTHOR’S CONTRIBUTIONS
The basis of the entire study was designed by Dr. K. R. Mahadik.
Experimental protocol including analytical work was designed and carried out under guidance of Dr. Sathiyanarayanan Lohidasan and Dr. Swati Gadgil.
Madhuri Shelar executed the experimental work.
Manuscript correction and discussion was carried out by both Dr. Sathiyanarayanan L and Dr. K.R. Mahadik.
CONFLICTS OF INTEREST
The authors does not have any conflicts of interest.
REFERENCES
1. Lohidasan S, Paradkar AR, Mahadik KR. Nootropic activity of lipid-based extract of Bacopa monniera linn. Compared with traditional preparation and extracts. J Pharm Pharmacol 2009;61:1537-44. 2. Health and Family Welfare, Department of Health. The Ayurvedic
Pharmacopoeia of India. Part I. 1st ed. New Delhi, India: Health and Family Welfare, Department of Health; 2007. p. 158-60.
3. Ahmad N, Fazal H, Abbasi BH, Farooq S, Ali M, Khan MA. Biological role of Piper nigrum L. (Black pepper): A review. Asian Pac J Trop Biomed 2012;2:S1945-53.
4. Gupta PC. Biological and pharmacological properties of Terminalia chebula Retz. (Haritaki)-An overview. Int J Pharm Pharm Sci 2012;4 Suppl 3:62-8.
5. Zaveri M, Khandhar A, Patel S, Patel A. Chemistry and pharmacology of Piper longum L. Int J Pharm Sci Rev Res 2010;5:67-76.
6. Banerjee S, Mullick HI, Banerjee J, Ghosh A. Zingiber officinale:‘A natural gold’. Int J Pharm Bio Sci 2011;2:283-94.
7. Divya G, Gajalakshmi S, Mythili S, Sathiavelu A. Pharmacological activities of Acorus calamus: A review. Asian J Biochem Pharm Res 2011;4:57-64.
8. Arora M, Sharma T, Devi A, Bainsal N, Siddiqui AA. An inside review of Cissampelos pareira Linn: A potential medicinal plant of India. Int Res J Pharm 2012;3:38-41.
9. Usman MR, Barhate SD, Abullais M, Usman M. A review on drumstick tree (Moringa pterygosperma Gaertn): Multiuse tree with higher economical values. Int J Curr Pharm Rev Res 2012;3:15-22.
10. Singh RB, Niaz MA, Ghosh S, Beegom R, Rastogi V, Sharma JP, et al.
Association of trans fatty acids (vegetable ghee) and clarified butter (Indian ghee) intake with higher risk of coronary artery disease in rural and urban populations with low fat consumption. Int J Cardiol 1996;56:289-98.
11. Jacobson MS. Cholesterol oxides in Indian ghee: Possible cause of unexplained high risk of atherosclerosis in Indian immigrant populations. Lancet 1987;2:656-8.
12. Lip GY, Malik I, Luscombe C, McCarry M, Beevers G. Dietary fat purchasing habits in whites, blacks and Asian peoples in England— implications for heart disease prevention. Int J Cardiol 1995;48:287-93. 13. Strickley RG. Solubilizing excipients in oral and injectable formulations.
Pharm Res 2004;21:201-30.
14. Prasad YR, Puthli SP, Eaimtrakarn S, Ishida M, Yoshikawa Y, Shibata N,
et al. Enhanced intestinal absorption of vancomycin with labrasol and D-α-tocopheryl PEG 1000 succinate in rats. Int J Pharm 2003;250:181-90.
15. Sachs-Barrable K, Thamboo A, Lee SD, Wasan KM. Lipid excipients peceol and gelucire 44/14 decrease P-glycoprotein mediated efflux of rhodamine 123 partially due to modifying P-glycoprotein protein expression within caco-2 cells. J Pharm Pharm Sci 2007;10:319-31. 16. Chauhan B, Shimpi S, Paradkar A. Preparation and characterization
of etoricoxib solid dispersions using lipid carriers by spray drying technique. AAPS PharmSciTech 2005;6:E405-12.
17. Singleton VL, Orthofer R, Lamuela-Raventós RM. Analysis of total phenols and other oxidation substrates and antioxidants by means of folin-ciocalteu reagent. Methods Enzymol 1999;299:152-78.
18. Kumazawa S, Taniguchi M, Suzuki Y, Shimura M, Kwon MS, Nakayama T. Antioxidant activity of polyphenols in carob pods. J Agric Food Chem 2002;50:373-7.
19. Marinova D, Ribarova F, Atanassova M. Total phenolics and total flavonoids in Bulgarian fruits and vegetables. J Chem Technol Metall 2005;40:255-60.
20. Pandey MM, Khatoon S, Rastogi S, Rawat AK. Determination of flavonoids, polyphenols and antioxidant activity of Tephrosia purpurea: A seasonal study. J Integr Med 2016;14:447-55.
21. Gupta D, Girija K. Evaluation of in vitro antioxidant and antimicrobial activities of various spices of Indian origin. Int J Pharm Pharm Sci 2015;7:137-41.
22. Banerjee A, Maji B, Mukherjee S, Chaudhuri K, Seal T. In vitro
antidiabetic and anti-oxidant activities of ethanol extract of Tinospora sinensis. Int J Curr Pharm Res 2017;9:42-7.
23. Di Marco G, Canuti L, Impei S, Leonardi D, Canini A. Nutraceutical properties of honey and pollen produced in a natural park. Agric Sci 2012;3:187.
24. AOAC. Official Methods of Analysis of the Association of Official Analytical Chemists. 15th ed. Washington DC: Association of Official Analytical Chemists; 1990.
25. Satyanarayanan M, Balaram V, Rao TG, Dasaram B, Ramesh SL, Mathur R, et al. Determination of trace metals in seawater by ICP-MS after preconcentration and matrix separation by dithiocarbamate complexes. Indian J Geo Mar Sci 2007;36:71-5.
26. ICH. Q2A Validation of Analytical Procedures: Text and Methodology. Geneva: International Conference on Harmonisation; 2005.
27. ICH, Q2B. Validation of Analytical Procedure: Methodology. Geneva: International Conference on Harmonization; 1996.
28. ICH. Q 1 A (R2) Stability testing of New Drug Substances and Products. Geneva: International Conference on Harmonisation; 2003.
29. Zahin M, Aqil F, Ahmad I. The in vitro antioxidant activity and total phenolic content of four Indian medicinal plants. Int J Pharm Pharm Sci 2009;1:88-95.
30. Das A, Chaudhuri D, Mandal N, Chatterjee A. Study of antioxidant and reactive oxygen species scavenging activity of the edible tuber of “greater yam”(Dioscorea alata L.) from north-east India. Asian J Pharm Clin Res 2012;5:74-84.
31. Ruch RJ, Cheng SJ, Klaunig JE. Prevention of cytotoxicity and inhibition of intercellular communication by antioxidant catechins isolated from Chinese green tea. Carcinogenesis 1989;10:1003-8. 32. Oyaizu M. Studies on products of browning reaction: Antioxidative
activities of products of browning reaction prepared from glucosamine. Jpn J Nutr 1986;44:307-15.
33. Dinis TC, Maderia VM, Almeida LM. Action of phenolic derivatives (acetaminophen, salicylate, and 5-aminosalicylate) as inhibitors of membrane lipid peroxidation and as peroxyl radical scavengers. Arch Biochem Biophys 1994;315:161-9.
34. Patil RR, Patil DB, Adnaik RS, Magdum CS. Development and evaluation of a polyherbal formulation: Saraswat ghrita. Deccan J Natl Prod 2011;2:29-32.
35. Pinheiro PF, Justino GC. Structural analysis of flavonoids and related compounds-a review of spectroscopic applications. In: Phytochemicals-a Global Perspective of their Role in Nutrition and Health. Europe: InTech. 2012.
36. Scalbert A, Johnson IT, Saltmarsh M. Polyphenols: Antioxidants and beyond. Am J Clin Nutr 2005;81:215S-7S.
37. Singh AK, Attrey DP, Naved T. Heavy metal analysis of Seabuckthorn
leaf extract. Glob J Pharmacol 2013;7:412-15.