Blind Channel Estimation and Equalization
for Multiple FIR Channels
Shiann-Jeng Yu
National Center for High Performance Computing, Hsin-Shi Tainan Country 744, Taiwan Email:[email protected]
Fang-Biau Ueng
Department of Electrical Engineering, National Chung Hsing University, 250 Kuo-Kuang Road, Taichung 402, Taiwan
Email:[email protected]
Received 15 February 2004; Revised 1 June 2004; Recommended for Publication by Xiaodong Wang
This paper deals with the problem of blind equalizations based on effective channel order determination for multiple FIR chan-nels. Most popular order determination methods use the eigenvalue decomposition (EVD) technique with an overmodeled data correlation matrix. However, performing the EVD consumes huge computation resources. In this paper, we consider the channel with infinite small leading and tailing terms which is natural for measured microwave radio channels, and develop a computa-tionally simple method for effective channel order determination. Based on multiple-shift property of a data correlation matrix, a new performance index is analyzed. The channel order is determined if the performance index is greater than a threshold. To select the threshold, we model the performance index as anF-distributed random variable. For a specified confidence level, the threshold can be found from the table. This proposed method does not require EVD, the computation load is much lower than that of the EVD-based methods.
Keywords and phrases:second-order statistics, channel equalization, channel order estimation,F-distribution.
1. INTRODUCTION
Blind adaptive equalization of multiple FIR channels with-out training data available was studied intensively in the lit-erature. Several algorithms have been developed by using the second-order statistics (SOS) [1, 2,3, 4,5,6,7,8, 9,10]. For the SOS-based algorithms, channel order is a crucial pa-rameter for computing the equalization papa-rameters. How-ever, methods for estimating the channel order are quite limited. The most popular methods for order determina-tion, for example, AIC and MDL, are developed based on the information theoretical criteria [11]. However, researches show the AIC and MDL in the measured microwave ra-dio channels are very sensitive to variations in the signal to noise ratio (SNR) and the number of data samples [12]. This prohibits their application for channel order estima-tion. Due to the nature of practical microwave radio chan-nels having long small leading and tailing channel terms, it has been shown that blind channel equalization algo-rithms should attempt to model only the significant part of the channel composed of the large impulse response terms [13]. Small leading and tailing terms being modeled in the
blind equalization algorithms in general lead to poor perfor-mance and should be avoided [13]. The number of signifi-cant part of the channel is referred to the “effective” channel order.
freedom for eigenvalue comparison. The drawback of us-ing big dimension is that the required number of sam-ples will be big too for statistical convergence of the data correlation matrix. Most EVD-based algorithms also suffer from huge computational complexity and numerical sen-sitivity due to the big dimension. Without the EVD, Ger-stacker and Taylor [14] developed a detection algorithm based on the examination of an indicator function con-structed from initial channel estimates containing an addi-tional common polynomial factor. However, its performance depends on the accuracy of the channel estimation algo-rithm.
In this paper, we develop a new detection method with-out using the EVD. The proposed method is developed based on using multiple-shift property of the data correlation ma-trix. In the blind channel equalization, the successive data vectors are not statistically independent, thus the data corre-lation matrix built from the vectors exhibits “shift property.” The shift property was first used in the SOS-based equalizer proposed by Tong et al. [1]. They proved that the channel pa-rameters can be estimated from the correlation matrix and a single-shift correlation matrix if the channel order is known. Recently, multiple shift correlation information has been no-ticed in blind equalization algorithms [8].
We analyze a channel model with infinite small leading and tailing terms and compute two multiple-shift correla-tion matrices with the shift delay index equal to and greater than the channel order. On the consideration of the worst case of the small channel parameters, we find that trace of the multiple-shift correlation matrix and its complex con-jugation can be approximately expressed in the worst case as a comparison of the first and last terms of the signifi-cant part of the channel with the small leading and tailing terms. Thus, the performance index can be used as an indi-cator for the channel order determination. The channel or-der is determined if the performance index is greater than a threshold. Utilizing the independent and identically dis-tributed (i.i.d.) assumption of the signal and white noise, the performance index is modeled as a random variable withF -distribution. Proper threshold can be determined from the table by setting a specified confidence level (CL). Unlike the EVD-based methods [11,12], the proposed method does not restrict the data correlation matrix that should be overmod-eled. The required computation load mainly comes from trace operation which is much lower than that of the EVD-based methods.
2. PROBLEM FORMULATION
Let x(t) = [x1(t) x2(t) · · · xp(t)]T be the received data vector of an array with psensor elements, where “T” rep-resents the transpose. For digitized data format,x(t) is sam-pled with the sampling rate which is not less than the symbol rate. Consider the measured microwave radio channels, there are long small leading or tailing impulse responses. To model the natural channel, this paper considers the channel with infinite long impulse responses. Therefore, the digitized data
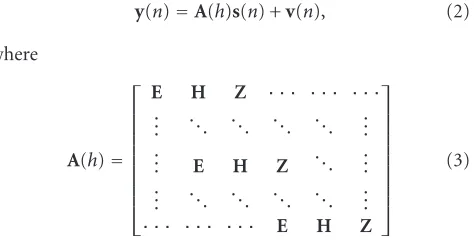
vector can be written in matrix form
x(n) tailing terms, respectively. We assume that s(n) is an i.i.d. zero-mean Gaussian sequence with E{s(i)s∗(j)} =δ(i−j), where E{·}is the expectation operation.wi(n) is assumed to be the white noise with mean zero and variance σ2
w, and wi(n) is independent ofs(n). The channel order is equal toq if there areq+ 1 significant terms ofH. It is noted that the channel order may be greater than the number of channels p. The problem in this paper is to find a method to detect the channel orderqeffectively and efficiently.
Several popular order determination methods have been proposed, such as AIC and MDL [11]. Recently, Liavas et al. developed a new detection method based on MSD of the signal and noise subspaces. These methods are based on EVD technique. In order to obtain enough degrees of freedom for eigenvalue comparison, m data samples of
x(n) are stacked to form a (pm)× 1 vector written by we assume the block Toeplitz matrix A(h) is of full rank. Let the ensemble correlation matrix of y(n) be denoted as
whereNis the number of samples. It is noted thatRy(N) is the maximum likelihood (ML) estimate ofRyin the presence ofNnumber of samples [15]. Performing the EVD, we have
Ry(N)= mp
i=1
λiυiυHi , (5)
whereλiis the eigenvalue with its corresponding eigenvector
vi. Here,λi≥λjfori < j. The detection formulas for the AIC and MDL are given by
AIC(k)= −2N(mp−k)G(k) + 2k(2mp−k),
of the EVD-based methods is to separate the correlation ma-trix into the signal subspace and noise subspace by checking the magnitude of the eigenvalues. In order to obtain better discrimination between the signal and noise subspaces, the dimension is selected to be big. As a result, these methods require much data samples to construct a converged corre-lation matrix and consume huge computation resources due to the EVD.
3. ANALYSIS OF THE MULTIPLE-SHIFT CORRELATION MATRIX
In this section, we analyze a multiple-shift correlation ma-trix of a channel model with infinite small leading and tailing terms.
3.1. Multiple-shift correlation
Instead of using stacked data vectory(n), we deal withx(n) directly. We consider the shift correlation of thex(n) vector defined byRx(k)=E{x(n)xH(n+k)}. Using (1) and simple
where(E,Z) comprises both the small leading and tailing terms of the channel. Comparing with the first and second terms,(E,Z) will be a significantly small value and can be
In (17),
traceHHH= q
i=0
hi2 (18)
is sum of the square norm of all significant part, wherehi represents 2-norm ofhi. Using (17), (14) can be rewritten as F(q+k+ 1)≤ηE+ηZ2traceHHH2. (19) In general, the parameters of the small leading and tailing terms are unknown. The above analysis shows thatF(q+k+1) reaches maximum value when the small leading coefficient matrix Ek and the small tailing coefficient matrix Zk are scalar multiples ofH. Next, consider the case ofk= −1. Us-ing (1), we have
Rx(q)=h0hHq +eq−1h0H+eq−2hH1 +· · ·+e0hHq−1 +h1zH0 +h2zH1 +· · ·+hqzHq−1+(E,Z),
(20)
where(E,Z) is a term attributed to both the small leading and tailing terms. It can be found that
F(q)=traceRxH(q)Rx(q) ≥tracehqhH0h0hHq =h02hq2.
(21)
3.2. A new performance index for channel order detection
From (9),Rx(q+k+ 1) is mainly composed of the product of the channel significant part and the small leading and tail-ing terms. As shown in (19),F(q+k+ 1) is small and not greater than|ηE+ηZ|2trace(HHH)2. On the contrary,Rx(q) is mainly composed of a product of the channel significant partsh0andhq. For order determination, the significancy of eitherh0 orhq should be compared with the small leading and tailing terms ofEkandZk. From (19) and (21), it is ob-served that if both norm values ofh0andhqare big enough, F(q) should be significantly larger thanF(q+k+ 1). There-fore,
MSC(q,k)=F F(q)
(q+k+ 1) (22)
should be a significantly large value if bothh0andhqare truly of the significant parts. Using (19) and (21), we find that
MSC(q,k)≥ h0 2
hq2
ηE+ηZtraceHHH2. (23)
Let|η0|2=h02/trace(HHH) and|ηq|2=hq2/trace(HHH), (23) can be rewritten as
MSC(q,k)≥ ηEη0ηq +ηZ
2
. (24)
Because the distribution of the small leading and tailing terms is in general unknown, we consider the worst situa-tion for analysis. The worst situasitua-tion is to make MSC(q,k) minimal when Ek = ηEHandZk =ηZH. As shown in the equation above, the MSC(q,k) is equal to the comparison ra-tio of the norms of theh0andhq with the norms of all the related small leading and tailing terms. Ifh0 andhq are big enough compared withEkandZk, MSC(q,k) should be sig-nificantly large. On the contrary, neitherh0norhqis not big enough compared withEk andZk, MSC(q,k) will not be a large enough value. That implies that eitherh0orhqor both can not be classified into the significant part of the channel. Thus, MSC(q,k) can be used as a performance index for de-termining the channel order qif the value of MSC(q,k) is greater than a threshold.
In this paper, the small leading and tailing terms ofEk andZkare seen random. TheF(q+k+ 1) fork >0 will be a random sequence. Consequently, the variation of MSC(q,k) fork >0 depends on the values ofEkandZkofF(q+k+ 1). To smooth out the influence of the individual terms ofEk andZkand to facilitate the utilization of the information, we modify (22) and define the following performance index for channel order determination:
MSC(q)= F(q)
1/(L−q) Lk=−q0−1F(q+k+ 1), (25)
whereLis a sufficiently large value.
There is no rule of thumb for selectingL. On the con-sideration of computation load and the performance, Lis suggested to be selected, for example, triple the true chan-nel order or more. In the literature, we observe that the true channel order is almost within 6 or 8 for most cases. There-fore,Lis suggested to be within 24.
Ifh0orhqare big enough, it can be recognized thatF(q) is the hypothesis termedH1andF(q) forq> qcan be seen as another hypothesis termed H0. Therefore, the detection formula is given by
MSC(q)
≥η forF(q) inH1,
< η forF(q) inH0, (26)
whereηis a detection threshold.
3.3. Threshold selection
The above analysis is based on the ensemble correlation ma-trix. In practice, the correlation matrix is calculated from fi-nite samples. For fifi-nite sample averages,F(q+k+ 1) can be expressed as
F(q+k+ 1)=trace RHx(q+k+ 1)Rx(q+k+ 1). (27) The performance index is thus given by
MSC(q)
= F(q)
For anyl, let can be seen as a Gaussian random variable with mean equals to the corresponding element ofRyfor sufficient large num-ber ofN. SinceRx(l) is an off-diagonal submatrix ofRy(N) of (4), it is the ML estimate of the correlation matrix ofRx(l),
Pi can be seen as the Gaussian random vector with mean
Pi. From [16], it is known thatgl(i) will be a noncentralχ2 random variable. TheF(l), sum of allgl(i), has the noncen-tralχ2distribution. According to the probability theory [17], MSC(q) has theF-distribution with 1 andL−qdegrees of
We summarize the proposed channel order detection procedure as follows.
Step 1. Specify a CL and find the thresholdηfrom the table. Step 2. ComputeF(q) by (27) forq=1, 2,. . .,L−1. Step 3. Calculate MSC(q) by (28) forq=1, 2,. . .,L−1; set
q=1.
Step 4. If MSC(q+1)< η(L−q−1) and MSC(q)≥η(L−q), then go toStep (5), else setq=q+ 1 and go back to the comparison ofStep (4).
Step 5. Stop the procedure.
3.4. Discussions
The EVD-based methods [11, 12] detect the channel or-der from the correlation matrix of Ry, which is with size (mp)×(mp).mis in general not small to obtain more degrees of freedom for better detection performance [12]. The re-quired computation loads of the EVD-based methods are as high asO(m3p3). Instead, the proposed MSC method deals withRx directly and the required computation is the trace operation. The computation load is ofO(Lp2), whereLcan be of the same scale ofm. Therefore, the proposed method consumes much lower computation resources than the EVD-based methods.
Recently, a novel method [14] was proposed without the EVD. The method is based on an indicator function con-structed from initial channel estimates. But its performance strongly depends on the accuracy of the channel estimation algorithm. It is noted by [14] that the channel estimation al-gorithm may yield a highly biased solution that degrades the performance. The method also requires initial guess of the channel order for computing the channel parameters. The
0 5 10 15 20 25 30 35 40
Figure1: The magnitude of the four subchannels.
proposed MSC method detects the channel order from the received data, no channel estimation algorithm is required.
4. SIMULATION EXAMPLES
In this section, computer simulations are performed to eval-uate the proposed channel order detection method. The AIC, MDL, and MSD are also performed for comparison. We con-sider the natural channel responses. We have totally 4 sub-channels, thus p = 4 in the simulation.Figure 1shows the magnitude of the four subchannels. It is noted that the chan-nels have long tailing terms. The i.i.d. QPSK signal is used as the input signal.
In the following simulations, we chooseL = 20 for the MSC method. The detection thresholds with 90% and 95% confidence levels are used for illustration. The threshold val-ues are listed inTable 1. For the AIC, MDL, and MSD meth-ods, the array multiplicitym=20 is used, the channel order is determined by q = k−m, wherekis the number mak-ing AIC(k) or MDL(k) or MSD(k)) minimal.Figure 2shows the value of the performance index in comparison with the threshold value. The input SNR is 40 dB and the number of samples used is 500. Here, the SNR is defined in this paper as SNR=20 log(1/σ2
w).
Table1: The threshold for the MSC.
L−q 1 2 3 4 5 6 7 8 9 10 11 12 13 14 15 16 17 18 19 20
90% CL 39.90 8.53 5.54 4.54 4.06 3.78 3.59 3.46 3.36 3.29 3.23 3.18 3.14 3.10 3.07 3.05 3.03 3.01 2.99 2.97 95% CL 161.4 18.51 10.13 7.71 6.61 5.99 5.59 5.32 5.12 4.96 4.84 4.75 4.67 4.60 4.54 4.49 4.45 4.41 4.38 4.35
2 4 6 8 10 12 14 16 18
Channel order 0
2 4 6 8 10 12 14 16 18 20
P
erfor
manc
e
inde
x
val
u
e
95% CL 90% CL
Figure2: The values of the performance index and the threshold under different CL. The solid curve with stars is MSC(q), the solid line is the threshold value of 90% CL, and the dashed line is the threshold of 95% CL.
0 5 10 15 20 25
Channel order 0
5 10 15 20
Output
SINR
(dB)
Figure 3: The equalization performance of the Tong subspace-based method.
channel order is 17. Constellation plots of the equalization outputs in one of the simulations are shown in Figures4and
5forq=1 andq=2, respectively.
For the sensitivity of the proposed MSC method due to variations of the SNR, we test the proposed MSC method in the input SNR range from 10 dB up to 100 dB, which covers almost all the possible value for successful equalization. The number of independent runs is 100 and the number of sam-ples used is 500. The statistical results are shown inTable 2.
−1 −0.8 −0.6 −0.4 −0.2 0 0.2 0.4 0.6 0.8 1
−1
−0.8
−0.6
−0.4
−0.2 0 0.2 0.4 0.6 0.8 1
Real part
Im
ag
inar
y
par
t
Figure 4: Constellation of the output signals using the Tong subspace-based equalizer with estimated channel orderq=1.
−1 −0.8 −0.6 −0.4 −0.2 0 0.2 0.4 0.6 0.8 1
−1
−0.8
−0.6
−0.4
−0.2 0 0.2 0.4 0.6 0.8 1
Real part
Im
ag
inar
y
par
t
Figure 5: Constellation of the output signals using the Tong subspace-based equalizer with estimated channel orderq=2.
For example, inTable 2(a), 98 runs detect the channel order q=2 and 2 runs detect the channel orderq =3 with 90% CL in the 100 independent runs. In this example, the MSD detects the channel orderq=1 for all cases. From this table, we find that the MSC method is not sensitive to variations of the input SNR.
To study the effect of a finite number of samples,Table 3
Table2: The statistical results of the proposed MSC method with different values of SNR.
SNR (dB) q 1 2 3 4
(a) The statistical results of the proposed MSC method with SNR=10 dB.
Table3: The statistical results of the proposed MSC method with differentNvalues.
and the input SNR is 40 dB. In this example, the MSD is quite stable and detectsq=1 for all cases. It is found that the pro-posed MSC method has the trend to overestimate the chan-nel order, that is,q=3. However, fromFigure 3,q=3 is still a reasonably good estimate of the channel order for the Tong subspace equalization algorithm.
5. CONCLUSION
An effective channel order detection method for blind chan-nel equalization has been presented. The order detection method use the multiple-shift correlation property of the data. A new performance index has been provided for better understanding of channel order determination. The channel order is detected if the performance index is greater than a threshold. Based on the i.i.d. assumption of the signal and noise, anF-distribution-based hypothesis testing criterion is used for threshold selection. Unlike the EVD-based methods, the proposed method does not require the EVD which con-sumes huge computation load for a big-dimension correla-tion matrix. Simulacorrela-tions show that the proposed method is not sensitive to variation of the input SNR in the test range of 10 dB up to 100 dB and could obtain stable detection prob-ability if the number of samples is not less than 300 for the proposed method with CL.
REFERENCES
[1] L. Tong, G. Xu, and T. Kailath, “Blind identification and equalization based on second-order statistics: a time domain approach,”IEEE Transactions on Information Theory, vol. 40, no. 2, pp. 340–349, 1994.
[2] E. Moulines, P. Duhamel, J.-F. Cardoso, and S. Mayrargue, “Subspace methods for the blind identification of multichan-nel FIR filters,” IEEE Trans. Signal Processing, vol. 43, no. 2, pp. 516–525, 1995.
[3] H. Liu and G. Xu, “Closed-form blind symbol estimation in digital communications,” IEEE Trans. Signal Processing, vol. 43, no. 11, pp. 2714–2723, 1995.
[4] G. Xu, H. Liu, L. Tong, and T. Kailath, “A least-squares ap-proach to blind channel identification,” IEEE Trans. Signal Processing, vol. 43, no. 12, pp. 2982–2993, 1995.
[5] Y. Hua, “Fast maximum likelihood for blind identification of multiple FIR channels,”IEEE Trans. Signal Processing, vol. 44, no. 3, pp. 661–672, 1996.
[6] M. Tsatsanis and Z. Xu, “Constrained optimization methods for direct blind equalization,” IEEE Journal on Selected Areas in Communications, vol. 17, no. 3, pp. 424–433, 1999. [7] J. Mannerkoski and D. P. Taylor, “Blind equalization using
least-squares lattice prediction,”IEEE Trans. Signal Processing, vol. 47, no. 3, pp. 630–640, 1999.
[8] D. Gesbert, P. Duhame, and S. Mayrargue, “On-line blind multichannel equalization based on mutually referenced fil-ters,” IEEE Trans. Signal Processing, vol. 45, no. 9, pp. 2307– 2317, 1997.
[9] L. Tong and Q. Zhao, “Joint order detection and blind channel estimation by least squares smoothing,” IEEE Trans. Signal Processing, vol. 47, no. 9, pp. 2345–2355, 1999.
[10] Q. Zhao and L. Tong, “Adaptive blind channel estimation by least squares smoothing,” IEEE Trans. Signal Processing, vol. 47, no. 11, pp. 3000–3012, 1999.
[11] M. Wax and T. Kailath, “Detection of signals by information theoretic criteria,” IEEE Trans. Acoustics, Speech, and Signal Processing, vol. 33, no. 2, pp. 387–392, 1985.
[12] A. P. Liavas, P. A. Regalia, and J.-P. Delmas, “Blind channel approximation: effective channel order determination,”IEEE Trans. Signal Processing, vol. 47, no. 12, pp. 3336–3344, 1999. [13] A. P. Liavas, P. A. Regalia, and J.-P. Delmas, “Robustness of
least-squares and subspace methods for blind channel identi-fication/equalization with respect to effective channel under-modeling/overmodeling,” IEEE Trans. Signal Processing, vol. 47, no. 6, pp. 1636–1645, 1999.
[14] W. H. Gerstacker and D. P. Taylor, “Blind channel order esti-mation based on second-order statistics,”IEEE Signal Process-ing Letters, vol. 10, no. 2, pp. 39–42, 2003.
[15] R. Monzingo and T. Miller, Introduction to Adaptive Arrays, John Wiley & Sons, New York, NY, USA, 1980.
[16] D. Dlugos and R. Scholtz, “Acquisition of spread spectrum signals by an adaptive array,” IEEE Trans. Acoustics, Speech, and Signal Processing, vol. 37, no. 8, pp. 1253–1270, 1989. [17] P. Hoel, S. Port, and C. Stone,Introduction to Probability
The-ory, Houghton Mifflin Company, Boston, Mass, USA, 1971.
Shiann-Jeng Yu received the Ph.D. de-gree from the National Taiwan Univer-sity in electrical engineering in 1995. From October 1995 to December 2001, he was with National Space Program Of-fice (NSPO) of Taiwan as an Associate Re-searcher. From January 2001 to July 2002, he was with the National Science Coun-cil (NSC) as a Specialist Secretary of Vice Chairman Office. Since August 2002, he
Fang-Biau Ueng received the Ph.D. degree in electronic engineering from the National Chiao Tung University, Hsinchu, Taiwan, in 1995. From 1996 to 2001, he was with National Space Program Office (NSPO) of Taiwan as an Associate Researcher. From 2001 to 2002, he was with Siemens Telecommunication Systems Limited (STSL), Taipei, Taiwan, where he was involved in the design of