Indian plate kinematic studies by GPS-geodesy
E. C. Malaimani1, James Campbell2, Barbara G¨orres2, Holger Kotthoff2, and Stefan Smaritschnik2
1National Geophysical Research Institute (NGRI), Hyderabad 500007, India 2Geod¨atisches Institut der Universit¨at Bonn (GIUB), Nußallee 17, D-53115 Bonn, Germany
(Received December 28, 1999; Revised May 19, 2000; Accepted May 22, 2000)
Amongst various space techniques, GPS-geodesy has proved to be an indispensible tool worldwide for geody-namics and the determination of parameters governing seismotectonics. To study the Indian plate kinematics, an IGS station has been established in September 1995 at NGRI, Hyderabad, India, under the Indo-German collaborative research programme. During the first off-line data transmisssion phase, about one to two days per week of obser-vations were taken. The data analysis has been carried out at the University of Bonn using the Bernese Software version 4.0. The Hyderabad data have been processed together with the data from 8 other selected IGS stations in and around the Indian plate. In our preliminary analysis, which concentrated on the ITRF96 frame-consistent part of the data set, we found the motion of the Indian plate with respect to the Eurasian plate to be significantly smaller than the model rate, i.e. 3.7 cm/y for Hyderabad instead of 4.5 cm/y in the NUVEL-1A plate model. We detected no significant motion between Hyderabad and Bangalore, lying 500 km apart in N-S-direction on the Indian plate.
1.
Introduction
The lofty Himalayas, which stretch 2900 km along the border between India and Tibet are the visible creations of plate tectonic forces. The most dramatic effect of the mov-ing Indian plate on its continental region is manifested at the Himalayan collision boundaries. The high elevations of the Himalaya and Tibet result from the continuing collision between India and Asia, which started more than 60 million years ago (Molnar, 1984). Global plate models (DeMetset al., 1994) predict that approximately 5.0 cm/y of northward directed convergence is taken up between India and Eurasia. Models of current plate motions have been estimated for almost 20 years using spreading rates at mid ocean ridges, transform fault azimuths and plate boundary earthquake slip vectors (DeMets et al., 1990). Early in the development of plate tectonics it was recognized that plate boundaries in continental areas are substantially wider than those in oceanic plates.
From geological and seismic studies of the slip rate of faults in Asia, it is believed that approximately one third of the present day convergence rate between India and Asia is re-sponsible for the shortening and uplift as well as the moderate seismicity of the Himalayas. To accommodate this conver-gence, studies by Avouac and Tapponnier (1993), England and Molnar (1997) and Molnar (1987) have explained that some part of the India and Eurasia collision is taken up by strike slip faulting in Asia, with corresponding eastward dis-placement or extrusion of Tibet and Southern China. Crustal thickening evidenced in the∼5 km average elevation of the Tibetan plateau and a crustal thickness of∼70 km repre-sents the convergence clearly (Larsonet al., 1999).
Geody-Copy right cThe Society of Geomagnetism and Earth, Planetary and Space Sciences (SGEPSS); The Seismological Society of Japan; The Volcanological Society of Japan; The Geodetic Society of Japan; The Japanese Society for Planetary Sciences.
namic models of this region heavily depend on these factors whether it is crustal thickening or lateral extrusion (England and Houseman, 1986; Roydenet al., 1997).
Many of these questions could be resolved if precise mea-surements of surface deformation throughout the plate boundary region were available. Amongst various space techniques, GPS-Geodesy has proved to be an indispensi-ble tool worldwide for geodynamics and the determination of parameters governing seismotectonics as well as to quan-tify continental deformation to a precision of a few mm/y. With the successful operation of the International GPS Ser-vice (IGS) and its global network and as a participant in the GPS global campaign we will focus this paper on the modal-ities used to study the Indian plate kinematics using GPS.
2.
Observations and Data Processing
In September 1995, a GPS tracking/reference station de-signed to become an operational IGS permanent station has been established at NGRI, Hyderabad, by installing a Tur-boRogue SNR-8000 receiver under the Indo-German collab-orative research programme. Since then, an off-line data transfer to the University of Bonn has been implemented and data from 1995 onwards is being archived and available at NGRI, Hyderabad as well. Recently, an ftp-link has been established for daily data transfer, which will become oper-ational early in 2000.
The GPS processing using the Bernese Software version 4.0 (Rothacher and Mervart, 1996) was carried out at the Uni-versity of Bonn. A first data set for the data up to January 1997 was prepared and a first network solution was carried out to estimate baselines between Hyderabad and other se-lected stations which are located in and around the Indian plate.
Our aim in this study was to include all the data so far acquired at Hyderabad from September 1995 to August 1998,
Fig. 1. Temporal baseline length evolution for Hyderabad–Bangalore.
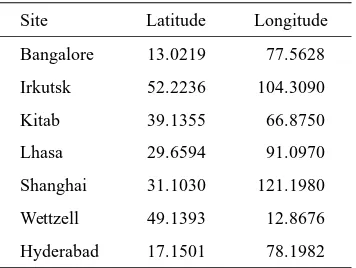
Table 1. Stations used in our solutions.
Site Latitude Longitude
Bangalore 13.0219 77.5628
Irkutsk 52.2236 104.3090
Kitab 39.1355 66.8750
Lhasa 29.6594 91.0970
Shanghai 31.1030 121.1980
Wettzell 49.1393 12.8676
Hyderabad 17.1501 78.1982
but for the sake of computing time only one day of data per week was eventually included. We used the Bernese Processing Engine (BPE) to process the still large amount of data for 3 years from all the selected IGS stations (Bangalore, Yaragadee, Hartebeesthoek, Wettzell, Lhasa, Kitab, Irkutsk and Shanghai) (Table 1). No data decimation on the 30 sec sampling rate was made, i.e. all of the original data were retained for the processing.
For the network solution, we developed the following strategies (Campbell and Malaimani, 1998):
i) IGS precise orbits: the accuracy is about±0.06 m ii) 4 tropospheric parameters/day
iii) elevation cutoff at 20 degrees iv) no ambiguityfixing
v) reference frames: for our study we have adopted the ITRF94 reference frame (Boucheret al., 1996) to analyse the data from 1995 to 1996. By January 1997, the ITRF96 refer-ence frame was available to the global users by IERS, hrefer-ence we used ITRF96 site coordinates and velocities to process the data from 1997 to 1998 (Boucheret al., 1998). During processing, we realized that the small shifts and rotations be-tween successive ITRF realizations could not be neglected.
Therefore we carried out two solutions, one covering the en-tire period of September 1995 to August 1998 and a second one concentrating only on the data of January 1997 to August 1998, when the ITRF96 was valid for the IGSfinal orbits.
vi)fiducial free strategy: in order to minimize the con-straints and gain an independend insight in the integrity of our results we decided tofix only the station of Wettzell on the Eurasian plate. In this way, our network solution pro-vides the motions of all of the other stations referred to the stable part of Eurasia and the IGS orbital frame.
3.
Results and Discussion
Using the above strategies, the network solution was car-ried out. We estimated the baseline vectors and the rate of change of baseline lengths from Hyderabad to the other IGS stations, as well as velocity vectors for all stations involved in the analysis (relative to Wettzell).
The overall result of this analysis is that the estimated baseline lengths between Hyderabad and other IGS stations beyond the Himalayas are indeed shortening. They clearly indicate the effect of the northward trend of he motion of the Indian plate.
The effect of the transition between the ITRF94 and ITRF96 frames can be seen quite clearly in the baseline length evolution plots (Figs. 1 to 3) and even more so in the coordinate evolution plots (not shown here). Before hav-ing established proper transformations to account for this transition we decided to confine our vector solution to the consistent data period from January 1997 to August 1998 of the ITRF96. The estimated baseline rates are shown for both the entire period as well as for the ITRF96 consistent period (Table 2).
When applying the linearfit to the baseline length results of the individual epochs, several common features emerged throughout the estimation:
Fig. 2. Temporal baseline length evolution for Hyderabad–Irkutsk.
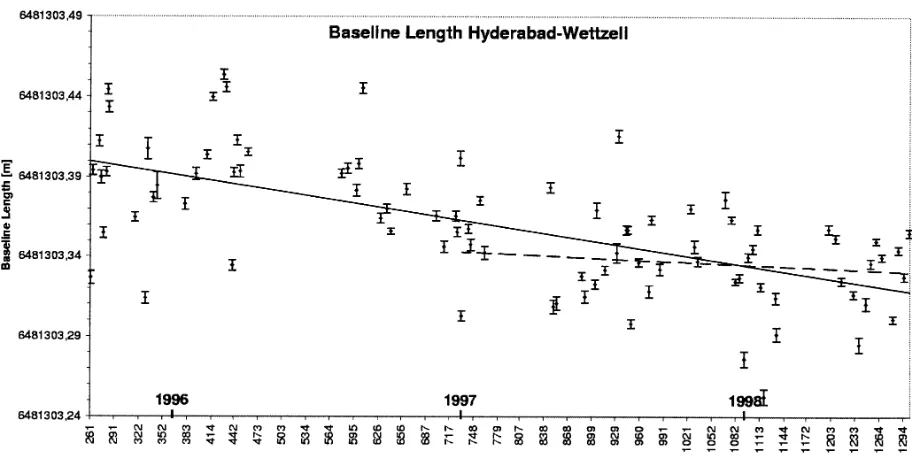
Fig. 3. Temporal baseline length evolution for Hyderabad–Wettzell.
attests the presence of unmodelled errors, probably of tropo-spheric origin.
2) The increase of both types of errors follows the em-pirical error relationσ2 = A2+B2·L2 withA =0.5 cm and B = 10−8 (Lichten, 1990). In fact, if we discard the isolated long baseline to Yaragadee the coefficientBcomes very close to 0.6·10−8.
3) The difference in the rates derived from the two so-lutions highlights the importance of the use of a consistent frame in the analysis of large networks.
Looking at the individual results from the 1997 to 1998 data, there are several significant insights to be gained:
HYDERABAD to BANGALORE (Fig. 1): The temporal change of this Indian baseline of 500 km length is only+0.3
cm/y with an rms scatter of±0.5 cm, which indicates a high level of inner plate stability. This value provides afirst con-straint on the stability of the Indian plate in its central and southern part.
HYDERABAD to IRKUTSK (Fig. 2): This baseline stretches far north into the more stable part of the Eurasian plate and shows a consistent shortening rate of−3.1 cm/y. With an rms about the linearfit of±1.5 cm and no systematic variations over time, this determination holds a high degree of reliability.
HYDERABAD to LHASA: The low rate of shortening of
−0.6 cm/y confirms the heavy involvement of this part of southern Tibet in the Indo-Eurasian collision zone.
Table 2. Estimated baselines from Hyderabad and their rates of change for the total time span (September 95–August 98) and the ITRF96 period (January 97–August 98).
From baseline length ITRF94/96 ITRF94/96 ITRF96 ITRF96 Hyderabad at ref. epoch rate of change rms scatter rate of change rms scatter
to 6th March 1997 [cm/y] [cm] [cm/y] [cm]
Bangalore 497,625.797 −0.2 ±0.5 +0.3 ±0.5
Shanghai 4,459,795.268 −1.2 ±2.3 −2.2 ±2.0
Lhasa 1,856,738.483 −0.9 ±0.9 −0.6 ±0.9
Irkutsk 4,381,644.341 −5.0 ±1.9 −3.1 ±1.5
Kitab 2,640,353.581 −3.0 ±1.1 −1.9 ±1.2
Wettzell 6,481,303.421 −2.9 ±3.2 −0.3 ±3.2
Yaragadee 6,208,968.830 +2.1 ±9.3 +4.0 ±9.9
Fig. 4. Velocity vectors from GIUB (Bonn) and IGS solution.
baseline of 6500 km shows a very good repeatability with an rms of only±3 cm. It does not show any significant change in the period of the ITRF96.
In our post-fit analysis we obtained a preliminary velocity solution in the NUVEL-1 frame, i.e. in a No-Net-Rotation (NNR) reference frame (DeMetset al., 1994) by applying linearfits to the site-coordinate time series. The NUVEL-1 frame is also used to constrain the IGS and ITRF solutions (Boucheret al., 1994, 1996). Because our intention was to
study the Indian plate motion with respect to a Eurasia-fixed frame, we transformed the velocities to this frame by sub-tracting the Eurasian (NUVEL) plate rotation. To compare our solution with the IGS solution for the ITRF96 we show both vectors for all points except Hyderabad (Fig. 4). For the Eurasian stations of Kitab and Irkutsk as well as for Ban-galore the agreement with IGS is quite good whereas larger differences appear at the stations of Lhasa and Shanghai.
with respect to Eurasia turns out to be 3.7±0.2 cm/y in NNE direction, which is significantly smaller than the NUVEL motion of 4.5 cm/y. This motion is virtually the same for both stations Hyderabad and Bangalore (Fig. 4).
4.
Conclusions
We have analyzed 3 years of GPS data from September 1995 to August 1998 involving the new site of Hyderabad on the Indian plate. Although our frame-consistent solution only covers 1.5 years of data we were able to determine the rate of movement of the Indian plate. Thefiducial free solu-tion also provides an unconstrained insight in the kinematics of the other sites included in the analysis. The linear fits of the baseline lengths yield highly significant shortenings between India and Eurasia of up to−3.1 cm/y. The Indian baseline Hyderabad–Bangalore shows no significant defor-mation over this relatively short time span.
The site velocities from our preliminary solution (with only Wettzellfixed) in general show a good agreement with the NUVEL-1A geological averages, although our GPS based rates for the two sites on the Indian plate of 3.7 cm/y (relative to Eurasia) are significantly smaller than the corre-sponding NUVEL rates of 4.5 cm/y. However, the reduced rate of 3.7 cm/y appears to be in perfect agreement with the recently revised velocity of 3.7 cm/y in the plate model de-scribed by Gordonet al.(1999).
Acknowledgments. The authors are thankful to Dr. Harsh K. Gupta, Director, NGRI, HYDERABAD for his continued support for this project right from the start. This project is being funded by the Indo-German Collaborative project under International Scien-tific CSIR-DLR bilateral exchange programme.
References
Avouac, J. P. and P. Tapponnier, Kinematic model of active deformation in Asia,Geophys. Res. Lett.,20, 895–898, 1993.
Boucher, C., Z. Altamimi, M. Feissel, and P. Sillard, Results and analysis of the ITRF94,IERS Technical Note 20, Paris, 1996.
Boucher, C., Z. Altamimi, and P. Sillard, Results and analysis of the ITRF96,
IERS Technical Note 24, Paris, 1998.
Campbell, J. and E. C. Malaimani, Estimation of very long baselines by GPS geodesy for Indian plate kinematic studies, Technical Report No. NGRI-98-SEIS-235, 1998.
DeMets, C., R. G. Gordon, D. F. Argus, and S. Stein, Current plate motions,
Geophys. J. Int.,101, 425–478, 1990.
DeMets, C., R. G. Gordon, D. F. Argus, and S. Stein, Effect of recent revisions to the geomagnatic reversal time scale on estimates of current plate motions,Geophys. Res. Lett.,21, 2191–2194, 1994.
England, P. C. and G. A. Houseman, Finite strain calculation of continen-tal deformation, 2, Comparison with the India-Asia collision zone, J. Geophys. Res.,91, 3664–3676, 1986.
England, P. C. and P. Molnar, Active deformation of Asia: From kinematics to dynamics,Science,278, 647–650, 1997.
Gordon, R. G., D. F. Argus, and M. B. Heflin, Revised estimate of the angular velocity of India relative to Eurasia,Supplement to EOS Transactions, AGU, Vol. 80, No. 46, p. F273, 1999.
Larson, K. M., R. Burgmann, R. Bilham, and J. T. Freymueller, Kinematics¨ of the India—Eurasia collision zone from GPS measurements,J. Geo-phys. Res.,104, 1077–1093, 1999.
Lichten, S. M., High accuracy global positioning system orbit determination: Progress and prospects, inGlobal Positioning System: An Overview, IAG Symposium No. 102, edited by Y. Bock and N. Leppard, pp. 146/164, Springer, New York, 1990.
Molnar, P., Structure and tectonics of the Himalaya: Constraints and impli-cations of geophysical data,Annu. Rev. Earth Planet. Sci.,12, 489–518, 1984.
Molnar, P., Inversion of profiles of uplift rates for the geometry of dip-slip faults at depth, with examples from the Alps and Himalaya,Ann. Geophys.,5, 663–670, 1987.
Rothacher, M. and L. Mervart (Eds.), Bernese GPS Software Version 4.0 Reference Manual, Berne, 1996.
Royden, L. H., B. C. Burchfiel, R. W. King, E. Wang, Z. Chen, F. Shen, and Y. Liu, Surface deformation and lower crustalflow in eastern Tibet,
Science,276, 788–790, 1997.