Volume 2006, Article ID 21297, Pages1–23 DOI 10.1155/WCN/2006/21297
Cross-Layer Design and Analysis of Downlink Communications
in Cellular CDMA Systems
Jin Yuan Sun, Lian Zhao, and Alagan Anpalagan
Department of Electrical and Computer Engineering, Ryerson University, Toronto, ON, Canada M5B 2K3
Received 1 October 2005; Revised 10 March 2006; Accepted 19 May 2006
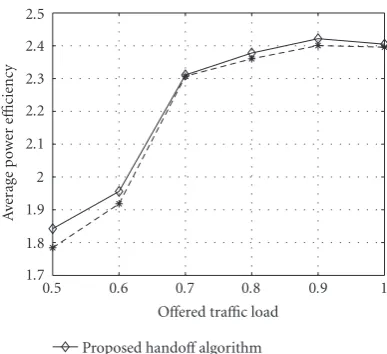
A cellular CDMA network with voice and data communications is considered. Focusing on the downlink direction, we seek for the overall performance improvement which can be achieved by cross-layer analysis and design, taking physical layer, link layer, network layer, and transport layer into account. We are concerned with the role of each single layer as well as the interaction among layers, and propose algorithms/schemes accordingly to improve the system performance. These proposals include adaptive scheduling for link layer, priority-based handoffstrategy for network admission control, and an algorithm for the avoidance of TCP spurious timeouts at the transport layer. Numerical results show the performance gain of each proposed scheme over independent performance of an individual layer in the wireless mobile network. We conclude that the system performance in terms of capacity, throughput, dropping probability, outage, power efficiency, delay, and fairness can be enhanced by jointly considering the interactions across layers.
Copyright © 2006 Jin Yuan Sun et al. This is an open access article distributed under the Creative Commons Attribution License, which permits unrestricted use, distribution, and reproduction in any medium, provided the original work is properly cited.
1. INTRODUCTION
With the growing demand and popularity of high-speed data applications in wireless networks, the system capacity and bandwidth resource become increasingly stringent. Radio re-source management plays a key role in wireless system design and analysis. Research efforts are made to expand the capac-ity and to efficiently allocate the resource. Some of the efforts include the evolution of the CDMA technology. For example, 3G (third generation) and 3G+ (beyond 3G) CDMA systems (i.e., WCDMA and CDMA2000) are superior to 2G CDMA systems (IS-95) in that the former ones have higher carrier bandwidth and faster power control frequency (more precise channel feedback). On the other hand, some efforts focus on the algorithm design which can be implemented in the soft-ware to optimize the system performance. As the research on 3G and 3G+ CDMA systems emerges, and although count-less works have contributed to this research area, there still remain a great number of problems unsolved. In this paper, we would like to share our ideas to approach some of the problems in this field. We choose to focus on the cross-layer design of the CDMA networks as this issue has recently been capturing interests.
The traditional wireless networks mainly support voice service without data service provided through the Internet backbone. However, the integration of the wireless network
and the wired backbone is of great importance today because of the increasing data application requirement at the mo-bile terminal (e.g., cellular phone and wireless laptop). While most previous research was on the performance optimization of individual layer, it often leads to performance degrada-tion of other layers or suboptimal system performance. The hierarchical structure of the wireless networks, as the wired ones, facilitates us to design and study protocols for the sin-gle layer that is of particular interest since these layers (phys-ical layer, link layer, network layer, transport layer, and appli-cation layer) are transparent to one another. But this isola-tion may cause suboptimal system performance. Recent re-search has shown that a well-designed cross-layer approach that supports multiple protocol layer adaptivity and opti-mization can yield significant performance gains [1]. Many researchers use the cross-layer approach for their designs. However, these designs can be very different due to various combinations and interactions of multiple layers.
consumption. Yu and Krishnamurthy [3] focus on cross-layer QoS (quality-of-service) guarantee by combining phys-ical layer SIR (signal-to-interference ratio) and network layer blocking probability to reduce computational complexity and approximate the optimal solutions. Other works are also found to address physical/network cross-layer optimization issues [9,10]. Price and Javidi [4] deal with the interaction between congestion (transport layer) and interference (MAC layer), and integrate them into a single protocol by means of rate assignment optimization. Friderikos et al. [5] interpret the rate adaptation as TCP-related since the rate in this paper is defined as the ratio of the current congestion window and RTT (round-trip-time) of the connection, and jointly con-siders it with physical layer (power). Hossain and Bhargava [6] model and analyze the link/PHY level influence on TCP behavior and illustrate their dependency. Yao et al. [7] study the reverse and forward link capacities balancing issue by covering link layer and the network layer to seek for optimal handoffprobability. Chan et al. [8] propose a joint source coding power control and source channel coding, and inter-pret them as the MAC-layer power control and application-layer source coding, respectively, maximizing the delivered service quality and minimizing the resource consumption. There are also additional attention on other aspects of cross-layer design, such as to decrease the cross-cross-layer interference [11] instead of optimization.
The above survey indicates that different interpretations of “cross-layer” and resources belonging to these layers pro-duce a variety of cross-layer studies. While existing works address cross-layer issues based on two or three layers, we propose to fully address this issue by taking the four impor-tant layers into account: physical layer, link layer, network layer, and transport layer. We design algorithms/protocols for each of these layers by considering their communications and mutual impacts to prevent isolation thus improving the overall performance. At the physical layer, two fundamental techniques, power control and rate allocation, are studied. The proposed integrated power control and rate allocation is briefly introduced which is primarily used for the link-layer scheduling and is demonstrated in detail in the follow-ing schedulfollow-ing schemes. At the link layer, a novel voice packet scheduling scheme named modified adaptive priority queu-ing (MAPQ) and a unified framework (UF) for schedulqueu-ing hybrid voice and data traffic are proposed. An adaptive prior-ity profile is defined in these schemes based on queuing delay and physical layer information such as required transmission power, and available transmission rate, which borrows the idea of composite metric from wired systems. Estimation er-ror is considered when measuring received pilots at mobile stations. For MAPQ, this definition ensures system capacity improvement, packet dropping probability reduction, and fairness. Users are allocated resources according to their pri-orities in a modified PQ fashion constrained by total power budget of base stations. For UF, we address the consistency of the framework as well as the distinctions of voice and data scheduling processes by discussing the common policy and individual requirements of both classes. With this design, the proposed algorithm accomplishes system performance
enhancement while retaining separate performance features without degradation. The uniformity of the proposed frame-work not only simplifies the implementation of the schedul-ing algorithms at base stations, but also is verified to be ro-bust and resistant to various offered traffic load and variable service structure (voice/data proportion). At network layer, we propose an adaptive prioritizing soft handoffalgorithm for concurrent handoffrequests aiming at a same cell. A pre-dicted set, an adaptive priority profile jointly exploiting the impact of required handoffpower, and call holding time have been developed to realize the proposed algorithm. A link-layer scheduler residing in each base station to ensure the desired operation of the prioritizing procedure is also de-signed, with input information from network layer. At trans-port layer, we study the problem of TCP over wireless link and summarize the solutions for this problem from exten-sive research works. We design an algorithm to prevent the spurious timeouts at TCP sources caused by the stochastic intervals of wireless opportunistic scheduling.
The rest of this paper is organized as follows.Section 2 il-lustrates the system model based on which this research is carried out. The main body consists of Sections 3,4, and
5, where we propose strategies for LINK/PHY (link/physical layer), NET/LINK/PHY (network/link/physical layer), and TRANS/NET/LINK (transport/network/link layer), respec-tively, and study their interactions. Section 6gives out the simulation environment and the performance evaluation/ analysis of the proposed cross-layer design. FinallySection 7
concludes this paper with primary contributions, open issues and certain limitations.
2. SYSTEM MODEL
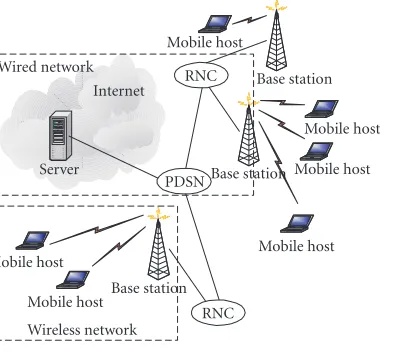
We concentrate on a cellular WCDMA system with wrap-around cell structure, as shown in Figure 1, where mobile stations (MSs) select serving base stations (BSs, displayed as pentagrams) based on the measured strength of pilot signals (Pp) sent out periodically by BSs. Typically, 20% of the
down-link total power will be assigned to pilot channel by each BS. The rest of the total power is shared by traffic channel and an other control channel (carries control information, power control symbols, etc.).
In forward link (downlink), BSs transmit packets to MSs through traffic channels which consist of frames. Each frame is of a 10 ms length and is subdivided by 15 time slots within one of which traffic destined for one specific MS is delivered. To guarantee that MSs receive packets correctly, the transmission power allotted by BSs has to overcome chan-nel impairments, which consist of path loss (dib/d0)−α,
shad-owinge−(βXb), and Rayleigh (fast) fading using Jakes’ fading model [12], wheredibis the distance between the MS and the
BS,d0is the reference distance,αis the path loss exponent,
β=ln 10/10 is a constant, andXb is a Gaussian distributed
shadowing (in cellb) random variable with zero mean and varianceσX2.
Figure1: A typical cellular structure with base stations.
transmission power of BSs. Thus theEb/I0(bit energy to in-terference density ratio), received at each mobileifrom its home BSb, is expressed as
γi=Γ PiGbi
PT−Pi
Gbi+
j=bPTGji, (1)
whereΓ=W/Ris the spreading gain withWthe spread spec-trum bandwidth andRthe required packet transmission rate.
PiandPT (inWatt) denote the transmission power for user iand total downlink transmission power of BSs, respectively, assuming BSs are transmitting at the maximum capacity al-ways.Gi∗denotes signal attenuation (reciprocal to link gain) of the channel between useriand BS∗. During each time slot, MSicompares the receivedγiwith targetEb/I0γ∗ and generates the power control command informing its serving BS to increase or decrease the transmission power. Note that unlike [13] and many others of its kind, we consider mul-tipath fading as part of the channel impairments instead of using an orthogonality factor (OF) in (1). Authors of [13] argue that OF is defined as the fraction of received downlink power converted by multipath into multiaccess interference. They consider only the path loss as the channel impairment and include an OF to reflect the multipath impairment. Since the multipath impairment is reflected by fast fading, we do not employ OF here.
In reality, however, limited measuring ability of MSs can introduce an erroneous estimation of received pilots, which results in errors in measuringGi∗(obtained from measuring pilot signals). We approximate the sum of measurement er-rors as log-normally distributed as indicated in [14]. LeteβYib denote the measurement error of the measured value, where
Yibis a Gaussian distributed random variable with zero mean
and a variance ofσY2. As a result, the actual received SIR for
each MS is derived from the following revised version of (1) counting errors:
γi=Γ Pi/PT
1−Pi/PT
+e−βYibj=bGji/Gbi. (2)
3. LINK-LAYER PACKET SCHEDULING (LINK/PHY)
Packet scheduling is a promising link-layer management mechanism. More and more research [15,16] on this tech-nique has emerged. However, existing algorithms focus on data scheduling with little or no concern on voice. The time-varying nature of wireless channels determines the impor-tance of voice scheduling. Voice dropping is less likely to come from congestion than data dropping due to its higher priority. Nevertheless, voice traffic is prone to suffer a deep-fading channel and consumes a large amount of limited base station power, thus must be scheduled properly. In the first part of this section, we propose a novel voice scheduling scheme named modified adaptive priority queuing (MAPQ) for forward link in a wireless cellular WCDMA environment. An adaptive priority profile is defined in the scheme based on queuing delay and required transmission power, which borrows the idea of composite metric imported by IGRP (in-terior routing protocol) and EIGRP (enhanced IGRP) from wired networks.
Next, we present a unified packet scheduling framework (UF) to include data traffic and demonstrate the easy inte-gration and general adaptability of MAPQ to the UF.
TheEb/I0used here is the same as (1) except thatRin Γ = W/Rhere,R ∈ {Rv,Rd}, is the required transmission
rate of voice or data packets. The actual receivedEb/I0 for each MS takes the form of (2).
For link-level scheduling implementation, each BS has a scheduler to regulate incoming hybrid traffic, and arrange packets aimed for MSs in a specified sequence depending on the logic of the scheduler. The scheduler implemented in BSs is sketched inFigure 2, whereQV1andQV2denote voice queues whileQD1andQD3denote data queues.
3.1. Integrated power control and rate allocation
We propose to use physical-layer information power/rate as the input for link-layer scheduling (LINK/PHY).
Fast closed-loop power control (CLPC) is applied to our scheme in the downlink to optimize the system performance. The merit of CLPC has two aspects compared to the alterna-tive open-loop power control (OLPC).
(1) Under relatively good channel conditions, where fast fading is not severe, the transmission power for mobiles from the base station can be kept to the minimum required level to satisfy the SIR at all times since CLPC performs faster than channel fading rate. Thus, CLPC is able to compensate medium to fast fading and inaccuracies in OLPC [17]. As a result, more transmission power of the base station remains for voice users that are either far away from the base station or in a difficult environment, and data users, giving rise to enhanced system capacity and data throughput in multime-dia networks.
Voice queueQV1
Voice queueQV2
Data queueQD1
. . . Data queueQD3
Voice output queue after sorting
Data output queue after sorting
Allocated first
Allocated after
Output queue after allocation
Figure2: Base station scheduler structure for scheduling framework.
Whereas our approach CLPC solves this problem because the transmission power is always adjusted accordingly to satisfy the QoS requirement.
Single-code variable spreading gain (VSG) rate alloca-tion technique is applied to our scheme, as demonstrated later, to adjust the transmission rate when the satisfaction cannot be achieved by power adaptation only. According to the calculation of the transmission rate Rafter spreading,
R = W/Γ, where W andΓrepresent the spread spectrum bandwidth and the spreading gain, respectively, the actual transmission rate that is obtained can be adjusted by diff er-ent values ofΓ, given the fact thatWis a constant. Typically, in the WCDMA standard,Γ∈ {4, 8, 16, 32, 64, 128, 256, 512}. The actual value assigned toΓdepends on the transmission rate demanded. Note that Ris inversely proportional toΓ. When we select a smaller Γ, we will obtain a largerR, and vice versa.
The way that we combine power and rate for our schedul-ing scheme is to first adjust power with a fixed rate to the point that the change of power no longer produces any effect on the scheme (seeSection 3.2.2). Then the power is fixed and the spreading gain will be adjusted to obtain the satis-factory transmission rate and to fulfill the predefined goal. More details will be given in the description of the voice/data framework.
3.2. MAPQ and UF
3.2.1. Voice only: MAPQ
In general, MAPQ has two subprocesses: sorting and alloca-tion. The operation of MAPQ scheme and its subprocesses is demonstrated as follows.
MAPQ scheduler sorts incoming traffic into high- (QV1)
and low- (QV2) priority queues based on each packet’s
cal-culated priority value, which is evaluated by jointly consid-ering required power and buffering delay as APi = a ∗
delaynori +b/powernori , where APi denotes the adaptive
pri-ority for packet i. delaynori and powernori are the normal-ized buffering delay and the normalnormal-ized required power of packeti, respectively. The buffering delay is defined as the time interval of the arrival and departure of a packet. For simplicity, the calculation time of the scheduler is neglected
for all packets in the simulation. Zero buffering delay means that the packet gets served in the first round upon arrival. Let delayi Vthre denote the buffering delay of packet i, the delay threshold of voice beyond which voice packets en-ter QV1. This step is implemented in the scheduler pro-gramming. It does not indicate the actual packet move-ment in the memory where the queues locate. Let poweri and powermean denote the required transmission power of packeti, and the mean downlink transmission power of ac-tive users in one cell. Then we have delaynori =delayi/Vthre, and powernor
i =poweri/powermean. The way to normalize the delay and power components in the AP expression ensures the two terms in AP (a∗delaynori ,b/powernori ) comparable. Parametersaandbare the adaptive factors determining the weight of delay over power (wdp, in our case voice is delay sensitive thus a larger wdp should be assigned). The smaller required power (the better channel condition), or the larger delay, yields the higher priority (AP). The way to define the priority profile ensures users with better channels and larger delays to get served first, thus increases the throughput, re-duces the voice packet dropping probability, and guarantees the fairness which is measured by the mean delay in the net-work.
MAPQ scheduler then allocates resources starting from
QV1 according to AP values and total transmission power budget of BSs. The scheduler does not terminate even if the user currently being served inQV1requires a power exceed-ing the remainexceed-ing budget. Since each user’s priority depends on both delay and power, higher priorities do not merely in-dicate smaller powers. Also, afterQV1has been fully checked and if there is power remaining (Pr), the scheduler will
con-tinue to checkQV2and serve available users inQV2usingPr.
This is the major difference between MAPQ and classic PQ. A similar concept can be found in [18], where the authors pro-posed a modified FIFO scheme for power-constraint systems. This modified queuing fashion can lead to higher-power uti-lization efficiency, as will be shown later.
3.2.2. Unified voice/data framework: UF
among classes. It is apparent that voice class has higher prior-ity than data class, which necessitates the employment of the proposed allocation algorithm (modified PQ) for each voice queue to secure the scheduler not skipping to data class be-fore completing checkup within voice class. However, classic priority queuing scheduler will not jump to data users until all the voice users have been served. It may cause power waste if none of the users in voice queues but some of the users in the data queue can be served. The proposed allocation algo-rithm further improves system capacity and throughput by also performing an exhaustive search within data class after an exhaustive search within voice class. We do not repeat the similar part of scheduling in terms of sorting and allocation for data traffic but would like to emphasize the discrepancy of data scheduling (sorting and allocation) as follows.
Difference in sorting mainly lies in the expression of adaptive priority profile. We have for data
APi=a∗delaynori +b/powernor
i +c/ratenori , (3)
where APidenotes the adaptive priority for packeti, anda, b, andcare adaptive constants. Voice and data have different
a,b, andcvalues. Note that “ratenor
i ” denotes the normalized
new required transmission power after decreasing the data rate, using (1), whereΓ=W/Rd. The normalization method
is similar to that used for voice power normalization. Here we use “ratenor
i ” in order to distinguish from powernori in the
AP expression. Furthermore, “ratenor
i ” is used to emphasize
that the new required transmission power is obtained by ad-justing the data rate.
Voice requires constant bit rate during transmission and thus it is unlikely to change voice users’ priority through rate variation. On the other hand, data (best-effort traffic in this paper unless otherwise specified) transmission rate is vari-able and can be raised if extra power is availvari-able or reduced without enough power resource to support target rate. In data scheduling profile, the last term “c/ratei” is not used
until delay exceeds a predefined thresholdDthre, and the re-quired transmission power is still too large to increase AP. If the packet enters this stage (delay > Dthre), it implies that merely adjusting power does not get an opportunity for the packet to be transmitted. At this point, transmission rate is adjusted since the change of power only no longer produces any effect. This is the only case where we decrease the quired transmission data rate in order to get a smaller re-quired power while SIR target is maintained. Since data users are able to withstand some delay and do not have strict drop bound, in which case wdp should be less than 1 to serve users under desirable channel conditions (small transmission power) with preference.
For simplicity, we setato 1 and adjustbin the range of (0, 1) for voice. For data,ais set in the range of (0, 1) while
b (orc) is set to 1. We compare to show the sorting sub-processes and allocation/reallocation subsub-processes of voice and data scheduling in Figures3and4. We observe in
Fig-ure 3 that the sorting processes for voice (Figure 3(a)) and
data (Figure 3(b)) scheduling are similar. WhileFigure 4 il-lustrates more complex data allocation process (Figure 4(b)) because of the additional reallocation process.
In the particular reallocation, process data scheduler does not stop when the remaining power is not enough to sup-port the current packet, because data transmission rate is adjustable according to the amount of remaining power re-source as indicated earlier. Hence, the remaining power (if any) can be further allocated to specially selected data users with various transmission rate values. The idea behind is summarized as follows. After every packet in the queue has been checked, if there is remaining power for one more “normal” packet even at minimum rate, this packet gets served (system capacity increased). If not, share the power left among “normal” packets since they require lesser power (data throughput improved). Only if neither of the above is true, we give the extra power to the first “moderate” or “urgent” packet in the sorted output queue. This packet has already been allocated resource after all packets in the data queue have been scheduled.Pris not allotted to “moderate”
or “urgent” packets which are still in the queue since they consume relatively large powers. As queuing delay increases, they will be assigned a larger AP until eventually get trans-mitted. This is the key role of delay taken into account in our design.
4. NETWORK LAYER ADMISSION CONTROL AND SOFT HANDOFF (NET/LINK/PHY)
High mobility and universal access are enabled by handoff mechanisms employed in next-generation cellular CDMA networks. Without handoff, forced termination would occur frequently as mobile users traverse cell boundaries.
An apparent pair of contradictive parameters represent-ing resource management efficiency and effectiveness in a handoffsystem is the call blocking probability (Pb) and the
handoffdropping probability (Pd). Since fixed downlink
to-tal traffic power is shared between newly accepted users and ongoing handoff users, one’s being greedy will induce an-other’s being starved. It is therefore important to regulate and optimize their behaviors by balancing the amount of re-sources distributed. Based on the fact that interrupting an ongoing call is more disagreeable than rejecting a new call, handoffusers are issued higher priority to reducePd
wher-ever competition arises. Among numerous prioritizing algo-rithms [19,20], resource reservation has attracted an over-whelming favor owing to lighter required communication overhead. However, existing algorithms prioritize handoff users as an entire category towards new users category. None of them concerns priority assignment among handoffusers, which is necessary when several users attempt to handoffto a same target cell simultaneously, under the constraint of lim-ited available target cell power (guard power PG) set aside
Begin
For each existing packet, buffering delay> Vthre?
Yes No
Put it intoQV1in the
order of arrival time
Put it intoQV2in the
order of arrival time
Calculate AP for each packet in each queue
i=1: rear,i+ + find the packet with max AP
Schedule this packet
i==rear ? Yes
No
Results of voice sorting
(a) Sorting subprocess of voice scheduling
Begin
For each existing packet, buffering delay==0?
Yes No
Put it into queue “normal” in the order of arrival time
For each existing packet, buffering delay> Dthre?
No Yes
Put it into queue “moderate” in the order of arrival time
Put it into queue “urgent” in the order of arrival time Calculate AP for each packet in each queue
i=1: rear,i+ + find the packet with max AP
Schedule this packet
i==rear?
Yes No
Results of data sorting
(b) Sorting subprocess of data scheduling Figure3: Sorting processes.
simultaneous handoffrequests, since predictions would not occur at the same time. Please refer to [21] for detailed expla-nations about the motivation and necessity of the proposed prioritizing algorithm.
We propose a handoffprioritizing algorithm, employing a link-layer scheduler with network and physical layer input (NETWORK/LINK/PHY). For prioritizing handoffusers, a scheduler implementing link-layer scheduling with network-layer inputs inheres in each base station to regulate incom-ing handoffrequests and to arrange these messages desig-nated to different target BSs in a specified sequence depend-ing on the logic of the scheduler, which has been proposed with physical-layer inputs in the previous section. The sched-uler applied to BSs is sketched inFigure 5, assuming the cur-rent serving base station is BS0. BS1, BS2,. . ., BSndenote
tar-get handoffBSs, withnthe number of handoffbase station targets.
4.1. Connection admission control (CAC)
Capacity of CDMA systems is “soft.” Acceptance of each new call increases the interference level of existing ongoing calls and affects their quality [22]. Hence, CAC is deployed to con-trol the access to such networks, complying with types of ser-vice and quality-of-serser-vice (QoS) requirement, as well as cur-rent system load.
With wireless Internet applications growing, the forward link becomes very critical to system capacity, in that the bottleneck-like power capacity of BSs imposes stringency on available power resources allotted to each sharing user. The CAC mechanism employed in this paper, thereby, is based on total downlink traffic power and the precedence of hand-offs over new calls, which is shown as a handoffrequest is admitted if
Nc on
i=1
Pi+Pho≤Pt, (4)
and a new connection request is admitted if
Nc on
i=1
Pi+Prsv+Pnew≤Pt, (5)
whereNc
onis the number of ongoing calls in cellc, andPi,Pho, Prsv,Pnew, andPtrepresent the required power of an ongoing
call i, the incoming handoffcall, the reservation for future handoffs (will be discussed later), the incoming new call, and the downlink total traffic power of BSs, respectively. Both (4) and (5) conform to the general admission criterionNonc
i=1Pi≤
Results of voice sorting
Allocate resource for each packetiinQV1with
power pw(i) and rateRvbased on priority
and power budget (pwt) until pw(i)>pwt
k=(i+ 1): rear,k+ + Yes
k==rear? No
pw(k)<=pwt? No Yes
Permit packetkto transmit at power pw(k), rateRv;
pwt=pwt pw(k)
Allocate resource for each packetjinQV2with
power pw(j) and rateRvbased on priority
and power budget until pw(j)>pwt
k=(j+ 1): rear,k+ + Yes
k==rear? No No
pw(k)<=pwt? Yes Permit packetkto transmit
at power pw(k), rateRv;
pwt=pwt pw(k) End
(a) Allocation subprocess of voice scheduling
Results of data sorting
Allocate resource for each data packetiwith power pw(i) and the required rate based on priority and power budget (pwt) until pw(i)>pwt
k=(i+ 1): rear,k+ + Yes
k==rear? No pw(k)<=pwt?
Yes
No
Permit packetkto transmit at power pw(k), the required
rate; pwt=pwt pw(k) Yes pw(t)==0?
No All “normal” packets
served (allocated)?
Prenough for min
rate of 1st “normal” packet in the queue?
No
No
Any “normal” packets served (allocated)?
No Yes
Yes
Yes
AssignPrto the served
(allocated) “moderate”/ “urgent” packet whichever
has the largest AP End
Pr=pwt; sharePramong
them with equal rate
AssignPrfully to this packet
with max available rate
SharePramong them
with equal rate
(b) Allocation and reallocation processes of data scheduling Figure4: Allocation processes.
Handoffrequests to BS1
Handoffrequests to BS2
. . .
Handoffrequests to BSn
. . .
. . . Output to BS1
after prioritizing Output to BS2
after prioritizing
Output to BSn after prioritizing Ordered by
arrival time
Ordered by adaptive priority
Measurement quantity CPICH1
CPICH2 CPICH3
Cell 1 connected Event 1A
add cell 2
Event 1C
replace cell 1 with cell 3
Event 1B
remove cell 3 Time
ΔT ΔT ΔT
AS Th + AS Th Hyst AS Rep Hyst
AS Th AS Th Hyst
(a) A typical soft handoffalgorithm
Initiate
Mobiles send PSMM predicting handoff, iff(9), and transfer pilots to predicted set
BS prioritizes predictions destined to a same cell based on AP values
Any of the above mobiles withdrew, iff(8), or dynamic channel reservation employed?
BS updates PQ (removing withdrawals) or dynamicPGafterWt,
and signals its neighbors with the updatedPG(dynamic scheme only)
BSs update PQ (based on the changing power andTc) afterWt
Mobiles send PSMM requesting handoff, iff(7) Mobiles identified by BS?
BS sends corresponding guard capacity requests to the target BS allots resources based on mobiles’ order in PQ (if any), procures guard capacity, an exhaustive search, and informs mobiles by HDM
Mobile transfers pilot to active set and sends back HCM Terminate
No
Yes
Yes No
(b) Proposed soft handoffprocedure Figure6: Soft handoffalgorithm and procedure.
4.2. Soft handoff
One of the major benefits of a CDMA system is the ability of a mobile to communicate with more than one base station at a time during the call [23]. This functionality allows the CDMA network to perform soft handoff. In soft handoffa controlling primary base station coordinates with other base stations as they are added or deleted for the call. This allows the base stations to receive/transmit voice packets with a sin-gle mobile for a sinsin-gle call.
In forward link handoffprocedure, a mobile receives pi-lots from all the BSs in the active set through associated traffic channels. All these channels carry the same traffic (with the exception of power control subchannel [23]), which facili-tates the mobile to gain macroscopic diversity by combining power received from the channels (i.e., maximal ratio com-bining [24]). Thus, less power is needed implying total inter-ference lessening and system capacity raising.
A basic soft handoff algorithm typically used in 3G CDMA systems is illustrated inFigure 6(a)[25], with AS Th, AS Th Hyst, AS Rep Hyst, andΔTdefined as the threshold of reporting for active set transfer, hysteresis of the former threshold, replacement hysteresis, and time to trigger, respec-tively. CPICH is the abbreviation of common pilot channel. The events, together with the hysteresis mechanism and time to trigger mechanism are discussed in [25].
We employ a similar basic algorithm with slight simplifi-cation. The selection of a base station into the active set and
the deletion from the active set are based on dynamic thresh-olds. LetMb
psand Bestactiveps be the measured pilot signal from base stationb, and best measured pilot from the active set, re-spectively. All the variables appearing in the inequalities be-low have the unit ofWatt. A base stationbis added into the active set if
Mb
ps>Bestactiveps −AS Th + AS Th Hyst, (6)
for a period ofΔT, and is removed from the active set if
Mb
ps<Bestactiveps −AS Th−AS Th Hyst, (7)
forΔT, where AS Th, AS Th Hyst, andΔT are design pa-rameters.
Note that the monitoring mechanism enables us to per-form the prediction for prioritizing without extra network resources or high cost, as will be discussed in the next sec-tion.
4.3. Adaptive prioritizing soft handoff algorithm
The parameters and performance measures of the proposed prioritizing algorithm are addressed in this section, together with the description of the detailed implementation proce-dure of the algorithm. We mentioned inSection 1that the adaptive priority profile is designed by jointly considering several elements, which are critical to define a specific hand-offuser.
4.3.1. Prediction
First of all, user mobility and location information are needed by prediction, which is the prerequisite of the pri-oritizing algorithm. This information is utilized by predic-tions for reserving guard capacity in the literature to track the speed and moving direction of mobiles. However, Wang et al. [19] claimed that such information procured from mo-bility models or GPS monitoring is generally costly and inac-curate, and complicated as well. As an alternative, they pro-posed using measured pilot strength to predict handoff(in IS-95 systems) since it is the origin of every handoffthus is accurate. Moreover, it is inexpensive since no additional network signaling is needed. We take advantage of this idea for the prediction in our algorithm, but modified it for 3G CDMA systems (i.e., WCDMA). It must be noted that the prediction method introduced in this paper is not as complex and precise as the aforementioned one because our focus is not on guard capacity reservation algorithm. However, with elaborately designed prediction scheme the significance and effectiveness of our algorithm will be more prominent.
Typically, in addition to the avoidance of signaling flood, prediction is updated at the end of every prediction win-dow Wt to remove withdrawals (i.e., (7) holds) resulting
from incorrect predictions or call termination (Tc> Dth, see
Section 4.3.3below). The output priority queue (PQ) is
up-dated accordingly based on the latest information procured through prediction notification from mobiles. When hand-offs actually take place, mobiles which are in PQ are iden-tified by BS and are allocated channels immediately if the guard power allows. On the other hand, if the handoff re-quests are not identified as in the regular handoffprocedure, these requests have to be sent to the target cell first since the BS has to inform the target to reserve power resources, where there exists the uncertainty about whether these re-quests can be approved with sufficient resources. Hence with prediction, the availability of resource is assured to maintain dropping performance. The handoffexecution delay is also shortened which may cause power outage and fade margin enlarging [26]. Note that it is wise to shorten this delay by all means especially in our case. Since additional handoff execu-tion time can be caused by queuing and sorting the handoff predictions in the proposed algorithm, which may introduce
computation complexity to the base station and reduce the base station’s handoffprocessing speed, all of the above rea-sons reinforce the need for prediction.
A predicted set is proposed in our algorithm, which con-sists of BSs satisfying the inequality beneath,
Mpsb > λ
Bestactiveps −AS Th + AS Th Hyst. (8) The prediction threshold PS Th obeys the dynamics of the threshold for the active set switching, and is related by PS Th= λ(Bestactiveps −AS Th + AS Th Hyst), whereλ,λ ∈ (0, 1) is a design constant affecting the prediction threshold above which the pilot is added into the predicted set, relative to the active set threshold. The criterion (8) serves as a trigger for the execution of the prioritizing algorithm. When (8) is satisfied, MS will report to BS of the prediction and the call holding timeTc, and the request will be put into the priority
queue. As long as the queue is not empty, BS will perform the algorithm at the end ofWt.
4.3.2. Downlink transmission power
Next, channel condition should be taken into account of the profile, in that it is the indicator of required handoffpower. A user experiencing better link gain and hence demanding less power is given a higher priority, in order to get more users served with the same amount of scarce downlink power re-source. Assuming the maximum size of the active set is 2 (i.e., at most 2 BSs co-serve a handoffuser at the same time), we can apply the maximal ratio combining strategy in (1) to de-rive theEb/I0of a mobileiwithin the soft handoffzone as
where 0 and 1 are in general the two coserving base station’s identity numbers andPbi is the transmission power to
mo-bileifrom BSb(current BS 0 and target BS 1). The actual receivedEb/I0takes the form of (2). Based on the straightfor-ward power division strategy [27] (i.e.,P0i=. P1i), under the
presumption ofj=0Gji/G0i =.
j=1Gji/G1i, the required
handoffpower from BS1 to mobileican be written as
P1i=.
The last term included in the profile is the call-holding time Tc. This information can be easily derived by the UE
(user equipment) through monitoring the connection time elapsed for the ongoing call. For the proposed profile, we im-port a parameterDthdenoting the death threshold for on-going calls. The onon-going call is presumed to be terminated by the user before the actual handoff takes place if itsTc
is greater than Dth at the time the prediction is made. If
Tc < Dthholds at the time of prediction, higher priority is
assigned to a longerTc. Because it is more probable that this
We finally conclude the adaptive priority profile for user
in which APiis the useri’s priority andμis the adaptive
fac-tor adjusting the proportion of power and time to be com-parable quantitatively.Pnor
1i andTcinordenote the normalized
downlink transmission power and the normalized call hold-ing time of useri, respectively.P1nori =P1i/Pmean, wherePmean is the mean downlink transmission power of predicted hand-offusers for the same target cell.Tnor
ci = Tci/Tscale, where
Tscale =10 s is the scale of the calling time. We use a rough calling time measuring method. The availableTcinorvalues are
0, 1, 2,. . .,Dth/Tscale. While the actualTci values can be any
number between 0 andDth, for simplicity, we assume that the
Tci/Tscalevalues will be ceiled to one of the aboveTcinorvalues
for the AP calculation. This definition style is derived from the wired networks, where IGRP and EIGRP routing proto-cols define a composite metric associated with each route in an alike fashion as mentioned inSection 3. Specifically, we subdivide users into two classes, which are distinguished by different priority profiles. According to Viterbi et al. [28], the maximum fade margin (maxγd) put apart for overcoming
shadowing correlation (with coefficienta2) is obtained at the cell boundary, subject to a certain outage probability target (Pout∗ ). Hence, we issue boundary users a lowerμsince they require a higher power for handoff(due to a higherγd) to
ensure fairness. For convenience, we setμ= 1 for ordinary users andμ∈(0, 1) for marginal users. Dedicated surveys on fade margin improvement and delicate relations among pa-rameters such asγd,P∗out, anda2are present in [26,28,29].
The implementation procedure of the proposed soft handoffalgorithm is drawn inFigure 6(b). Note that we pro-vide the option of dynamic channel reservation mechanism in the flowchart, in spite of its absence in our algorithm. Ad-ditionally, the exhaustive search allocation scheme incorpo-rated in the flowchart can be traced in [30], where we pro-posed a modified queuing algorithm, considering that a user with a smaller required power is possible to be at the back of PQ, since the synthetic AP value is determinant when prior-itizing incoming users. While in the classic first-in-first-out queuing scheme, users behind will not be allocated until all of the front users are served.
5. TRANSPORT LAYER TCP PERFORMANCE (TRANS/NET/WIRELESS LINK)
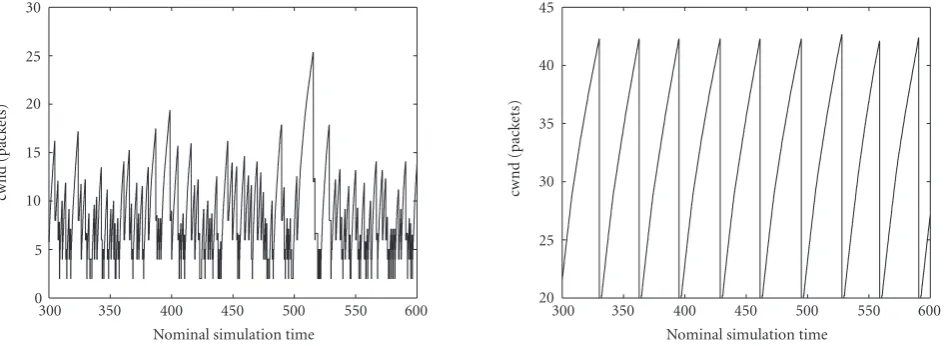
TCP congestion control is originated and well investigated in wired networks where congestion is the main cause of packet loss, thus operates properly in such networks. But wire-less networks and mobile terminals feature a large amount of losses due to bit errors and handoffs, thus are in some facets non-cooperative with traditional TCP congestion con-trol, resulting in end-to-end performance degradation. In wired networks, TCP assumes that packet loss is caused by congestions and reacts to it by decreasing the congestion window (cwnd), retransmitting the missing packets, trigger-ing congestion control/avoidance mechanism (i.e., slow start
[31]), and recalculating the retransmission timer with some backoffaccording to Karn’s algorithm [32]. In wireless net-works, when packet loss occurs for some reasons other than congestion, such as temporary blackout due to fading, or when packets are correctly received but the corresponding ACKs have not been returned which is the so-called spuri-ous timeout, TCP will perform the same as for reacting to congestion in wired networks because it is not able to iden-tify these different types of losses. The spurious timeouts of TCP in wireless communications eventually lead to unnec-essary cwnd/throughput drop and inefficient bandwidth uti-lization, especially in the presence of the well-known stochas-tic internals of wireless scheduling which is the focus of this section. We address this problem, present existing solutions, and provide our algorithm.
Although there are difficulties implementing TCP in wireless networks, so far no single research has proposed to replace TCP with another transport layer protocol suit-able for communications over wireless links. It is unwise to remove TCP since its hierarchical relationship with pop-ular application-layer protocols such as HTTP, FTP, TEL-NET, and SMTP has been well established. In order to fa-cilitate the seamless integration of mobile communications through wireless networks with the wired Internet backbone, TCP over wireless techniques are proposed. In general, the proposals found in the literature can be categorized into three classes: split-connection protocols (i.e., indirect-TCP (I-TCP) [33]), end-to-end protocols (i.e., explicit congestion notification (ECN) [34]), and link-layer proposals (i.e., for-ward error correction (FEC) [35]). One may refer to [36] for a detailed survey on different classifications of TCP-over-wireless solutions.
Wired network
(a) The integrated network topology for TCP proposal
FTP/TCP
(b) Network topology for TCP-over-wireless simulations
Figure7: Network topologies for TCP proposal and simulations.
each scheduling cycle and updating of the information for recursive calculation afterwards.
One of the innovations of our works is that we propose an algorithm to eliminate TCP performance degradation due to wireless scheduling in CDMA downlinks. In this paper, we do not give details on how wireless opportunistic scheduling im-pacts TCP performance since it is well illustrated in [37,39]. We assume it is the existent problem and are concerned with the solutions in a CDMA environment. As addressed in the preceding section that in CDMA downlinks, scheduling users under better channel condition first can improve overall network performances. Wherever scheduling arises in wire-less networks, there are impacts on TCP sources. The pro-posal is based on an example of real-time video transmis-sions where the jitter is smoothed out at the receiver to en-sure a constant rate playout. We apply this idea to CDMA downlink scheduling which introduces stochastic halt affect-ing TCP performance at the sender (typically a fixed sta-tion in the wired part of the network from which data can be downloaded using HTTP or FTP application protocols).
Figure 7(a)depicts the network topology we are dealing with,
where RNC (radio network controller) and PDSN (packet data serving node) connect the wireless network with the In-ternet backbone.
TCP mechanism is quite mature in wired networks. The problem that we are facing now is because of the exclusion of potential wireless applications when TCP was proposed. Naturally, one solution would be emulating the behavior of the wired network, so that the “wireless” effect on TCP could be eliminated. Wired scheduling is periodical and hence pre-dictable since every user is equal in terms of channel con-dition (no time-varying fading over wired links). It can be prevented and will not be a cause of TCP spurious timeouts. Thus wired scheduling is not within the scope of our study. On the other hand, wireless scheduling is unpredictable and thus irregular due to time-varying wireless links (users have to be rescheduled according to their instant channel fading).
Wireless CDMA networks consist of two parts: the uplink and the downlink. In the reverse direction (uplink, i.e., from the mobile station to the base station), the key restriction is the incremental interference in the system as communi-cating mobiles increase, due to transmission power levels of other active users and imperfect orthogonality of channel codes. Scheduling in this direction is not needed as long as the system interference stays below the threshold. Here we assume that the simultaneously active users in the system are not enough to cause the interference beyond the threshold. Therefore, scheduling in this direction is of little importance to be considered by TCP performance. Rather, we focus on the downlink direction where we proposed novel scheduling schemes and explained their necessity and effectiveness.
Through the analysis above, downlink scheduling is the only affecting factor to degrade TCP performance in our study. Specifically, when interscheduling cutoffs (inter-vals/halts) occur, there is a temporary silent period in the wireless part of the network for the scheduler to collect the up-to-date channel information and to perform the new scheduling at the base station. During this period, no traf-fic is in the wireless network and the mobile station will not send back the expected ACK since it has not received the TCP packet queued at the base station. Consequently, the TCP source may undergo spurious timeouts without the ACK it is expecting.
Table1: Key technical specifications of WCDMA.
Multiple access technique Direct-spread code Number of slots/frame 15 division multiple access
Frequency reuse 1 Number of chips/slot 2560
Carrier bandwidth 4.4–5.2 MHz Intrasystem handoff Soft/softer handoff
Chip rate of spreading bits 3.84 Mcps Power control period Time slot=1500 Hz rate
Maximum user data rate 2.3 Mbps Power control step size 0.5, 1, 1.5, 2 dB (variable)
Frame length 10 ms (38400 chips) Physical layer spreading factors 4· · ·256 (uplink) 4· · ·512 (downlink)
network at all times so that there is no cutoffany more. This is our Proposal 1. Let the queues at the base station be per-TCP-flow and the ACK per-packet based (TCP Reno [40]). LetNibe the number of TCP packets in queueiof the
refer-ence base station, letTbiandTsi(in seconds) be the
midsea-son (burst) and offseason (silence) duration of the schedul-ing cycle of queuei, respectively. The playout rate to smooth out the “jitter” of the burst trafficRpis written as
Rp= Ni
Tbi+Tsi, (12)
whereNiis known to the base station through queue
moni-toring,Tbi+Tsiis equivalent to one termTci, the scheduling
cycle of queuei, which can be obtained from the history as
Tci(n)=(1−ρ)Tci(n−1) +ρTci(n−1), (13)
whereTci(n) andTci(n−1) denote thenth and its previous,
the (n−1)th, scheduling cycles, respectively.Tci(n−1)
de-notes the average duration of scheduling cycle of queueiup to scheduling cycle (n−1).ρis a weighing parameter with a typical value of 1/1000 [39]. The initial value of the schedul-ing cycle (i.e.,Tci(1)) can be monitored by the base station
through some timer setting. Having smoothed out the “jit-ter” using the above algorithm, the base station can “play” the traffic continuously and get the ACK back to the TCP sender accordingly, without temporary blackout which is the root of TCP spurious timeout and performance degradation. The above proposal can be easily implemented and effec-tive, which is based on the fact that the ACK flow back to the TCP source is continuous as long as the TCP packets waiting at the base station get transmitted to the mobile destination continuously. It applies to wireless part of the network with both comparable and negligible delay compared with the de-lay in wired part of the network, because the timeout interval is updated by TCP through the measured variable round trip delay.
6. PERFORMANCE ANALYSIS-SIMULATION ENVIRONMENT & NUMERICAL RESULTS
We address the performance measure and numerical results in this section. As argued before (see Section 1), different
interpretation of “cross-layer” yields a different concern on complex connections among layers. Some layers may inter-act in terms of one measure while others may be related in terms of another. In general, it is difficult to generate a method that conforms the performance measures across all the four layers involved in our research, as proposed in Sections 3–5; the interacting layers are LINK/PHY, NET-WORK/LINK/PHY, and TRANSPORT/NETWORK/LINK, respectively, where they are associated based on currently prevalent and practical problems concerned. Thus for each combination which is formulated by these layers’ featured relationships/interactions, there are individual measures that best exhibited the performance gain over noncombination. This is how we design the simulation senarios to exploit the performance gain for each cross-layer combination.
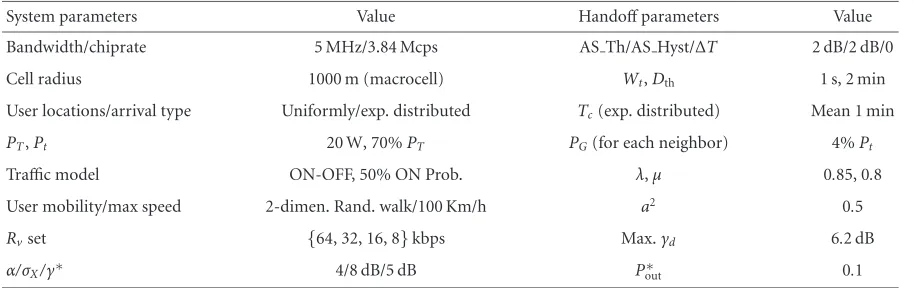
The simulations of the following subsections are set up in a WCDMA environment. Some of the key technical specifica-tions of WCDMA [41] used for our simulation environment setup are listed inTable 1.
6.1. MAPQ and UF
Other relevant parameters are 19 wrap-around cells with ra-diusr =500 m (macrocell). One BS is located in the center of each cell withPT =20 W and a portion of 70% ofPT is
dedicated to traffic channel [42]. Mobility speed in Rayleigh-fading model is 10 km/h (vehicular environment),α = 4,
σX=8 dB,σY =2 dB,γvoice∗ =5 dB, andγ∗data=3 dB. Hybrid voice and data users are uniformly distributed, approximately 30 users per cell on average. Voice traffic is modeled as “ON-OFF” with 50% “ON” duration probabil-ity, and best-effort data traffic is generated with exponentially distributed arrival rate. Generally speaking, voice traffic has lower transmission rate compared to data traffic. In the in-tegrated voice/data scheduling scheme, minimum voice rate
Rv is selected from one of the following values:{8, 16, 32,
64}kbps corresponding to a spreading gain of 512, 256, 128, and 64, respectively, whileRv=64 kbps is the fixed
transmis-sion rate in the voice-only scheduling (MAPQ). Data rateRd
can be chosen from any available value allowed by the spread-ing gain set of{4, 8, 16, 32, 64, 128, 256, 512}.
For voice-only scheduling, maximum tolerable delay is
0.7 0.65 0.6 0.55 0.5 0.45 0.4 0.35 0.3 0.25
N
o
rm
aliz
ed
syst
em
capacit
y
0.1 0.2 0.3 0.4 0.5 0.6 0.7 0.8 0.9 1 Traffic load
MAPQ FIFO STPD
(a) System capacity comparison for MAPQ
0.9 0.8 0.7 0.6 0.5 0.4 0.3 0.2
M
ean
nor
m
aliz
ed
dela
y
0.1 0.2 0.3 0.4 0.5 0.6 0.7 0.8 0.9 1 Traffic load
MAPQ FIFO STPD
(b) Mean normalized delay comparison for MAPQ Figure8: Performance evaluation of MAPQ.
the simulations to determine the unfairness criterion. The power for calculating AP is procured from (1). For integrat-ing voice/data schedulintegrat-ing framework, the delay thresholds for sorting voice and data packets into different queues are
Vthre=10 ms, andDthre=120 ms. The delay bounds of voice and data packets are 100 ms and 2 s, respectively, which will be used in the mean normalized delay calculation in the fol-lowing section.
We first define the performance measures used in the MAPQ and UF simulations for voice and data. DefineNF, NA,NS,NC,ψF, andψAas the total number of users in the
network (in our case 30/cell), the number of active users in the network, the number of active users actually served, the number of cells in the system (in our case 19), the through-put (kbps) of the system if all the active users can be served, and the actual throughput of the system, respectively.
(1) MAPQ for voice only.
(i) Normalized system capacity (throughput)-ψA/ψF.
Note that voice packets have constant transmission rate thus the capacity and throughput have similar behaviors.
(ii) Packet dropping probability—(number of packets dropped)/(number of packets transmitted). A voice packet is dropped if its buffering delay exceeds the delay bound (100 ms).
(iii) Unfairness probability—we call it “unfair” if a user’s buffering delay is greater than db yet not
served. Therefore, unfairness probability refers to the probability that such unfair event happens. One possible way is to useNUP/NAto measure it, where NUPis the number of users that experience unfair-ness.
(iv) Traffic load-NA/NF.
(2) UF for hybrid traffic. (i) System capacity-NS/NC.
(ii) Traffic throughput-ψA/NC.
(iii) Outage probability: fraction of time that a user’s received power is below the minimum acceptable power level to satisfy the target SIR.
(iv) Average power utilization (efficiency)—(total power consumed)/(total traffic power budget of BSs). It acts as the indicator of resource consump-tion efficiency.
(v) Voice ratio—the proportion of voice traffic in the hybrid traffic. It controls the variation of the hybrid traffic structure.
(3) For both MAPQ and UF.
(i) Mean normalized delay:
Ns i=1
normalized delay of packeti
Ns
, (14)
where the numerator equals to buffering delay of packeti
delay bound of packeti . (15)
We measure the normalized delay only for success-fully served users because there are other criteria, voice dropping probability and data outage, to illus-trate the behavior of each scheduling scheme with service failures.
6.1.1. Voice only: MAPQ
0.9 0.8 0.7 0.6 0.5 0.4 0.3 0.2
V
o
ic
e
d
ro
pping
pr
obabilit
y
0.1 0.2 0.3 0.4 0.5 0.6 0.7 0.8 0.9 1 Traffic load
MAPQ FIFO STPD
(a) Dropping probability comparison for MAPQ
0.9 0.8 0.7 0.6 0.5 0.4 0.3 0.2
U
n
fair
ness
pr
obabilit
y
0.1 0.2 0.3 0.4 0.5 0.6 0.7 0.8 0.9 1 Traffic load
MAPQ FIFO STPD
(b) Unfairness probability comparison for MAPQ Figure9: Performance evaluation of MAPQ.
scheme (FIFO) is deployed, system performances of the MAPQ scheme in terms of system capacity, voice packet dropping probability, mean normalized delay, and unfairness probability improve in various degrees, as shown in Figures
8and9, respectively.
As the traffic load grows heavier, the performance gain of the proposed scheme becomes more apparent. This can be explained by the following observations. When the power budget is getting tighter and users are more competitive for limited resources, the FIFO scheme is not capable of produc-ing satisfactory results due to its inadaptability to severe sys-tem environment. While the MAPQ scheme is generally sta-ble and insensitive to throughout traffic variation, and asta-ble to produce acceptable outcomes even if experiencing stringent conditions, as a result of well designed adaptive features.
Moreover, we compare the MAPQ scheme with a more advanced scheduling scheme in the literature named STPD (scheduling with transmission power and delay) [15]. In this scheme, packets whose required transmission power is less than a threshold Pth are classified into Group 1, otherwise are classified into Group 2. For real-time traffic like voice, if the maximum buffering delay of Group 1 is less than a delay threshold, Group 2 is transmitted first to avoid the exceed-ing of the tight delay bound. While for non-real-time traf-fic like data, Group 1 is always transmitted first since it is delay-tolerable. This algorithm is less complex in calculation since it does not use the priority to sort each packet. How-ever, the simplicity may result in some degradation of the performance, as shown in Figures8(a)and8(b), where ob-viously the more complex MAPQ scheme performs better in terms of both the system capacity and the mean normalized delay in the network.
The MAPQ scheme not only outperforms the STPD in these criteria, but also maintains other performances in
terms of voice dropping probability and unfairness probabil-ity, as shown in Figures9(a)and9(b). InFigure 9(b), MAPQ and STPD almost have the same performance but as the traf-fic load becomes heavier, the MAPQ shows the trend to out-perform the STPD.
Note that the fairness criterion in our simulation is im-plied by both the mean normalized delay and the unfairness probability measures. Smaller normalized delay and lower unfairness probability indicate higher degree of fairness.
We also testified the necessity of both sorting and the al-location subschemes of MAPQ scheme by comparing MAPQ with two reference cases, namely, allocation (modified PQ) without sorting and sorting without allocation (classic PQ). The proposed scheme outperforms both of the references in terms of system throughput, packet dropping probability, and unfairness probability with 2%–10% performance gains (not shown in this work).
6.1.2. Unified voice/data framework (UF)
Individual performance gain of voice under the proposed scheduling algorithm has been procured and illustrated above in terms of system capacity/throughput, packet drop-ping probability, and unfairness probability. Note that the values ofa,b, andcused in the simulation are obtained from the estimation.
30
25
20
15
Sy
st
em
capacit
y
0.1 0.2 0.3 0.4 0.5 0.6 0.7 0.8 0.9 Voice ratio
UF SPS STPD
(a) System capacity comparison for UF
10
3
3.5
3
2.5
2
1.5
1
Tr
a
ffi
c
thr
oug
h
put
(kbps)
0.1 0.2 0.3 0.4 0.5 0.6 0.7 0.8 0.9 Voice ratio
UF SPS
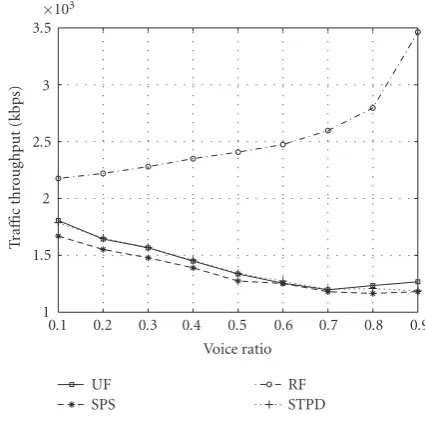
RF STPD (b) Traffic throughput comparison for UF Figure10: Performance evaluation of UF.
transmission power and delay), and the third reference algo-rithm employs data scheduling only, which is the popular RF (rate fairness) algorithm as in [43,44]. They represent three typical simulation conditions.
Figures10and11show the comparison results in terms of system capacity, traffic throughput, outage probability, power utilization efficiency, and mean normalized delay, re-spectively. The results are obtained by averaging over differ-ent load situations. The proposed algorithm achieves better performance in all cases in comparison with SPS and STPD. The proposed framework illustrates an appropriate combi-nation of individual performance sustentation as well as in-tegrated optimization and robustness.Figure 10(a) exhibits the capability of the proposed algorithm to explore the bursty nature of the data traffic with a visible steep slope of the solid square-marked curve under the variation of traffic ratio. This capability benefits from discrepancy of voice/data schedul-ing (i.e., different adaptive priority profiles, data reallocation mechanism) in the framework. While SPS (dashed asterisk-marked curve) appears mildest under the traffic structure change, as a result of limited capacity and resource utilization capability. Solid square-marked curves of Figures10(a)and
10(b)confirm the results in [45] in which system
through-put (Figure 10(b)) decreases with the reduction of data por-tion, probably because of the fact that data traffic has much more burst and much higher bit rate, thus is more susceptible to load change and affects more on throughput and capacity (Figure 10(a)) behaviors.
Although RF has much higher traffic throughput (ob-served in Figure 10(b), circle-marked dash-dot curve) be-cause it distributes rate equally among all active users regard-less of actual channel impairments, which comes at the ex-pense of users being served with power below the minimum acceptable target at most of the time (circle-marked dash-dot curve inFigure 11(a)), this insufficient transmission power
fails to combat channel fading and causes transmission fail-ure (SIR target unsatisfied). While the power baseline in SPS is assured, because of the lack of sorting process, users are served in a first-in-first-out mode where a user occupying large power is possible to be allocated before users request-ing smaller power. Also, due to our allocation subalgorithm which is based on an exhaustive search mechanism, system capacity and traffic throughput of the proposed algorithm outperform those of SPS as displayed in Figures10(a),10(b)
(solid versus dashed curves), respectively, without sacrificing QoS satisfaction degree (here defined by outage probability as inFigure 11(a), solid versus dashed curve).
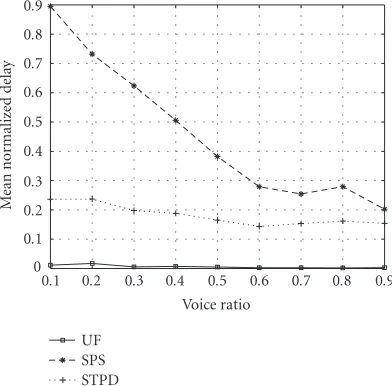
Aside from the exploitation and maintenance of individ-ual behavior features, the capability of attaining overall op-timization and robustness to various traffic structure, result-ing from the consistent infrastructure of the framework, is depicted in Figures11(a),11(b), and11(c), since in these fig-ures the fluctuation of the traffic structure does not affect UF much.
Voice traffic has less burst, smaller range, and lower data rate than data traffic. Wang et al. [19] advocates that with the same total offered load, a larger fraction of voice permits better multiplexing and hence more efficient resource usage, giving rise to the fluctuation of average power utility with voice ratio, shown in their simulation results. On the con-trary,Figure 11(b)convincingly illustrates that the UF guar-antees power utilization efficiency at above 97% at all times benefiting from data reallocation mechanism and is resistible to a variety of offered traffic load and voice/data ratio. At the same time, the obvious fluctuation of the dashed curve and the dotted curve reflects the vulnerability of SPS and STPD under the altered traffic structure.
1 0.9 0.8 0.7 0.6 0.5 0.4 0.3 0.2 0.1 0
Outage
pr
obabilit
y
0.1 0.2 0.3 0.4 0.5 0.6 0.7 0.8 0.9 Voice ratio
UF SPS RF
(a) Outage probability comparison for UF
1 0.95 0.9
0.85 0.8
0.75
A
ver
age
p
o
w
er
utilization
0.1 0.2 0.3 0.4 0.5 0.6 0.7 0.8 0.9 Voice ratio
UF SPS STPD
(b) Power utilization efficiency evaluation for UF
0.9 0.8 0.7 0.6 0.5 0.4 0.3 0.2 0.1 0
M
ean
nor
m
aliz
ed
dela
y
0.1 0.2 0.3 0.4 0.5 0.6 0.7 0.8 0.9 Voice ratio
UF SPS STPD
(c) Mean normalized delay (fairness) evaluation for UF Figure11: Performance evaluation of UF.
insensitive outage occurrence (solid curve in Figure 11(a), reflecting high degree of QoS satisfaction) throughout var-ied voice ratio.
Figure 11(c) shows the outstanding delay performance
of the UF scheme. In general, higher voice ratio yields bet-ter delay performance since data packets may experience much longer delay thus have larger impact on the delay be-havior in the network. In fact, the delay bebe-havior of the MAPQ scheme in Figure 8(b)does not show such striking performance enhancement. We mentioned before that data packet delay is usually much larger than voice packet lay. The data packet delay performance determines the de-lay performance of the entire network. Therefore, we can conclude that the result in Figure 11(c) suggests that the
gain of the UF scheme comes largely from the desirable de-lay performance of data users. Due to the dominant char-acteristics of data packet delay in the network, this perfor-mance gain also compensates for the voice packet delay per-formance, observed as a nearly flat curve (the solid square-marked curve) inFigure 11(c). This nonfluctuated delay per-formance curve further demonstrates the fairness assurance among data users in the UF scheme. In addition, it implies that, in the MAPQ scheme, the improved performance of voice packets does not necessarily sacrifice the data packets behavior (i.e., data packet delay).