The gradient wind in the mesosphere and lower thermosphere
Ruth S. Lieberman
Colorado Research Associates, 3380 Mitchell Lane, Boulder, CO 80301, U.S.A.
(Received August 10, 1998; Revised November 19, 1999; Accepted November 19, 1999)
HRDI zonally averaged daytime temperatures are used to compute the gradient wind in the 65–105 km range. Results are compared with independently measured HRDI zonal mean zonal winds. The gradient wind captures the essential features of the observed wind field in the summertime midlatitudes, including the stratospheric east-erly (westward) jet and the reversal to westeast-erly (eastward) winds in the lower thermosphere. The consistency between HRDI and gradient winds diminishes at tropical latitudes, due to substantial tidal contamination of daytime temperatures used to compute the gradient wind.
1.
Introduction
Zonally averaged zonal winds and temperatures in the mid-dle atmosphere are commonly assumed to be in thermal wind balance (Andrewset al., 1987; Fleminget al., 1990; Hedinet al., 1996). The gradient wind approximation has been shown by Randel (1987) to be generally quite accurate in the strato-sphere. Mansonet al.(1991) compared medium frequency (MF) radar winds in the 60–120 km range with gradient winds computed from the COSPAR International Reference Atmo-sphere 1986 temperature database, hereafter referred to as CIRA-86. Good agreement between the two sets of winds was reported below 80 km; however, above this level radar winds deviated systematically from CIRA-86 gradient winds. In particular, the gradient wind approximation produced jet maxima that are stronger than observed, and placed the level of the wind reversal too high. Fleminget al. (1996) com-pared CIRA-86 gradient winds to winds directly observed by the high resolution Doppler Imager (HRDI) and the wind imaging interferometer (WINDII) on board the Upper Atmo-sphere Research Satellite (UARS). In the lower mesosphere HRDI and CIRA-86 wind climatologies showed good agree-ment in reproducing the general structural and seasonally-varying features of the midlatitude circulation. Differences between CIRA-86 andUARSwinds were more pronounced above the mesopause. These were attributed by the authors to differences in spatial coverage and vertical resolution, and possible ageostrophic influences.
HRDI recovers daytime temperatures along with horizon-tal winds in the 65–105 km range. The availability of these two independently measured fields allows for a quantitative assessment of the gradient wind approximation. Unlike the mid-upper troposphere and stratosphere which are largely inviscid, the mesosphere and lower thermosphere (MLT) are regions of strong-amplitude wave breakdown and turbulence production. These processes act as a drag upon the large-scale flow, and thus can destroy geostrophic (or gradient)
Copy right cThe Society of Geomagnetism and Earth, Planetary and Space Sciences (SGEPSS); The Seismological Society of Japan; The Volcanological Society of Japan; The Geodetic Society of Japan; The Japanese Society for Planetary Sciences.
wind balance. It is of interest to examine the validity of the gradient wind approximation in a region of the atmosphere which is inherently ageostrophic.
This paper reports a comparison between MLT zonal mean winds directly observed by HRDI, and gradient zonal mean winds computed from HRDI temperatures. It must be em-phasized that the use of daytime-only winds and tempera-tures in this context requires careful consideration of tidal effects. Diurnal tides, which are highly ageostrophic mo-tions, cannot be fully separated from the long-term (i.e., cli-matological) component of HRDI zonally averaged winds and temperatures (Hayset al., 1994; Ortlandet al., 1998). Consequently, this study focuses on two solstice periods, 11 December 1993–9 February 1994, and 13 June–12 August 1994, that are characterized by strong extratropical mean cir-culations and weak diurnal amplitudes (Burrageet al., 1995; Lieberman, 1997). Thermal wind balance at the equator is also examined, using a composite year of HRDI winds and temperatures.
The following section describes the HRDI data, and mean wind and temperature analyses. Section 3 presents the geo-strophic and gradient wind fields, and their comparisons with HRDI winds. Discussion of the results and an appraisal of possible tidal effects appear in Section 4. Section 5 sum-marizes the findings, and discusses future observational re-quirements.
2.
HRDI Data and Analysis
HRDI is a Fabry-Perot interferometer/photometer de-signed to measure stratospheric and MLT horizontal winds, and MLT temperatures. MLT winds are inferred from the Doppler shift of O2 atmospheric band emission features.
Temperatures are determined along with volume emission rates by considering perturbations of two O2 lines about a
reference brightness calculation. Daytime MLT winds are re-covered between 60–110 km with a precision of about 5 m s−1
(Burrageet al., 1996b). Daytime temperatures are retrieved between 65 and 105 km, with an error of 7K (Ortlandet al., 1998). Nighttime winds about the 95 km level are
mined from O2 band emissions in a thin layer between 90
and 95 km (Burrageet al., 1994). HRDI design, operation, and data retrieval procedures are discussed extensively by Abreuet al. (1989), Hayset al. (1993), and Ortlandet al.
(1995, 1998); the interested reader is referred to these papers for further details.
HRDI commenced routine viewing of the MLT in Novem-ber 1991. Between January 1992 and April 1994 HRDI nom-inally sampled the daytime mesosphere on alternating days, while between April 1994 and 1995 HRDI sampled the meso-sphere almost daily, but on alternate orbits. Nighttime winds near 95 km were sampled daily between October 1992 and April 1995. Since the failure of theUARSsolar array drive in April 1995, HRDI measurements have been carried out with diminishing frequency and continuity; as a result only measurements between 1992–April 1995 are included in the analyses.
The present study uses version 11 of HRDI level 2 winds and temperatures, archived at the University of Michigan Space Physics Research Laboratory. (A gridded, interpo-lated,“level 3A”version of these data is archived and dis-tributed by Goddard Space Flight Center.) Daytime MLT winds and temperatures are collected for each day in lati-tude bins 5 degrees wide, and then averaged in longilati-tude. This procedure is intended to highlight the zonal mean com-ponent; however, because HRDI daytime measurements are nominally made at nearly the same local time on an indi-vidual day, it should be borne in mind that the longitudinal average highlights the migrating (i.e., local-time dependent) diurnal and semidiurnal tides (Mortonet al., 1993; Hayset al., 1994). The precession of theUARSorbit results in a 20 minute day-to-day drift in the local time sampling. Approxi-mately 12 daytime hours are sampled over one complete yaw cycle (36 days) under equinoctial conditions.
Two solstice-centered intervals are considered, 11 Decem-ber 1993–9 February 1994 and 13 June–12 August 1994. These periods are chosen because of the strong extratropical zonal mean circulation in the MLT. Moreover, the amplitude of the (1,1) diurnal tide during these periods is weaker by a factor of 2 than the preceding and following years (Burrageet al., 1995; Lieberman, 1997), Thus, tidal aliasing of the zonal mean winds and temperatures is relatively minimal (although by no means negligible; see Section 4). The length of the analysis period, 60 days, is chosen in order to maximize HRDI local time sampling during solstice conditions in both hemispheres.
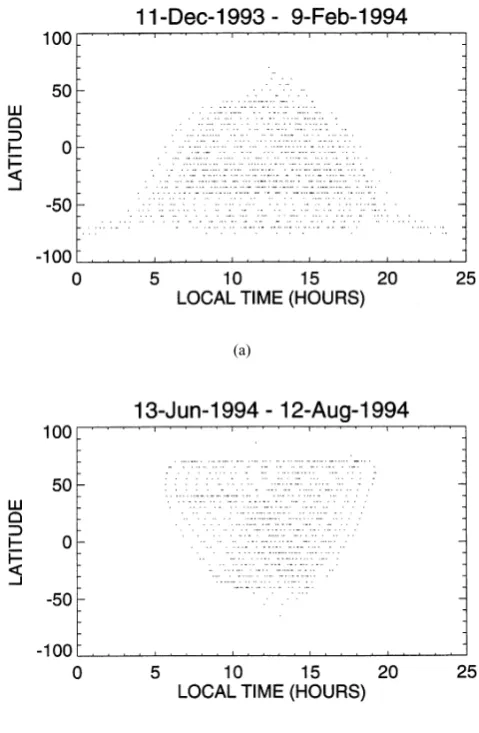
Figure 1 illustrates the local time coverage as a function of latitude during 11 December 1993–9 February 1994 and 13 June–12 August 1994. For each of these intervals, daily lon-gitudinal averages of zonal wind and temperature are formed, sorted into 12 local time bins (observations between 1200 and 2300 LT are binned with those between 0000 and 1100 LT), and then averaged. If data at a given latitude span at least 10 hours, and are missing over no more than 4 consecutive local time bins, an average over allfilled local time bins is then performed. This procedure maximizes latitude coverage of the seasonal (or 60-day) mean, while minimizing local time sampling biases and contamination by the semidiurnal tides. (Note, however, that the effects of diurnal tides cannot be fully removed.)
(a)
(b)
Fig. 1. Local time coverage vs. latitude during 11 December 1993–9 Febru-ary 1994 (a) and 13 June–12 August 1994 (b).
de-(a)
(b)
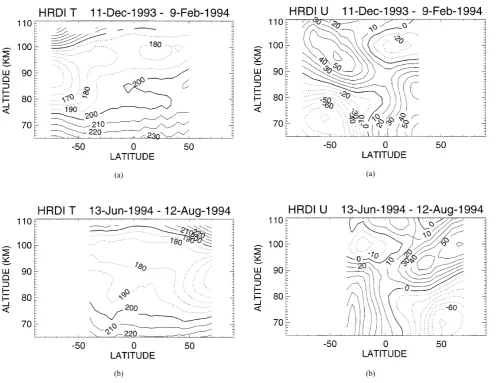
Fig. 2. HRDI zonal mean temperatures. Contour interval is 10K. Dot-ted contours enclose temperatures colder than 200K. (a) 11 December 1993–9 February 1994. (b) 13 June–12 August 1994.
grees warmer than in the neighboring extratropical latitudes. HRDI solstice zonal mean winds are plotted in Fig. 3, binned and averaged identically to the temperaturefield. The summer hemisphere is characterized by easterlyflow which peaks near 75 km, with a transition to westerly winds occur-ring between 80 and 90 km along an axis tilting upward and poleward. The winter hemisphere is characterized by a deep layer of westerlies, which reversing to easterlies at 95 km.
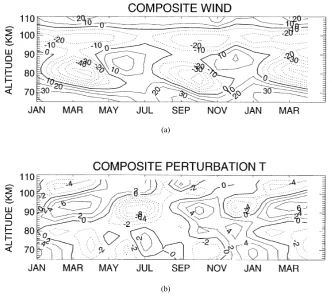
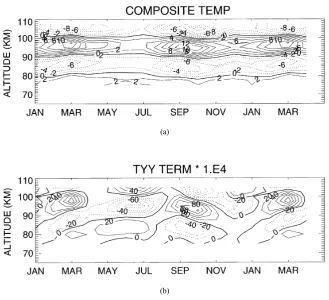
Figure 4(a) shows composite monthly averages of HRDI equatorial zonal mean winds, formed from observations be-tween January 1992 and April 1995. The dominant feature in the windfield is the well-documented mesopause semian-nual oscillation, or MSAO (Liebermanet al., 1993; Burrage
et al., 1996a; Garcia et al., 1997) below 90 km. Strong easterly winds occur at equinox, separated by weak westerly winds at solstice (see Fig. 3). Above 90 easterly winds pre-vail, with a weak semiannual signal juxtaposed. Thisflow pattern has been linked by Lieberman and Hays (1994) and Lieberman (1997) to the presence of diurnal zonal winds, and to momentum deposition by dissipating diurnal tides.
Figure 4(b) shows the composite monthly mean temper-ature as a perturbation from the time-mean (January 1992–
(a)
(b)
Fig. 3. HRDI zonal mean zonal winds. Contour interval is 10 m s−1. Dotted contours represent negative values, or easterlyflow. (a) 11 December 1993–9 February 1994. (b) 13 June–12 August 1994.
April 1995)field. The dominant variability here is also semi-annual. The highest perturbation values are centered near 90 km, with maxima at equinox and minima at solstices. This seasonal behavior may be related to aliasing of day-time temperatures by the diurnal tides, as discussed further in Section 4. Below 90 km, temperature perturbations are weaker by a factor of two, but exhibit a clear semiannual variation that is 180◦out of phase with the oscillation above 90 km. Perturbation maxima appear during solstices, sepa-rated by minima at equinox, and move downward in time. This behavior is consistent with the MSAO documented in Solar Mesospheric Explorer (SME) temperatures (Garcia and Clancy, 1990; Garciaet al., 1997), although the HRDI MSAO is slightly weaker.
3.
Gradient and Geostrophic Winds
3.1 Midlatitude calculations
circula-(a)
(b)
Fig. 4. (a) Composite monthly mean HRDI zonal mean winds. (b) Composite monthly mean zonal mean temperature, with the time average removed. Thefirst 4 months of the year are repeated on the abscissa.
tion, the remaining terms are
U
f +Utanφ a
= −φ
a (1)
(Andrews et al., 1987). Following Hitchman and Leovy (1986), the zonal mean wind inside the parenthesis is ap-proximated as the geostrophic wind
Ug = −
φ
f a. (2)
Gradient winds are traditionally computed by applying (1) and (2) to temperature data and“tie-on”geopotential heights (Hitchman and Leovy, 1986; Randel, 1987). Unfortunately, the lower boundary of HRDI temperature retrievals is at 65 km, well above the highest level (about 50 km) at which daily geopotential analyses are provided by the National Center for Environmental Prediction (NCEP) and the United Kingdom Meteorological Office (UKMO) operational weather predic-tion models. An alternative formulapredic-tion is obtained by dif-ferentiating (1) with respect to the scaled log-pressure coor-dinatez, and applying the hydrostatic relation
z =H−1RT (3)
to obtain
∂U
∂z +p(z)U=q(z) (4)
where
p(z)= ∂Ug
∂z (2a cosφ+Ug)
−1 (5)
and
q(z)= −RTφ H(a f +Ugtanφ)
. (6)
Equation (4) is afirst-order differential equation which can be readily solved given an appropriate boundary condition forU. Fleminget al. (1996) have shown that away from the tropics, UARS seasonally averaged zonal mean zonal winds agree well with CIRA-86 gradient winds at 66 km. Thus,
U is set to the HRDI wind at 65 km, and (4)–(6) are solved entirely from HRDI observations. The vertical shear of the geostrophic wind, required to evaluate p(z), is determined from HRDI zonal mean temperatures according to
∂Ug
∂z =
−R
H f aTφ. (7)
The geostrophic windUg, required to evaluateq(z), is found
by integrating (7) with respect toz. Using Eq. (1) with the condition that U = UHRDI at 65 km gives the following
boundary value forUgat 65 km:
Ug =UHRDI
1− UHRDI 2a cosφ
−1
. (8)
Given the coefficientsp(z)andq(z)and the lower boundary condition, (4) is then solved forUby the method of variation of parameters.
(a)
(b)
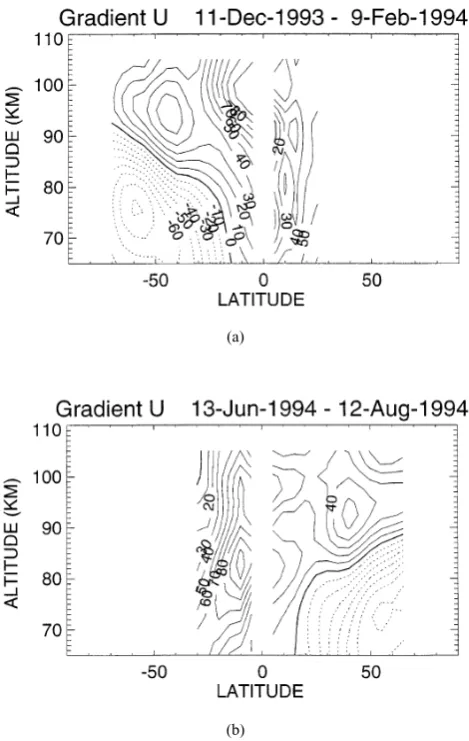
Fig. 5. Gradient zonal mean wind computed from temperatures in Fig. 2. (a) 11 December 1993–9 February 1994. (b) 13 June–12 August 1994. Values are smoothed with a 3-point running mean in latitude.
gradient approximation reproduces the essential features of the midlatitude winds in the summer hemisphere. These in-clude the closure of the easterly jet near 75 km, the reversal to westerlyflow between 85 and 95 km, and a westerly wind maximum near 95 km. For the December 1993–February 1994 interlude, gradient easterly wind maxima are slightly stronger than observed winds, while gradient westerly winds are slightly weaker. In the northern hemisphere summer (June–August 1994), the gradient wind approximation cap-tures an easterly maximum near 75 km, and a westerly max-imum near 45◦N. An additional westerly wind peak of 60 m s−1observed at 65◦N does not appear in the gradient wind
field.
The consistency between the gradient and HRDI summer winds deteriorates equatorward of 30 degrees. The gradient zero wind line in the summer hemisphere does not extend as far equatorward as the observed zero winds. As a result, gradient winds in the tropical summer latitudes are westerly between 65 and 85 km, while observed wind are easterly. Similarly, the gradient wind fails to reproduce the intrusion of winter hemisphere lower thermospheric easterlies across the equator, resulting in an excess of gradient westerly winds
above 95 km. While HRDI and gradient tropical winds are both directed westerly between 85 and 95 km, the gradient approximation greatly overestimates the westerly winds in this region.
3.2 Geostrophic balance at the equator
Equatorial zonally averaged winds and temperatures have been shown to obey thermal wind balance in the stratosphere (Andrewset al., 1987; Fleming and Chandra, 1989). The assumption of thermal wind balance in the equatorial MLT has been invoked to deduce MSAO zonal winds from tem-peratures (Garcia and Clancy, 1990) and conversely, to in-fer MSAO temperatures from zonal winds (Palo and Avery, 1993). More recently, Garcia et al. (1997) compared the HRDI vertical wind shears at the equator with the vertical shear of the geostrophic wind derived from SME tempera-tures. The twofields compared well qualitatively below 80 km, but differed in magnitude and sign above this level, pos-sibly because of tidal contamination of SME temperatures.
The present study enables an examination of geostrophy at the equator using simultaneous HRDI wind and tempera-ture measurements. Latitude-height projections of compos-ite time-mean and monthly averaged HRDI MLT tempera-ture (not shown) indicate that the meridional gradient of the zonal mean temperature is quite weak at the equator. Thus, following Fleming and Chandra (1989), L’Hopitals’rule is invoked and Eq. (1) is differentiated with respect to latitude, and evaluated at the equator to yield
U2
a +2 U= −
φφ
a . (9)
Neglecting thefirst term on the LHS of (9) and differentiating the remaining terms with respect tozyields
Uz = −
R
2a HTφφ. (10)
(a)
(b)
Fig. 6. Composite monthly mean (a) vertical shear of perturbation HRDI equatorial zonal mean wind. (b) RHS of Eq. (10), using HRDI perturbation temperatures shown in Fig. 4(b). Units are s−1. Fields are scaled by 104.
4.
Discussion
HRDI daytime zonal mean winds and temperatures are examined for gradient wind balance at middle and high lat-itudes in the summer hemisphere. The gradient windfield reproduces the basic observed midlatitude summer structure: the mesospheric easterly jet, and the transition to a west-erly lower thermospheric jet. This MLT circulation has been shown to result from zonal momentum deposition by break-ing gravity waves (Leovy, 1964; Andrewset al., 1987).
Although visual inspection of Figs. 3 and 5 suggests a high level of consistency between HRDI and gradient winds at extratropical summer latitudes, quantitative consideration of the terms in Eq. (1) shows that strong ageostrophic zonal mean winds do exist. Figure 7 shows the difference between the LHS and the RHS of Eq. (1), which would vanish if HRDI winds and temperatures obeyed gradient wind balance everywhere. As before, the term inside the parenthesis is approximated by Ug. HRDI winds are substituted for U
appearing outside the parenthesis on the LHS of (1), and (2) is used to evaluate the RHS of (1).
Strong meridional accelerations are seen at the high sum-mer latitudes. Large values are found near the HRDI zero wind line during December solstice, and within the west-erly jet during both solstices above 100 km. Typical ex-tratropical momentum residuals are on the order of 300–400 m s−1day−1, with peak values of 500 m s−1day−1in the west-erly jets. To some extent, these values reflect the propagation of HRDI temperature uncertainties into the wind calculation. Equation (7), when applied at 45◦S with meridional and
ver-tical increments of 5◦and 2.5 km respectively, shows that a 7K uncertainty in the latitudinal temperature difference im-plies a maximum uncertainty of about 13 m s−1inU
g, or a
momentum residual of about 112 m s−1day−1. While this
error is significant, it does not account for the full range of meridional momentum residuals in Fig. 7. Physical causes of meridional wind accelerations include momentum advection by the mean meridional circulation, and momentum deposi-tion in the north-south direcdeposi-tion by gravity waves (Andrews
et al., 1987). Schoeberlet al.(1983) estimated the drag as-sociated with meridional propagation of gravity waves, and found it to be on the order of the zonal drag for horizontally isotropic waves. Typical values cited for MLT gravity-wave drag in the zonal direction are usually near 100 m s−1day−1 (Andrewset al., 1987; Huang and Smith, 1991), or about 1/3–1/4 of the highest numbers shown in Fig. 7.
(a)
(b)
Fig. 7. Residual meridional acceleration, in m s−1day−1. (a) 11 Decem-ber 1993–9 February 1994. (b) 13 June–12 August 1994. Values are smoothed using a 3-point running mean in latitude.
are dominated by the effects of the partiallyfiltered diurnal tide. The morphology of the (1,1) mode is clearly visible as alternating layers of northward and southward winds that exhibit asymmetry about the equator.
Diurnal temperatures and zonal winds are on the order of climatological (or time-mean) variability, and are there-fore not as readily discernible in the daytime averagefields (Figs. 2 and 3), nor can they be extracted by means of har-monic or modalfits (Hayset al., 1994; Lieberman and Hays, 1994; Forbeset al., 1997). Information about the diurnal tide can nonetheless be obtained by examining the spatial structure of differences between measurements taken close to 12 hours apart. Such a differencefield minimizes the time-mean and the 12-hour harmonic, while enhancing the diurnal tide at a particular phase. For a propagating diurnal tide, a fixed local time “snapshot”can provide information about the amplitude and the dominant zonal and vertical wavenum-ber. This strategy was employed by Wallace and Hartranft (1969) and Wallace and Tadd (1974) to examine diurnal tides in rawindsone data, and by Hitchman and Leovy (1985) and Lieberman (1991) to describe the propagating diurnal tide in the stratosphere.
For the solstice periods under consideration, maximum latitude coverage by HRDI is obtained with an 11-hour
dif-(a)
(b)
Fig. 8. As in Fig. 3, for meridional winds. (a) 11 December 1993–9 February 1994. (b) 13 June–12 August 1994.
con-(a)
(b)
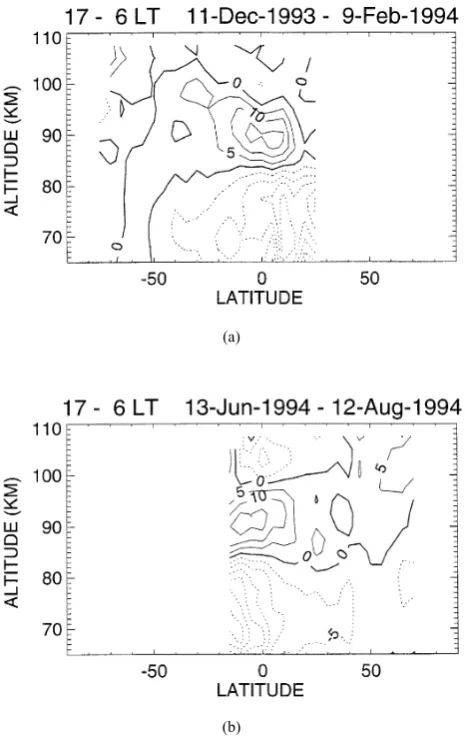
Fig. 9. Difference between HRDI zonal mean temperatures at 1700 and 0600 LT, divided by two. (a) 11 December 1993–9 February 1994. (b) 13 June–12 August 1994.
tain variations in the background state along with the diurnal tide. Similar statements are true for the 11-hour difference in zonal winds (not shown).
Figures 8 and 9 clearly indicate that diurnal tides of signif-icant amplitude are present in the daytime HRDI winds and temperature, which are not fully removed under 12-hour (i.e., 60-day) averaging. Thus, from the satellite perspective, the zonally averaged variables in Eqs. (1)–(10) represent the sum of the time-averaged zonal mean, and a diurnal tidal residue. The tidal presence in winds and temperatures suggests that when applied to HRDI data at low latitudes, (1) should be modified to include a tendency term reflecting aliasing by the diurnal tide. Equation (1) is then rewritten as
d V
whereV corresponds to the diurnal meridional wind. As-suming that the temporal variation of V is described by
V0cos( (t−tmax ))(heretis local time), then the meridional
diurnal tendency is of the form− V0sin( (t−tmax )). If
the diurnal tides are the primary source of the meridional mo-mentum residual, then the imbalance between the Coriolis,
radial and pressure gradient forces (plotted in Fig. 7) is also well described by− V0sin( (t−tmax )). Since (1,1)
prop-agates downward in local time (Hayset al., 1994), the low-latitude meridional momentum residues in Fig. 7 might be expected to resemble the product of with thefields in Fig. 8 shifted upward by one-quarter cycle.
Comparison of Figs. 7 and 8 indicate that in the tropical winter latitudes, a southward acceleration maximum cen-tered at 100 km is fairly well-correlated with a node in the diurnal meridional wind. The node is situated at an alti-tude where a southward tidal wind maximum occurs if the diurnal patterns in Fig. 8 are shifted upward by one quarter-cycle. Similar behavior of the opposite sign is observed on the other side of the equator. An additional region of north-ward acceleration centered at 85 km and 30◦N is similarly correlated with tidal node structure and a northward maxi-mum one quarter-cycle below. Assuming tidal amplitudes of about 25 m s−1, this would correspond to a maximum
tide-related acceleration of about±160 m s−1day−1. This value
is consistent with the acceleration in the tropical summer hemisphere during June–August 1994. However, in the win-ter hemisphere, and in both hemispheres during December– February, the observed accelerations near 100 km are at least a factor of two stronger. Thus, while aliasing by diurnal tides may account for a significant component of the low-latitude ageostrophy in Fig. 7, other factors may be contributing as well. Although diurnal tides clearly dominate the meridional winds, Fig. 8 suggests the presence of additional non-diurnal components, most notably at high latitudes. These could include a climatological mean meridional wind, as well as contamination from a semidiurnal tide with a time-varying amplitude. The momentum residuals in Fig. 7 might there-fore be ascribed to diurnal and semidiurnal aliasing, advec-tion of tidal and time-mean momentum by the mean merid-ional circulation, and gravity-wave, tidal and planetary-wave driving.
Finally, the effects of diurnal tides upon the terms in Eq. (10) are examined. Figure 10(a) shows a monthly mean com-posite of diurnal temperatures at the equator. This plot is analogous to Fig. 4(a), obtained by substituting HRDI day-time winds with diurnal temperatures evaluated at the lo-cal times sampled by HRDI. Diurnal temperature estimates used to create Fig. 10(a) are determined from HRDI diurnal meridional wind climatologies via classical tidal theory in the manner described by Lieberman and Hays (1994) and Lieberman (1997). Diurnal zonal winds and temperatures obtained in this manner at the equator are consistent with the more sophisticated, “tuned”diurnal estimates of Khattatov
et al.(1997) and Yudinet al.(1997) (Lieberman, 1998). Di-urnal equatorial temperatures peak near 95 km, and exhibit a prominent semiannual variation with the strongest ampli-tudes at equinox. The effects of the tidal oscillation are quite visible in the perturbation temperaturefield (Fig. 4(b)) above 90 km, where they account in part for the warm perturbations at equinox and the cold perturbations at solstice.
(a)
(b)
Fig. 10. (a) As in Fig. 4(a), with HRDI wind values replaced with classical tidal estimates of diurnal temperature (see text). (b) As in Fig. 6(b), using diurnal temperatures with the time mean removed.
the diurnal tide correspond to strong meridional curvatures of the equatorial temperature. The tide-induced values of the RHS of (10) result in strong positive values at 95 km at equinoxes, and negative values at solstices. These patterns are well-correlated with the values corresponding to HRDI temperatures above 90 km (shown in Fig. 6(b)). Thus, the presence of tides in daytime temperatures are a likely source of the inconsistency between vertical wind shears derived from HRDI winds and from temperatures above 90 km.
5.
Summary
Gradient zonal mean winds computed from HRDI tem-peratures are compared with independently measured HRDI zonal mean winds. The gradient windfield contains the key observed features in the midlatitude summer hemisphere. These include the closure of the mesospheric easterly jet, the reversal to westerlyflow above 90 km, and the closure of the westerly jet near 100 km. Consistency between gradient and observed HRDI winds deteriorates at tropical latitudes, where gradient winds exhibit excessive westerly shear. A geostrophic wind relation at the equator derived by applying L’Hopitals rule (1989) is examined. The vertical wind shear is qualitatively consistent with the curvature of the equatorial temperaturefield below 90 km. However, tidal contamina-tion of daytime equatorial temperatures gives rise to very large differences between the RHS and LHS terms of (8) above 90 km.
Significant ageostrophy is present in the summer hemi-sphere at higher latitudes and altitudes. The meridional
mo-mentum residual in these regions may be indicative of drag due to meridionally propagating gravity waves, and momen-tum advection by the mean meridional circulation. Strong ageostrophic winds are also inferred at low latitudes. While these patterns may arise from wave drag and advective forces in the tropics, they are likely indicative of tidal aliasing. Be-cause the propagating diurnal tides cannot be fullyfiltered from the daytime temperatures and winds, geostrophic bal-ance cannot be realized in the HRDI data at low latitudes.
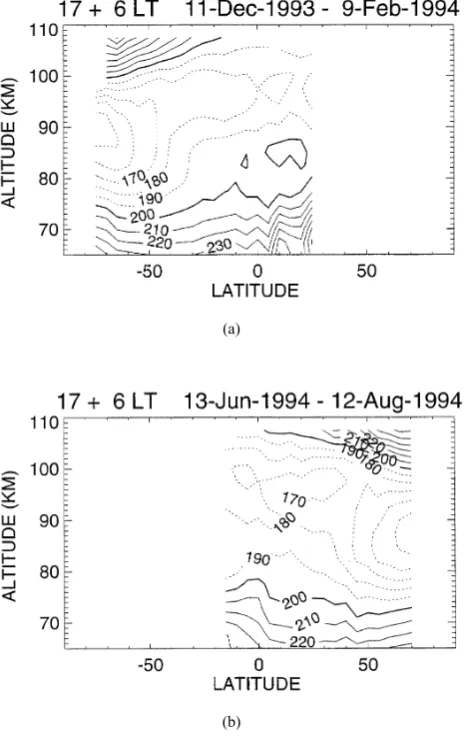
(a)
(b)
Fig. 11. Sum of HRDI 1700 and 0600 LT zonal mean temperaturefields, divided by two (a) 11 December 1993–9 February 1994. (b) 13 June–12 August 1994.
lidar temperature climatologies at Urbana (40◦, 88◦W) de-rived from daytime and nighttime measurements (States and Gardner, 1998).
The contamination of HRDI daytime zonally averaged data by diurnal tides gives rise to strong horizontal and merid-ional gradients at low latitudes, thereby rendering the tem-peratures ineffectual for computing low-latitude balanced winds. Proper filtering of global-scale ageostrophic cir-culations such as tides is imperative in order to carry out an unambiguous, global assessment of MLT gradient wind balance. Hopefully, the emergence of daytime and night-time resonance lidar measurements, and the anticipated day-night MLT coverage during the Thermosphere-Ionosphere-Mesosphere Energetics and Dynamics (TIMED) mission will enable this objective to be realized.
Acknowledgments. The author thanks Elsayed Talaat, and Drs. Valery Yudin, Steve Eckermann, Biff Williams and Walter Robin-son for helpful discussions during the manuscript preparation. The comments of Dr. Scott Palo and an anonymous reviewer are grate-fully acknowledged. This research is supported by NSF under grant ATM-981227.
References
Abreu, V. J., A. Bucholtz, P. B. Hays, D. A. Ortland, W. R. Skinner, and J.-H. Yee, Absorption and emission line shapes in the O2atmospheric bands: Theoretical model and limb viewing simulations,Appl. Opt.,28, 2128–2137, 1989.
Andrews, D. G., J. R. Holton, and C. B. Leovy,Middle Atmosphere Dynam-ics, Academic Press, Orlando, FL, 1987.
Burrage, M. D., N. Arvin, W. R. Skinner, and P. B. Hays, Observations of the O2atmospheric band nightglow by the High Resolution Doppler Imager,J. Geophys. Res.,99, 15,017–15,023, 1994.
Burrage, M. D., M. E. Hagan, W. R. Skinner, D. L. Wu, and P. B. Hays, Long-term variability in the solar diurnal tide observed by HRDI and simulated by the GSWM,Geophys. Res. Lett.,22, 2641–2644, 1995. Burrage, M. D., R. A. Vincent, H. G. Mayr, W. R. Skinner, N. F. Arnold,
and P. B. Hays, Long term variability in the equatorial middle atmosphere zonal wind,J. Geophys. Res.,101, 12,847–12,854, 1996a.
Burrage, M. D., W. R. Skinner, D. A. Gell, P. B. Hays, A. R. Marshall, D. A. Ortland, A. H. Manson, S. J. Franke, D. C. Fritts, P. Hoffman, C. McLandress, R. Niciejewski, F. J. Schmidlin, G. G. Shepherd, W. Singer, T. Tsuda, and R. A. Vincent, Validation of mesospheric and lower ther-mospheric winds from the high resolution Doppler imager,J. Geophys. Res.,101, 10,365–10,392, 1996b.
Chapman, S. and R. S. Lindzen,Atmospheric Tides, Gordon and Breach, New York, 1970.
Fleming, E. R. and S. Chandra, Equatorial zonal wind in the middle atmo-sphere derived from geopotential height and temperature data,J. Atmos. Sci.,46, 860–866, 1989.
Fleming, E. R., S. Chandra, J. J. Barnett, and M. Corney, Zonal mean temperature, pressure, zonal wind and geopotential height as functions of latitude,Adv. Space Res.,10, 11–59, 1990.
Fleming, E. R., S. Chandra, M. D. Burrage, W. R. Skinner, P. B. Hays, B. H. Solheim, and G. G. Shepherd, Climatological mean wind observations from the UARS high-resolution Doppler imager and wind imaging inter-ferometer: Comparison with current reference models,J. Geophys. Res., 101, 10,455–10,473, 1996.
Forbes, J. M., Atmospheric tides 1. model description and results for the solar diurnal component,J. Geophys. Res.,87, 5222–5240, 1982. Forbes, J. M., M. Kilpatrick, D. Fritts, A. H. Manson, and R. A. Vincent,
Zonal mean and tidal dynamics from space: An empirical examination of aliasing and sampling issues,Ann. Geophys.,15, 1158–1164, 1997. Garcia, R. R. and R. T. Clancy, Seasonal variation in equatorial mesospheric
temperatures observed by SME,J. Atmos. Sci.,47, 1666–1673, 1990. Garcia, R. R., T. J. Dunkerton, R. S. Lieberman, and R. A. Vincent,
Clima-tology of the semiannual oscillation of the tropical middle atmosphere, J. Geophys. Res.,102, 26,019–26,032, 1997.
Hays, P. B., V. J. Abreu, M. E. Dobbs, D. A. Gell, H. J. Grassl, and W. R. Skinner, The high-resolution Doppler imager on the upper atmosphere research satellite,J. Geophys. Res.,96, 10,713–10,723, 1993. Hays, P. B., D. Wu, M. D. Burrage, D. A. Gell, H. J. Grassl, R. S. Lieberman,
A. R. Marshall, Y. T. Morton, D. A. Ortland, and W. R. Skinner, Obser-vations of the diurnal tide from space,J. Atmos. Sci.,51, 3077–3093, 1994.
Hedin, A. E., E. L. Fleming, A. H. Manson, F. J. Schmidlin, S. K. Avery, R. R. Clark, S. J. Franke, G. J. Fraser, T. Tsuda, F. Vial, and R. A. Vincent, Empirical wind model for the upper, middle and lower atmosphere,J. Atmos. Sol.-Terr. Phys.,58, 1421–1447, 1996.
Hitchman, M. H. and C. B. Leovy, Diurnal tide in the equatorial middle atmosphere as seen in LIMS temperatures,J. Atmos. Sci.,42, 557–561, 1985.
Hitchman, M. H. and C. B. Leovy, Evolution of the zonal mean state in the equatorial middle atmosphere during October 1978–May 1979,J. Atmos. Sci.,43, 3159–3176, 1986.
Huang, T. Y. W. and A. K. Smith, The mesospheric diabatic circulation and the parameterized thermal effect of gravity wave breaking on the circulation,J. Atmos. Sci.,48, 1093–1111, 1991.
Khattatov, B. V., M. A. Geller, V. A. Yudin, P. B. Hays, and R. A. Vincent, Diurnal migrating tide as seen by HRDI/UARS. part 1: Monthly mean global meridional winds,J. Geophys. Res.,102, 4405–4422, 1997. Leblanc, T. and A. Hauchecorne, Recent observations of mesopause
tem-perature inversions,J. Geophys. Res.,102, 19,471–19,482, 1997. Leovy, C. B., Simple models of thermally driven mesospheric circulations,
J. Atmos. Sci.,21, 327–341, 1964.
Lieberman, R. S., Nonmigrating diurnal tides in the equatorial middle at-mosphere,J. Atmos. Sci.,48, 1112–1123, 1991.
in the equatorial lower thermosphere,J. Atmos. Sol.-Terr. Phys.,59, 1483–
1490, 1997.
Lieberman, R. S., Intraseasonal variability of HRDI winds in the equatorial mesosphere and lower thermosphere,J. Geophys. Res.,103, 11,221–
11,228, 1998.
Lieberman, R. S. and P. B. Hays, An estimate of the momentum deposition in the lower thermosphere by the observed diurnal tide,J. Atmos. Sci., 51, 3094–3105, 1994.
Lieberman, R. S., M. D. Burrage, D. A. Gell, P. B. Hays, A. R. Marshall, D. A. Ortland, W. R. Skinner, and D. L. Wu, Zonal mean winds in the equatorial mesosphere and lower thermosphere observed by the High resolution Doppler Imager,Geophys. Res. Lett.,20, 2849–2852, 1993. Manson, A. H., C. E. Meek, E. Fleming, S. Chandra, R. A. Vincent, A.
Phillips, S. K. Avery, G. J. Fraser, M. J. Smith, J. L. Fellous, and M. Massebeuf, Comparisons between satellite-derived gradient winds and radar-derived winds from the CIRA-86,J. Atmos. Sci.,48, 411–428, 1991.
McLandress, C., G. G. Shepherd, and B. H. Solheim, Satellite observations of thermospheric tides: Results from the wind imaging interferometer on UARS,J. Geophys. Res.,101, 4093–4114, 1996.
Morton, Y. T., R. S. Lieberman, P. B. Hays, D. A. Ortland, A. R. Marshall, D. Wu, W. R. Skinner, M. D. Burrage, D. A. Gell, and J. H. Yee, Global mesospheric tidal winds observed by the High Resolution Doppler Imager on board the Upper Atmosphere Research Satellite,Geophys. Res. Lett., 20, 1263–1266, 1993.
Ortland, D. A., P. B. Hays, W. R. Skinner, M. D. Burrage, A. R. Marshall, and D. A. Gell, A sequential estimation technique for recover-ing atmospheric data from orbitrecover-ing satellites, inThe Upper Mesosphere and Lower Thermosphere: A Review of Experiment and Theory, volume 87 ofGeophysical Monograph series, edited by R. Johnson and T. Killeen, pp. 329–337, American Geophysical Union, Washington, D.C., 1995.
Ortland, D. A., P. B. Hays, W. R. Skinner, and J. H. Yee, Remote sensing of mesospheric temperature and O2(1!)band volume emission rates with the high resolution Doppler imager,J. Geophys. Res.,103, 1821–1835, 1998.
Palo, S. E. and S. K. Avery, Mean winds and the semiannual oscillation in the mesosphere and lower thermosphere at Christmas Island,J. Geophys. Res.,98, 20,385–20,400, 1993.
Randel, W. J., The evaluation of winds from geopotential height data in the stratosphere,J. Atmos. Sci.,44, 3097–3120, 1987.
Schoeberl, M. R., D. F. Strobel, and J. P. Apruzese, A numerical model of gravity wave breaking and stress in the mesosphere,J. Geophys. Res.,88, 5249–5259, 1983.
She, C. Y., J. R. Yu, D. A. Krueger, R. Roble, P. Keckhut, A. Hauchecorne, and M. L. Chanin, Vertical structure of the midlatitude temperature from stratosphere to mesosphere (30–105 km),Geophys. Res. Lett.,22, 377–
380, 1995.
States, R. J. and C. S. Gardner, Influence of the diurnal tide and thermo-spheric heat sources on the formation of mesothermo-spheric temperature inver-sion layers,Geophys. Res. Lett.,25, 1998 (to appear).
Wallace, J. M. and F. R. Hartranft, Diurnal wind variations, surface to 30 kilometers,Mon. Wea. Rev.,97, 446–455, 1969.
Wallace, J. M. and R. F. Tadd, Some further results concerning the vertical structure of atmospheric tidal motions within the lowest 30 kilometers, Mon. Wea. Rev.,102, 795–803, 1974.
Yudin, V. A., B. V. Khattatov, M. A. Geller, D. A. Ortland, C. McLandress, and G. G. Shepherd, Thermal tides and studies to tune the mechanistic tidal model using UARS observations,Ann. Geophys.,15, 1205–1220, 1997.