Combining elicited imitation and fluency features for oral proficiency
measurement
Deryle Lonsdale and Carl Christensen
Brigham Young UniversityProvo, Utah, USA 84602
lonz@byu.edu, cvchristensen@gmail.com
Abstract
The automatic grading of oral language tests has been the subject of much research in recent years. Several obstacles lie in the way of achieving this goal. Recent work suggests a testing technique called elicited imitation (EI) that can serve to accurately approximate global oral proficiency. This testing methodology, however, does not incorporate some fundamental aspects of language, such as fluency. Other work has suggested another testing technique, simulated speech (SS), as a supplement or an alternative to EI that can provide automated fluency metrics. In this work, we investigate a combination of fluency features extracted from SS tests and EI test scores as a means to more accurately predict oral language proficiency. Using machine learning and statistical modeling, we identify which features automatically extracted from SS tests best predicted hand-scored SS test results, and demonstrate the benefit of adding EI scores to these models. Results indicate that the combination of EI and fluency features do indeed more effectively predict hand-scored SS test scores. We finally discuss implications of this work for future automated oral testing scenarios.
Keywords: elicited imitation, simulated speech, oral proficiency, testing methods
1.
Introduction
Automated grading of oral proficiency is in theory at-tractive, though the current state of speech processing and recognition technologies still poses considerable chal-lenges. Oral proficiency is traditionally evaluated on two axes: accuracy—the proper use of vocabulary, gram-mar, and pragmatics—and fluency—the smooth, unhalt-ing delivery of conversational turns (Ellis, 1993; Cham-bers, 1997). We discuss and demonstrate how two test-ing methodologies—elicited imitation (EI) and simulated speech (SS)—can together address these abilities.
EI test items (Bley-Vroman and Chaudron, 1994) consist of aurally presented sentences recorded beforehand that are carefully engineered at various levels of linguistic complex-ity (Christensen et al., 2010). The subject must repeat back the sentences, and the responses are recorded and scored either by humans or by computer using specialized tech-niques (Graham et al., 2008). Scores from well designed EI tests correlate well with other oral proficiency tests such as the oral proficiency interview (OPI), which has standard-ized guidelines that target particular language features for assessing oral proficiency (ACTFL, 1999).
However, EI does not incorporate various spontaneous speech phenomena that are important indicators of global oral proficiency (Housen and Kuiken, 2009). Chief among these phenomena is oral fluency, since EI responses are too short and lack spontaneity. Other forms of oral-language testing (such as the OPI) are geared to identifying and test-ing these features much more accurately. These interview-style oral tests take advantage of normal discourse patterns to evaluate the control of a language learner over various aspects of language. However, this makes automatic scor-ing by computer more difficult. Recent work has focused on using automatically identified fluency features to serve as a measurement for grading (Koponen and Riggenbach, 2000).
Another automatic oral testing method is referred to as semi-direct or simulated speech (SS). A computer requests and records a student’s spontaneous free-form monologue in a simulated conversational setting instead of a dialog-or interview-style test. Automated scdialog-oring (Bernstein et al., 2010) usually employs a limited vocabulary language model for the ASR engine, phrase or word-spotting, or ex-traction of specific fluency-related features (Ginther et al., 2010; Cucchiarini et al., 2000). Of course, SS does not test skill at turn taking and other discourse strategies. SS tests are currently much more widespread than EI tests; ex-amples include the web-based TOEFL test (iBT), the sim-ulated OPI (SOPI), and the Computer Assisted Screening Tool (CAST) all make use of the SS testing methodology (Malone, 2007). SS scores also correlate strongly with those of OPI-style interview tests (Higgins et al., 2011). Both EI and SS tests offer advantages and pose challenges. Recent research has focused on combining them with the expectation that the result will be a more balanced auto-matic scoring approach. M¨uller et al. (2009) incorpo-rated both accuracy and fluency metrics in the calculation of a score for test items. Matsushita (2011) combined EI scores and SS scores in predicting OPI scores for Japanese learners. He identified eleven features that he could ex-tract from SS responses using the Julius recognition engine (Matsushita and Lonsdale, in print). They include the num-ber of types, numnum-ber of tokens, numnum-ber of pauses, silence length, tokens per speech runs, and speech time per run. The results were promising and invite validation in English, motivating this study. Specifically, we use a combination of automatically scored EI and SS tests to see how closely computer scores agree with expert test evaluators.
2.
Data and methods
place-ment tests. Upon semester completion, students take a se-ries of tests including a speaking language achievement test (sLAT). The sLAT is a 10-item simulated speech (SS) test that prompts the student to give spontaneous speech re-sponses. Tests are designed to adequately test all levels of language learners—from basic to academic level. The sLAT is administered on a computer, and responses are recorded for later human scoring.
Our data were recorded by a testing application at the ELC and then given a holistic score by a human grader on a scale of 1 to 7. Each test was double-scored by raters at the ELC according to a grading rubric. The test administrator then ran the scores though Facets (Many-Facet Rasch Mea-surement) for an in-depth analysis of rater bias. Finally, a weighted average score was assigned each test. The test files in this study ranged between 20 seconds to just under 2 minutes, and for each student the average length of file was between 50 seconds and a minute.
We also administered an EI test to the students at the same time. Each EI test was also double-scored by trained raters at the ELC.
We report on aggregated over three semesters, each semester having between 169 and 196 students, for a total of 492 students who took both tests and for whom scoring data is available.
We also scored the EI and SS test responses with the Sphinx automatic speech recognition (ASR) system (Lee, 1989). We used customized grammars for scoring the EI responses; sLAT responses were run through the recog-nizer using the off-the-shelf Hub4 language model and WSJ acoustic model. Targeted features were extracted from the ASR engine, and script-based postprocessing provided ad-ditional analysis (Xi et al., 2008). Each SS item score con-sisted of values for each of the 10 aggregate ASR fluency features.
For comparison purposes we also extracted fluency features from the SS responses using the Praat tool (Boersma and Weenink, 2005). Praat is an open-source signal processing and acoustic analysis program widely used for feature ex-traction from sound files (Pr´efontaine, 2010). Unlike with ASR, Praat feature extraction relies on no underlying mod-els to successively map layers of output. Instead features are identified by calculations that analyze the acoustic sig-nal for silence, voicing, syllable nuclei, and other properties as determined by specific heuristics.
Our use of Praat required only slight adjustment to a spe-cially designed script (De Jong and Wempe, 2009). Con-figuring the Praat script requires manual calibration of set-tings, such as the minimum threshold length for silence, a decibel threshold tuning parameter (defining silence within a speaker’s utterance), as well as the minimum decibel dip (defining the distinction between syllable peaks). For our work we calibrated these settings as follows:
• three-tenths of a second as the minimum length of si-lence
• -25 decibels as the tuning parameter for silence
• 2 decibels as the minimum dip between syllables.
Previous related work (Matsushita, 2011) used similar set-tings. We also adpoted the 400 millisecond boundary from previous studies to specify minimum silence duration, thus separating continuous speech runs. However, when we in-vestigated a portion of the data empirically, a shorter mini-mum seemed to better reflect human-perceived pauses and also improved experimental results. Accordingly, we short-ened the silence duration. We also omitted from silent-feature calculations any long silences at the beginning or end of the sound files.
Many of the features extracted—either via ASR using Sphinx or via signal processing using Praat—can be more accurately quantified by human judges. However, other fea-tures presumably cannot be assigned by a human judge, such as articulation rate or degree of adherence to an acous-tic model. In either case, when hand-scoring SS tests, the grader presumably does not consciously quantify these metrics but rather assigns a grade subjectively, taking into account an abstract representation of the subject’s fluency comprised by some combination of these metrics and other factors. The use of these computationally extracted flu-ency features can therefore be viewed more as an attempt to model the rater’s perception of a speaker’s fluency. The accurate identification of the most influential and discrimi-native features is consequently of interest and importance.
We evaluate the contribution of various combinations of features in two ways: with machine learning (ML) using the Tilburg Memory-Based Learning (TiMBL) system (Daele-mans et al., 2010), and using statistical modeling.
We used TiMBL to analyze the features, identifying which led to a more accurate prediction of the human-assigned sLAT score. The TiMBL program is commonly used in the machine learning field, usually in the context of language-related problems. TiMBL uses a variety of algorithms to establish a nearest-neighbor model based on training data that is then used to annotate incoming test items.
In our case the annotation (i.e. TiMBL’s guess) is the pre-dicted score for a given test item response based on the features extracted from it. The accuracy of the model is then scored by comparing the actual score versus the pre-dicted outcome for the sLAT item. TiMBL also reports a ranked list of the relative contribution of the features in the computing the results. The scores used to train the system in this case were weighted averages, which we used be-cause human scores often differ by a point or more. This additional margin for error is consistent with human-rating scoring practices.
We obtained test prediction accuracy scores via the leave-one-out method of prediction. In this approach, the model only performs one prediction per training run, the item be-ing tested havbe-ing been removed from the trainbe-ing data.
3.
Results
We ran two sets of features through TiMBL and obtained test prediction accuracy scores. The ASR training file con-sisted of 484 vectors each consisting of the ten fluency fea-tures extracted from the ASR transcription results. The Praat training file had 536 vectors consisting of the seven fluency feature extracted from the sound files, including a few sounds files that were not successfully recognized by the ASR system.
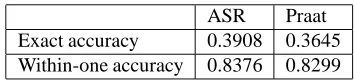
Table 1 shows the results, both for exact predictions and for within-one predictions (since human scoring often is computed this way). ASR slightly outperforms Praat-based scoring. Both ASR and Praat achieve exact accuracy above 30%; for within-one scores, the accuracy is around 83% for both systems. Thus prediction of sLAT scores based on ASR and Praat features gives good results and either method is a reasonable candidate for automating fluency feature extraction. Note that neither system’s accuracy matched those of Matsushita (2011) for Japanese; this is probably due to our 7-point scale outcome for sLAT versus his 3 or 4 level scale (3 or 4 outcomes).
ASR Praat Exact accuracy 0.3908 0.3645 Within-one accuracy 0.8376 0.8299
Table 1: Prediction accuracy for fluency features (machine learning)
Table 2 shows the relative ranking of contribution for both feature sets; they largely agree with Matsushita’s, with some permutation. Among the Praat features, speech rate emerged as the top discriminative feature. Not surprisingly, the simplest score extracted—total duration of the file—had the least discriminative effect on the predicted scores. Some features have equivalents in both the ASR and Praat feature sets (e.g. number of syllables, number of pauses), and many of these proved influential in overall calculations. One obvious exception was speech rate, which—as calcu-lated by Praat—proved to be the most discriminative fea-ture, but in Sphinx came up next to last in importance. This variation in feature importance could be a reflection of the quality of the speech rate as calculated by ASR versus by Praat, or it could just be a reflection of the inherent ASR in-accuracy of the pseudo-phonemes used by counting letters in orthography.
We then computed a statistical regression model on the data, evaluating the significance of the individual features and their respective impact on the model. We also com-puted t-tests for each feature; see Table 3. The results here contrast slightly with the TiMBL results; here Praat outper-forms ASR.
For the ASR model, the features that reached the level of statistical significance (p <0.05) are: (1) # of word types, (2) silence length, (3) speech length, and (4) # of runs. Table 4 shows regression values for the features obtained from Praat. The features that reached statistical significance for this model were: (1) # of syllables, (2) file duration, (3) articulation rate, and (4) phonation time.
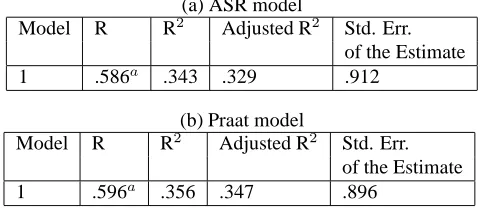
Figure 1 summarizes the results for both models. The Praat features yield a slightly better regression model than the ASR features did. Both models are statistically significant (ASR model: F = 25.459, p < 0.01; Praat model: F = 41.536, p <0.01).
For Experiment 2, we combined EI and SS scores with the goal of improving the ML results in predicting sLAT scores. This had the hoped-for effect of noticeably improving ML prediction accuracy for SS scores. The EI score proved to be the single most discriminative feature. The difference in the prediction accuracy was significant, with exact accuracy by TiMBL jumping to 49%, a 10% increase from the ML results reported above. The within-one accuracy reached more than 86%, a 3% increase. Although the nearly 50% accuracy is still not at the accuracy level reported in Mat-sushita (2011), it does approach human agreement metrics for the scoring of the sLAT files.
Analysis results for Experiment 3—combining the EI and SS scores—show similar improvement of results for the re-gression model. Rere-gression model statistics appear in Fig-ure 2. The overall improvement in the model’s R2 was
0.124. The difference in the R values is significantly higher with EI results included (p < 0.03) as determined by the Fisher r-to-z transform. The R2value of this new model
ap-proaches 0.5, indicating the about half of all the variance in the sLAT test scores can be accounted for by EI and fluency features. As demonstrated earlier with the TiMBL results as well as with this regression model, EI scores give signifi-cant additional information to the fluency features and thus improve the model’s ability to predict sLAT scores.
Model R R2 Adjusted R2 Std. Error
Regression 279.000 11 25.364 37.647 .000 Residual 317.998 472 .674
Total 596.998 483
(b) ANOVA
Figure 2: Regression model for joint EI and SS scores
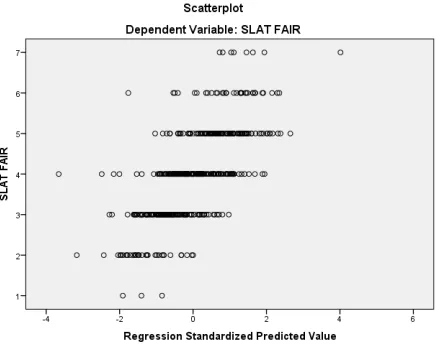
Figure 3 plots the regression model predictions by their ac-tual hand-graded sLAT results.
The analysis of the individual features of the combined model appear in the right-hand portion of Table 3. As ex-pected and demonstrated previously with ML results, EI scores produced the most significant t value. Importantly, none of the significant features in the ASR-only model were made obsolete by the addition of the EI scores, though they were reordered in their level of significance.
ASR features Praat features
1. # of runs 1. speech rate (# of syllables / file duration )
2. # of pauses 2. # of syllables
3. # of word types 3. # of pauses
4. # of word tokens 4. articulation rate (# of syllables / phonation time) 5. tokens / run 5. average syllable duration (speaking time / # syllables) 6. silence length 6. phonation time
7. speech length 7. file duration 8. speech time / run
9. speech rate (# of phonemes / sec.) 10. run word types/speech length
Table 2: Fluency feature rankings by order of significance
sLAT ASR sLAT ASR and EI combined
Unstandardized Standard- Unstandardized
Standard-Model Coeff. ized Coeff. t Sig. Coeff. ized Coeff. t Sig.
B Std. Err. Beta B Std. Err. Beta
(Constant) 3.518 .312 11.271 .000 .965 .402 2.401 .017
speech time/run -.022 .072 -.033 -.303 .762 .000 .066 .000 -.005 .996
speechRate .000 .009 .001 .029 .977 -.006 .009 -.035 -.750 .453
types/speechLen .051 .082 .076 .615 .539 .039 .075 .059 .513 .608
tokensPerRun -.045 .039 -.068 -1.172 .242 -.065 .038 -.090 -1.706 .089
speechLen -.107 .043 -.548 -2.490 .013 -.109 .039 -.561 -2.805 .005
silenceLen -.146 .035 -.582 -4.136 .000 -.106 .033 -.424 -3.249 .001
numTypes .117 .029 1.761 4.045 .000 .076 .027 1.144 2.851 .005
numTokens .030 .031 .510 .951 .342 .053 .029 .898 1.827 .068
numRuns -.142 .060 -.648 -2.383 .018 -.157 .055 -.710 -2.879 .004
numPauses -.023 .016 -.250 -1.465 .144 -.023 .015 -.249 -1.576 .000
EI ASR .008 .001 .398 9.914 .000
Table 3: Regressions for ASR feature coefficients
Unstandardized
Standard-Model Coeff. ized Coeff. t Sig.
B Std. Err. Beta
(Constant) 4.043 .715 5.653 .000
numSyl .016 .004 .450 3.948 .000
npause .020 .013 .119 1.631 .103
dur -.089 .016 -.328 -5.445 .000
phonationTime .038 .016 .268 2.309 .021
speechRate -.099 .130 -.055 -.763 .446
artRate .321 .117 .180 2.735 .006
ASD -.100 .141 -.028 -.713 .476
Table 4: Regressions for Praat feature coefficients
(a) ASR model
Model R R2 Adjusted R2 Std. Err. of the Estimate
1 .586a
.343 .329 .912
(b) Praat model
Model R R2 Adjusted R2 Std. Err.
of the Estimate
1 .596a .356 .347 .896
Figure 3: Regression model predicted values and sLAT scores.
from modeling technique further serves to validate these features as accurate broad-spectrum measures of global oral proficiency. Despite variable orderings of the features in their significance for the model, a representative model of oral proficiency can be created from fluency features and EI. Though fluency features for this analysis were limited to those identified in other studies, it seems clear from other research in area that other fluency features can be extracted and used successfully in the measurement of oral profi-ciency. The combination of these other features and EI may yet yield significantly better results. Because the results ac-count for less than 50% of the variance in sLAT scores, additional work must be done to further identify signifi-cant features. The within-one scores do demonstrate, how-ever, that the EI results and fluency features do give a good approximation of oral proficiency which could be used in lower-stakes testing scenarios.
The fluency features provided a relatively good account of the data. While the prediction accuracy for the ML model of the SS scores was not extremely high, the regression model demonstrated that over a third of the variance in scores (approximately 35% - R2 = 0.343 for ASR and R2 = 0.356 for Praat) can be explained solely by the fluency features extracted. These results identify a relatively strong relationship between fluency and overall SS scores.
4.
Conclusions and future work
By comparing the utility and advantages of feature extrac-tion using different automated tools, this study enables lin-guists to improve their targeted use of these tools in identi-fying accurate fluency features, whether by ASR or by stan-dalone signal processing. While the correlation and predic-tion accuracy of the models in this work does not reach the level where an automated exam would suffice for a high-stakes test, it does demonstrate the potential of using this style of testing battery to identify the approximate oral pro-ficiency of a speaker quickly and efficiently.The significant improvement of both the ML and regression model with the addition of the EI results clearly demon-strates that differing skills are represented in the EI and SS
tests. The increase of over 12% in the explanatory power of the regression model and the 10% jump in the predictive power of the TiMBL model indicate the value of the new information available in the EI test, information not repre-sented in the fluency features.
Though this work was inspired by Matsushita’s Japanese study, the granularity of these studies differed. He used fluency features at both the test-item level and at the sub-ject level in his feature vectors, whereas we aggregated the scores from the full SS test and averaged the features to obtain one fluency-feature vector per student.
As both fluency and accuracy are fundamental to the con-siderations of human graders in the assignment of a grade for an oral proficiency exam, neither EI or fluency features by themselves can give an accurate and complete picture of the global oral proficiency of the speaker.
The Praat results were not quite as good as the ASR results, but did not perform appreciably worse. The additional fea-tures available to the ASR system did not, in this study, sig-nificantly increase the utility of the ML model in correctly predicting the score. Possible advantages of an automated SS system that implements a Praat feature extraction would include increased speed of extraction and simpler process-ing without the need of additional models. The additional complexity of the ASR features appears to have been of no additional help in the correct prediction of SS scores.
5.
References
ACTFL. (1999). Oral Proficiency Interview Tester
Train-ing Manual. American Council on the TeachTrain-ing of
For-eign Languages, New York.
Bernstein, J., Moere, A. V., and Cheng, J. (2010). Val-idating automated speaking tests. Language Testing, 27(3):355–377.
Bley-Vroman, R. and Chaudron, C. (1994). Elicited im-itation as a measure of second-language competence. In Tarone, E., Gass, S., and Cohen, A., editors,
Re-search methodology in second-language acquisition,
pages 245–61. Lawrence Erlbaum, Northvale NJ. Boersma, P. and Weenink, D. (2005). Praat: doing
pho-netics by computer (version 4.3.29). Technical report, Amsterdam. Downloaded from http://www.praat.org/. Chambers, F. (1997). What do we mean by fluency?
Sys-tem, 25:535–544.
Christensen, C., Hendrickson, R., and Lonsdale, D. (2010). Principled construction of elicited imitation tests. In Cal-zolari, N., Choukri, K., Maegaard, B., Mariani, J., Odijk, J., Piperidis, S., Rosner, M., and Tapias, D., editors,
Proceedings of the Seventh International Conference on Language Resources and Evaluation (LREC’10), pages
233–238. European Language Resources Association (ELRA).
Cucchiarini, C., Strik, H., and Boves, L. (2000). Quan-titative assessment of second language learners’ fluency by means of automatic speech recognition technology.
Journal of the Acoustical Society of America, 107:989–
999.
De Jong, N. H. and Wempe, T. (2009). Praat script to de-tect syllable nuclei and measure speech rate automati-cally. Behavior research methods, 41(2):385–390. Ellis, R. (1993). The Study of Second Language
Acquisi-tion. Oxford University Press.
Ginther, A., Dimova, S., and Rui, Y. (2010). Conceptual and empirical relationships between temporal measures of fluency and oral english proficiency with implications for automated scoring. Language Testing, 27(3):379– 399.
Graham, C. R., Lonsdale, D., Kennington, C., Johnson, A., and McGhee, J. (2008). Elicited imitation as an oral pro-ficiency measure with asr scoring. In Proceedings of the
Sixth International Conference on Language Resources and Evaluation (LREC ’08), pages 57–67, Marrakech,
Morocco.
Higgins, D., Xi, X., Zechner, K., and M.Williamson, D. (2011). A three stage approach to the automated scoring of spontaneous spoken responses. Computer Speech and
Language, 25:282–306.
Housen, A. and Kuiken, F. (2009). Complexity, accuracy, and fluency in second language acquisition. Applied
Lin-guistics, 30(4):461–473.
Koponen, M. and Riggenbach, H. (2000). Overview: Varying perspectives on fluency. In Perspectives on
Flu-ency, pages 5–24. The University of Michigan Press.
Lee, K.-F. (1989). Automatic Speech Recognition: The
Development of the SPHINX System. Kluwer Academic
Publishers, Boston, MA.
Malone, M. (2007). Oral proficiency assessment: The use of technology in test development and rater training.
CALdigest, October.
Matsushita, H. and Lonsdale, D. (in print). Using simu-lated speech to assess Japanese learner oral proficiency. In Connor-Linton, J. and Amoroso, L. W., editors,
Mea-sured Language: Quantitative Studies of Acquisition, As-sessment, and Variation. Georgetown University Press.
Matsushita, H. (2011). Computerized oral proficiency test for japanese: Measuring second language speaking abil-ity with asr technology. Master’s thesis, Brigham Young University.
M¨uller, P., de Wet, F., van der Walt, C., and Nielser, T. (2009). Automatically assessing the oral proficiency of proficient l2 speakers. In Proceedings of SLaTE 2009. Pr´efontaine, Y. (2010). Differences in perceived fluency
and utterance fluency across speech elicitation tasks: A pilot study. In Kaufhold, K., McCulloch, S., and Tom-inc, A., editors, Papers from the Lancaster
Postgradu-ate Conference in Linguistics and Language Teaching (LAEL PG), volume 5, pages 134–154.