Spatial and Spectral Methods for Weed Detection
and Localization
Jean-Baptiste Vioix
UMR CPAP ENESAD CEMAGREF 21, boulevard Olivier de Serres, 21800 Quetigny, France Email: [email protected]
Jean-Paul Douzals
UMR CPAP ENESAD CEMAGREF 21, boulevard Olivier de Serres, 21800 Quetigny, France Email: [email protected]
Fr ´ed ´eric Truchetet
Le2i, IUT Le Creusot 12, rue de la Fonderie, 71200 Le Creusot, France Email: [email protected]
Louis Ass ´emat
INRA, Unit´e de Malherbologie et Agronomie, BP 86510 21065 Dijon Cedex, France Email: [email protected]
Jean-Philippe Guillemin
ENESAD laboratoire CBF, 21 boulevard Olivier de Serres, 21800 Quetigny, France Email: [email protected]
Received 26 July 2001 and in revised form 7 February 2002
This study concerns the detection and localization of weed patches in order to improve the knowledge on weed-crop competition. A remote control aircraft provided with a camera allowed to obtain low cost and repetitive information. Different processings were involved to detect weed patches using spatial then spectral methods. First, a shift of colorimetric base allowed to separate the soil and plant pixels. Then, a specific algorithm including Gabor filter was applied to detect crop rows on the vegetation image. Weed patches were then deduced from the comparison of vegetation and crop images. Finally, the development of a multispectral acquisition device is introduced. First results for the discrimination of weeds and crops using the spectral properties are shown from laboratory tests. Application of neural networks were mostly studied.
Keywords and phrases:weed detection, spatial analysis, spectral analysis, Gabor filter, neural network, image processing.
1. INTRODUCTION
Weed detection is extensively studied, as herbicide applica-tion has a relevant impact on farm economics and environ-ment. Developing a spraying strategy in the context of preci-sion agriculture needs to improve in-field detection of weeds. According to literature, weed detection using image analysis was directed through different approaches. First experimen-tal works were based on the spectral signature of weeds and crops. Vrindts and de Baerdemaeker [1] determined some specific spectral bands to achieve weed identification. Sta-tistical analyses were conducted to find spectral properties of each species. In the same way Pollet et al. [2] developed an imaging spectrograph. This device gave an image with
spray-ing control. Finally, last approach concerned remote sens-ing imagsens-ing. For example, aerial images taken with four cameras equipped with optical band-pass filters were used by Rew et al. [8] to discriminate weeds and crops. Weeds were detected by a significant increase in NDVI (normalized difference vegetation index). All these previous approaches were conducted in order to discriminate weeds and crops from their spectral signature or shape. The objective of this paper is to develop spatial then spectral methods upon aerial photographies in order to improve weed detection and localization.
2. ACQUISITION AND PREPROCESSING
2.1. Image acquisition for spatial investigation
A remote control aircraft was customized for this applica-tion. An OlympusµIIfilm1camera was placed in the hold;
the shot was manually triggered through the remote control. A miniature video camera and an embedded high frequency (HF) emitter provided online images of the flying-over area on a TV. Different flight altitudes were tested from about ten meters up to few hundred meters. The resulting resolution was found to vary from less than a centimeter per pixel up to some meters per pixel. After developing, films were dig-italized using a Canon CanoScan D660U scanner. 1702 by 1136 pixels images on red, green, blue (R, G, B) channels were obtained. Theses images were then saved in BMP format to avoid compression losses. Images analyzed in this paper corresponded to weed/crop competition test fields located in INRA domain in Dijon (France).
2.2. Georectification
In the case of high resolution images, only low altitudes flights were realized. Several shots were then needed to get the whole field. Landmarks (black and white draughtboard) were placed and georeferenced in the field using D-GPS co-ordinates (Trimble ProXRS) to locate images and also to give black and white references. A specific algorithm gave the transformation matrix between image coordinates and GPS coordinates.
3. IMAGE PROCESSING
3.1. Soil and plants discrimination
Two methods are generally employed, upon color images, to solve this problem: texture analysis or color discrimination. In most cases the first method is very efficient but the accu-racy depends on soil roughness (due to clods, tires, and im-plements prints) and needs high cost time algorithms. The second method is based on the color properties between soil and vegetation. In our case, the R, G, B color base did not ap-pear to give accurate colorimetric information when images are acquired under natural light. Indeed, color levels depend on lightness, that has to be separated from chromatic values.
1Aperture of 1 : 2.8 and focal of 35 mm, 24×36 mm films.
The HSV (hue, saturation, value) color base allows this sepa-ration but RGB-HSV transformation appears to be nonlinear and unstable for low RGB values. Steward and Tian [9] de-scribed another color base which is a linear combination of RGB values (1). This color base was specifically developed for vegetation images,
Equation (1) describes the base rotation. The three vec-tors (V1, V2, I) are unitary and perpendicular, so information
are fully independent;Icorresponds to the luminosity vector including shadows and other lightness defaults such as re-flects; (V1, V2) provide a colorimetric plane;V1is defined as
the difference between red and green channels. ThenV1is
positive for vegetation pixels and negative for soil pixels. In this paper only positive values ofV1were considered.
3.2. Seed frequency characterization
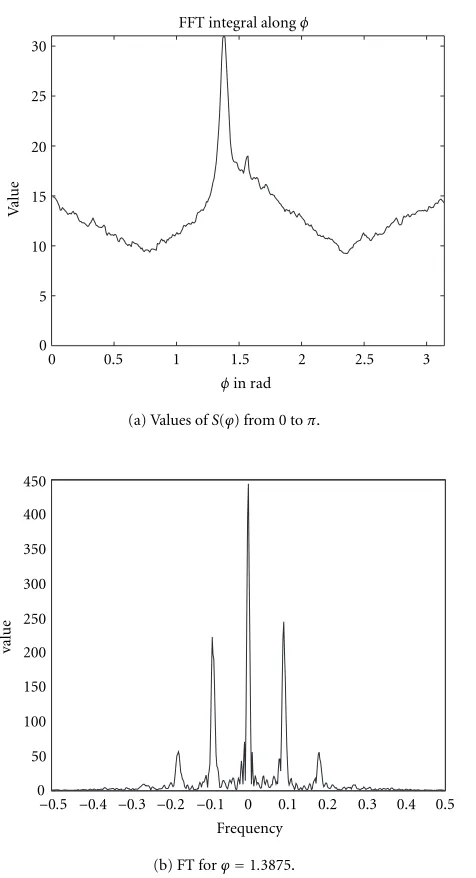
Previous image treatments led to vegetation images includ-ing crops and weeds. With the assumption that crops corre-sponded to repetitive structures, the Fourier transform op-eration was tested. The Fourier transform (FT) result cor-responded to the period and the rotation angle of periodic structures. For further investigation, the seed frequency have to be characterized. A sweeping line is used to find the angle of the seed frequency with the horizontal axis. Letϕbe this angle, the equation of a segment starting at the origin can be written as
x=tcosϕ, y=tsinϕ. (2) The sum of the FT along this line is the integral of the FT for this angle,
S(ϕ)= x≤X,y≤Y
t
FT(x, y), (3)
ϕvalues were calculated from 0 toπ;Sis normalized by the length of the line. Figure 1a shows the values ofSas a func-tion of the frequency angle. The maximum value ofSgives the angle of the frequency.
Then, the seed frequency is found using the FT for this angle. Figure 1b shows the FT for the maximum angle.
3.3. Low frequencies enhancement
0 0.5 1 1.5 2 2.5 3
FFT integral alongφ
(a) Values ofS(ϕ) from 0 toπ.
Figure1: Seed frequency characterization.
recursively repeated in order to obtain a frequency compat-ible with an accurate filtering. In our case, a value of 1/10 is needed which corresponds to about 10 pixels between two rows.
3.4. Gabor filter
The filter is a directive band-pass filter along the axis [10]. It was centered on ω, σx, and σy set the band width, re-spectively, along theR1 axis and theR2axis. Periodic
struc-tures with a frequency nearωand a rotation angle close to
ϕ value were unchanged but other structures were deeply faded,
(a) Spatial representation of Gabor filter.
0.5
(b) Fourier transform of Gabor filter.
Figure2: Spatial and spectral representation of Gabor filter.
with
R1=xcosϕ+ysinϕ, R2= −xsinϕ+ycosϕ. (5)
The spatial representation of g(x, y) is shown in Figure 2a, the FT in Figure 2b. It is a directive band-pass fil-ter cenfil-tered onω, and oriented byϕ. The width is defined by
σxandσy. After sampling, a mask can be defined. The size of
the mask depends onσxandσy. We truncateg(x, y) on the interval [−3ϕ,3ϕ], whereϕis the maximum of (σx, σy). We keep a good approximation with an acceptable filter size.
3.5. Gain computing
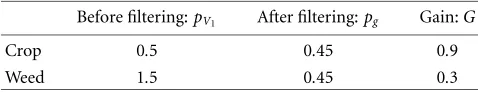
After filtering, crops would have a high value, but a simple thresholding did not give satisfying results. For example, on vegetation images crops and weeds have spread values (V1).
Table1: Example of gain computation for crop and weed pixels.
Before filtering:pV1 After filtering:pg Gain:G
Crop 0.5 0.45 0.9
Weed 1.5 0.45 0.3
thresholding (Table 1). The gain is defined for each vegeta-tion pixel as
G(x, y)= ppg(x, y) V1(x, y)
. (6)
In this equation,pg(x, y) is the module of the point after fil-tering, andpV1(x, y), the value of this point on the vectorV1.
If the gain is near 1, the point belongs to a periodic structure defined by the Gabor filter coefficients.
3.6. Results
We first decided to test this algorithm on synthesized im-ages to confirm the validity of the method. The test imim-ages were composed of parallel line with a high-frequency noise. After this step, we tried it on images of various crops. Re-sults depended on species and vegetation stages. Crops with an important spreading out as rape and barley gave bad re-sults. Indeed the space between two rows was rapidly hidden by foliage during the vegetation growth. So the discrimina-tion was almost impossible with this method. The FFT did not give the seedling frequency, so the Gabor filter cannot be tuned. On other species, the identification gave better results, and weeds can be found at early stage.
3.6.1 Low altitude image
Figure 3a shows an image of a corn field (6 per 3 meters with a resolution of around 5 mm per pixel). Some weeds can be noticed between two rows. After the processing, crops are shown in red and weeds appear in blue (Figure 3b). The end of some crop foils are detected as weeds. This default is prob-ably due to the foil shape elongation which corresponds to a high frequency signal.
3.6.2 High altitude image
Using some field tests of INRA, we also acquired high altitude images of weed patches. The pictures represent a ground-area of about 20 per 16 meters with a resolution close to 10 cm per pixel. The crop was corn (Zea mays) voluntary infested with green foxtail (Setaria viridis) patches at various densities. The main weed patches were well recognized, but some corn foils were still detected as weeds (Figure 5).
3.6.3 Partial conclusion
The algorithm for crop row detection was efficient from a quantitative point of view. Crops were well recognized, only some foil extremities were misclassified. Weeds were also
(a) Source image.
(b) Result image.
Figure3: Low altitude image.
C
W IR
B G R Input
8 neurons 8 neurons 2 neurons Output
Figure4: Neural network topology.
globally well classified. But, weeds located in crop rows were still detected as crops. This result led us to complete this pre-vious spatial analysis by a spectral approach.
4. FIRST WORKS ON SPECTRAL PROPERTIES
4.1. Development of a new image acquisition device for spatial and spectral investigation
Table2: Learning rule.
Neuron W Neuron C
Crop −0.9 0.9
Weed 0.9 −0.9
Soil 0 0
depending on the filter bandwidth. The four images are ac-quiered in less than 200 milliseconds. This device was specifi-cally developed to be embedded in a drone where dimension and weight constraints are more important than in an air-craft [8]. First trials of this device were realized in laboratory with onion crops and various weeds.
4.2. Crops and weeds spectral separation using a neural network
The principal component analysis (PCA) was evaluated to find some difference between crops and weeds. PCA was computed only on vegetation pixels in order to obtain the greatest decorrelation between (R,G,B,IR) vectors. As a re-sult, some slight variations on PCA vectors were found but these variations did not allow a relevant discrimination. This was probably due to a nonlinear combination of data (col-ors versus species). We then decided to test another classifier with nonlinear capabilities.
Considering the variability of natural images, a learning classifier can be an interesting solution [14]. In this case, few pixels are classified by the operator and the system learns the principal characteristics of this train set. For first trials, a very simple neural network was developed. The input vector is the value of the pixel on the four wavelengths. The input layer was composed of 8 cells with a linear activation func-tion. The internal layer had the same number of neurons but with a sigmoid function allowing a nonlinear classification of data (Figure 4). Then, the output layer was composed of 2 neurons for weed and crop (W and C) with also a sigmoid function. The values of −0.9 and 0.9 were preferred than, respectively, −1 and 1 for an accurate and better learning (Table 2).
Two training sets were tested. Both have ten pixels of crops and ten pixels of weeds, but one set included ten pixels of soil. Only the pixels of vegetation were classified with the network. The results were slightly better when some soil pix-els were considered for learning. In this case, the edge pixpix-els were better classified. Figure 6a shows the infrared band of the source image. Figures 6b and 6c show the results of the two neurons. A simple threshold (equal to 0.5) was applied to obtain theses images. The network is then able to distin-guish the two classes even if they are close. For example, on the top right corner (Figure 6a) a field bindweed2leaf is
cov-ered by an onion leaf. After classification, both plants are well classified.
2Convolvus arvensis L.
(a) Source image.
(b) Result image. Figure5: High altitude image.
5. CONCLUSION
A specific algorithm was developed in order to localize and discriminate weed directly from an aerial photography. The most significant result of this study consists of weed localiza-tion using spatial informalocaliza-tion given by frequency analysis. But, in most cases, weeds located in crop rows were still de-tected as crops.
In order to improve this previous method, species dis-crimination was tested through spectral information. A spe-cific CCD camera was developed using four optical fil-ters. With the assumption that a correlation can be sug-gested between spectrometric information and vegetation type (crop/weed), some classification tools were tested. Prin-cipal component analysis did not allow a good classification. Neural network gave better results due to its nonlinear acti-vation function.
(a) Source image (IR channel). (b) C neuron output (Crops). (c) W neuron output (Weeds).
Figure6: Crop/weed classification using a neural network.
ACKNOWLEDGMENTS
This project is financed with the help of ITCF (French Insti-tute for Cereal and Forage) and the council of Burgundy. Au-thors also thank INRA (Dijon research center) for field dis-posal.
REFERENCES
[1] E. Vrindts and J. de Baerdemaeker, “Optical discrimination of crops, weeds, and soil for on-line weed detection,” in Pre-cision Agriculture ’97, pp. 537–544, The SCI Agriculture and Environment Group, BIOS Scientific Publishers, 1997. [2] P. Pollet, F. Feyaerts, P. Wambacq, and L. van Gool, “Weed
detection based on structural information using an imaging spectrograph,” inProc. 4th International Conference on Preci-sion Agriculture, pp. 1579–1591, PreciPreci-sion Agriculture Center, ASA-CSSA-SSSA, July 1998.
[3] D. M. Woebbecke, G. E. Meyer, K. von Bargen, and D. A. Mortensen, “Shape features for identifying young weeds us-ing image analysis,” Transactions of the ASAE, vol. 38, no. 1, pp. 271–281, 1995.
[4] S. Yonekawa, N. Sakai, and O. Kitani, “Identification of ide-alized leaf types using simple dimensionless shape factors by image analysis,” Transactions of the ASAE, vol. 39, no. 4, pp. 1525–2533, 1996.
[5] A.-G. Manh, G. Rabatel, L. Assemat, and M.-J. Aldon, “In-field classification of weed leaves by machine vision using defomable templates,” inProc. 3rd European Conference on Precision Agriculture, pp. 599–604, Agro Montpellier, France, 2001.
[6] A.-G. Manh, G. Rabatel, L. Assemat, and M.-J. Aldon, “Weed leaf image segmentation by deformable templates,” J. Agric. Eng. Res., vol. 80, no. 2, pp. 139–146, 2001.
[7] R. H. Biller, A. Hollstein, and C. Sommer, “Precision applica-tion of herbicides by use of optoelectronics sensor,” inProc. 1st European Conference on Precision Agriculture, vol. 2, pp. 451–458, Technology IT and Management, Warwick Univer-sity, UK, 1997.
[8] L. J. Rew, D. W. Lamb, M. M. Weedon, J. L. Lucas, R. W. Meed, and D. Lemerle, “Evaluating airborne multispectral imagery for detecting wild oats in a seedling triticale crop,” in Pre-cision Agriculture ’99, pp. 265–274, The SCI Agriculture and Environment Group, Sheffield Academic Press, 1999. [9] B. L. Steward and L. F. Tian, “Machine-vision weed density
estimation for real-time outdoor lighting conditions,” Trans-actions of the ASAE, vol. 42, no. 6, pp. 1897–1909, 1999.
[10] Y. Hamamoto, S. Uchimura, M. Watanabe, T. Yasuda, Y. Mi-tani, and S. Tomita, “A Gabor filter-based method for recog-nizing handwritten numerals,” Pattern Recognition, vol. 31, no. 4, pp. 395–400, 1998.
[11] F. Feyarts, P. Pollet, L. van Gool, and P. Wambacq, “Sensor for weed detection based on spectral measurements,” inProc. 4th International Conference on Precision Agriculture, pp. 1537– 1548, Precision Agriculture Center, ASA-CSSA-SSSA, 1999. [12] R. Zwiggelaar, “A review of spectral properties of plants
and their potential use for crop/weed discrimination in row-crops,”Crop Protection, vol. 17, no. 3, pp. 189–206, 1998. [13] P. Navar, “Conception et r´ealisation d’une cam´era
multispec-trale,” Memoire d’ing´enieur, Conservatoire National des Arts et M´etiers, Centre r´egional associ´e de Sa ˆone et Loire, France, 2001.
[14] D. Moshou, H. Ramon, and J. de Baerdemaeker, “Neural network based classification of different weeds species and crops,” inProc. 2nd European Conference on Precision Agri-culture, pp. 275–284, The SCI Agriculture and Environment Group, Sheffield Academic Press, 1999.
Jean-Baptiste Vioix was born in Troyes, France, on September 11, 1977. He received the Master degree on image processing at University of Burgundy in 2000. He applies for a Ph.D. on image analysis. His research deals with development of a new sensor for weed detection.
Jean-Paul Douzalswas born in Strasbourg, France, on February 26, 1966. He received an Engineer Diploma in agriculture engi-neering in 1988 and obtained his Ph.D. at the University of Burgundy in 1999. Since 2000 he is involved in researches concerning sensors and processes for precison agricul-ture in a joined research team with Cema-gref, a French research institute for agricul-ture engineering, water and forest. Main
Fred Truchetetwas born in Dijon, France, on October 13, 1951. He received the Mas-ter degree in physics at Dijon University, France, in 1973 and a Ph.D. in electronics at the same University in 1977. He was for two years with Thomson-CSF as a Research En-gineer and he is currently full Professor in Le2i, Universit´e de Bourgogne (France) and CNRS, where he leads the image processing group. His research interests are focused on
image processing for artificial vision inspection and particularly on wavelets transform, multiresolution edge detection and image compression. He has authored and coauthored more than 150 pub-lications, three books and holds one patent. He is member GRETSI, ASTI, IEEE, SPIE, Chairman of SPIE’s conference on wavelet ap-plications in industrial processing, and member of some technical committees of international conferences in the area of computer vision.
Louis Ass´ematreceived his Ph.D. in plant ecology from Montpellier University in 1978. After postdoctoral studies in Japan at the National Institute of Genetics in Mishima and in Great Britain at the School of Plant Biology in Bangor (North Wales), he joined the Weed Science Department at the National Institute of Agronomic Re-search (INRA) in Dijon. His present inter-ests concern plant cover structure and
com-petition between species, their link with image analysis techniques and applications to precision agriculture for weed control.
Jean-Philippe Guillemin was born in France, on April 8, 1966. He received the Master degree in biology at Franche-Comt´e University in 1989 and the Ph.D. in biology (organism interaction) at Burgundy Uni-versity, in 1994. He was assistant professor on Agronomy in ENESAD (Etablisse-ment National d’Enseigne(Etablisse-ment Sup´erieur Agronomique de Dijon). His research is realized about study of competition